Choose Your Price: Windows 10 vs. macOS
Examining price discrimination among different operating systems
Team Members
Cem Akca, Alexander Bernevega, Shivani Gore, Boy Singmanee & Yonathan TesfaiContents
Team Members Contents Summary of Key Findings 1. Introduction 2. Initial Data Sets 3. Research Questions 4. Methodology 5. Findings 6. Discussion 7. Conclusion 8. ReferencesSummary of Key Findings
This preliminary exploratory research shows that price discrimination on Amazon does not occur among different operating systems through a clean research browser. The results of this research indicate randomness in Amazon's pricing and recommendation system that is constantly changing. The Operating system by itself is not a strong enough indicator to have Amazon’s algorithms structurally discriminate search results. One unique and consistent finding of this research suggests that there is a higher chance for macOS laptops to return unique products for search queries over a Windows laptop. Overall, algorithms are highly complex and dynamic, therefore it is a challenge to expose Amazon's algorithmic and tracking systems that are constantly changing and adapting to users.1. Introduction
As opposed to the increasing demand by researchers for transparency especially after in 2018 when it was leaked that a company named Cambridge Analytica gathered personal data of millions of users on Facebook to contribute to Trump’s campaign, platforms have taken steps in the other direction and enforced access lockdowns and restrictions to API for data collection (Walker et al. 1531). Platforms have been the center of attention as researchers from different fields shown more interest in privacy issues and started to raise more questions in regards to the collection and usage of personal data. The most common way to perform research and collect data on platforms was through their Application Programming Interfaces (API), which allows researchers to “extract records from the datasets made available by platforms” (Venturini and Rogers 532). Access to API was a crucial part of performing research on platforms, as it offered “huge quantities of data in a few clicks and ready to be analyzed” (Venturini and Rogers 536). As platforms enforced lockdowns and prevented researchers to extract data through their API’s, they have made it clear that ‘big business’ platforms do not always wish to be “followed”, as opposed to researchers' emphasis on “following the medium” (Perriam et al. 1). With the beginning of this new era, which is named as the “Post-API” era, researchers have proposed alternative ways to gather data from online platforms, through repurposing web data and making use of digital methods such as web scraping or employing interface methods (Perriam et al. 7). The ‘Post-API’ era of conducting research on platforms does not only apply to Facebook, Twitter or social networking platforms. By making use of tools developed for research purposes on specific platforms, one can repurpose and employ various digital methods to perform research. Thus, in this project, we aimed to extract data from Amazon by employing an Amazon tracker, Amtrax. The main purpose of our research was to see the relationship between pricing and users’ operating systems, namely Mac and Windows. It is already known by the public and by researchers that Amazon is using a variety of algorithms to track users and offer them personalized results and use dynamic pricing (Chen et al. 1). However, algorithms and pricing systems are not transparent to users, even though their shopping experience and spendings on Amazon is heavily influenced by these algorithms as they get personalized recommendations and different prices for the same product (Useem). As a result, users could be subject to price discrimination based on factors that they do not even know about, whether it is through the tracking of their web history or even their live location (Useem). While users' shopping experience, spendings and also privacy are heavily influenced by Amazon’s algorithms and tracking, it is not fully known on what factors a price discrimination may occur. The relationship between these algorithms and users' operating systems stands out as one of the possible factors that has not been researched in depth before. Thus, in this project, by employing digital methods and using the Amazon tracking tool Amtrax, we aim to analyze if there is a relationship between users operating systems and Amazon’s pricing.2. Initial Data Sets
| OPERATING SYSTEMS | QUERIES |
| Old Mac | laptop |
| New Mac | smartphone |
| Old Win | tablet |
| New Win | wireless earbuds |
 New Mac:
 Old Win:
 New Win:
3. Research Questions
- Do users’ operating systems affect Amazon pricing and search results?
4. Methodology
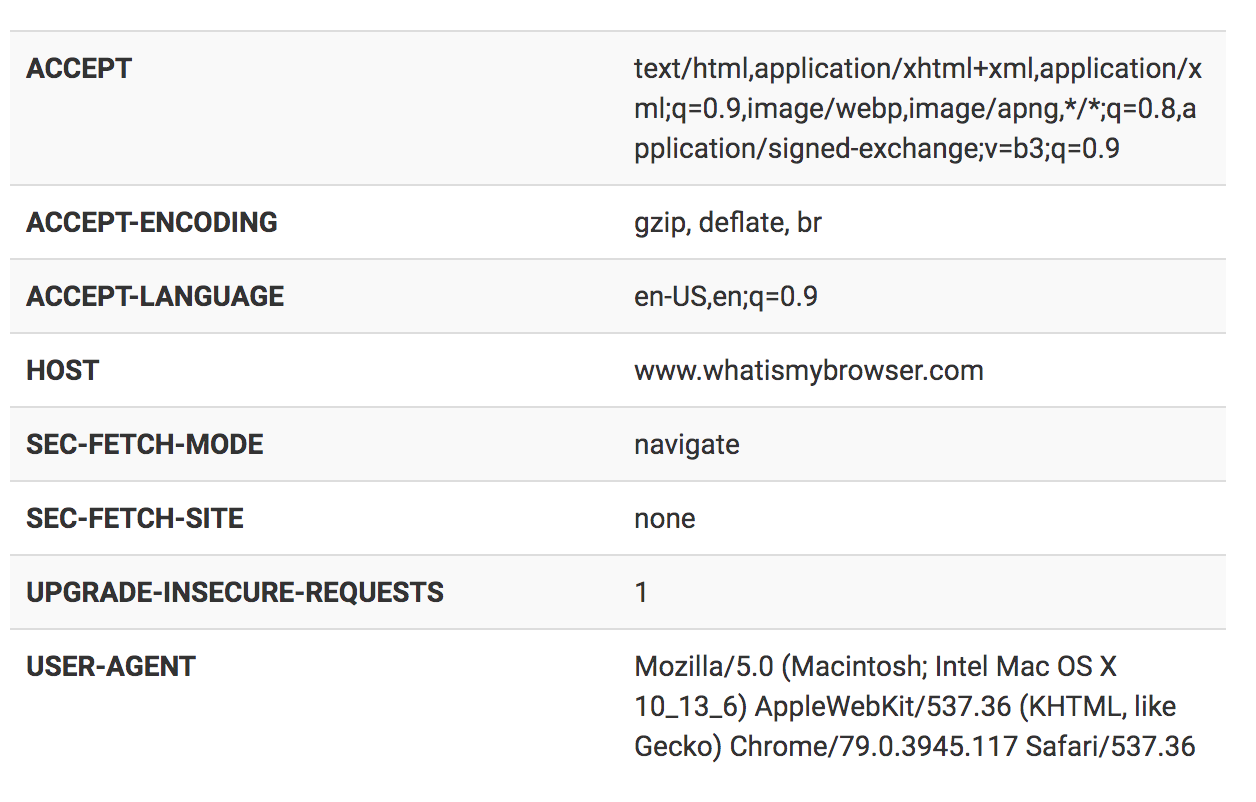
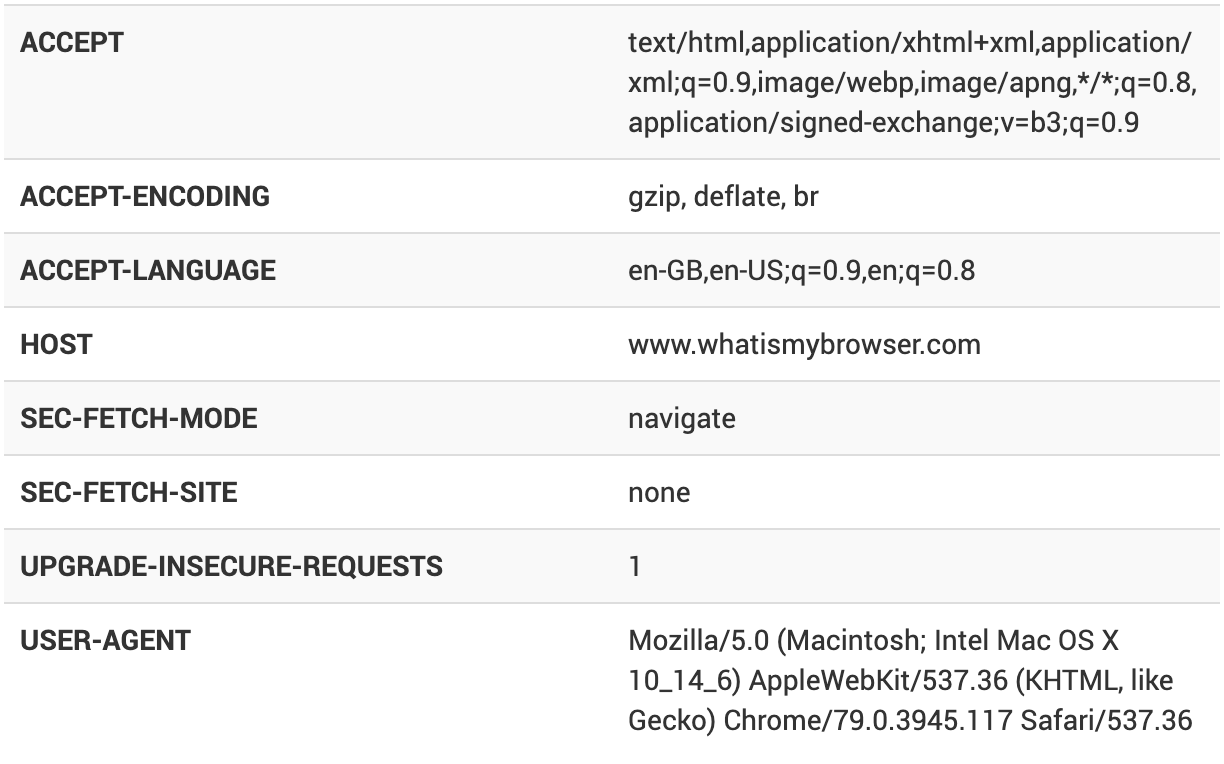
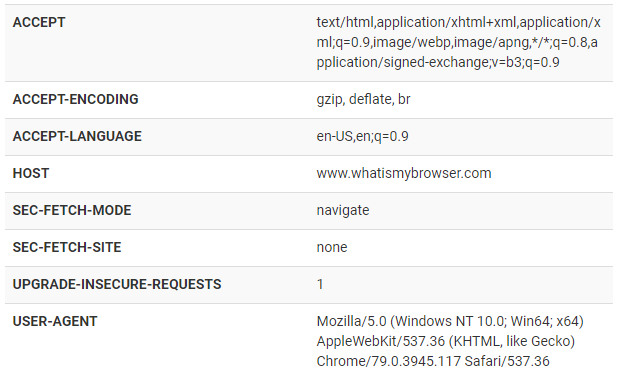
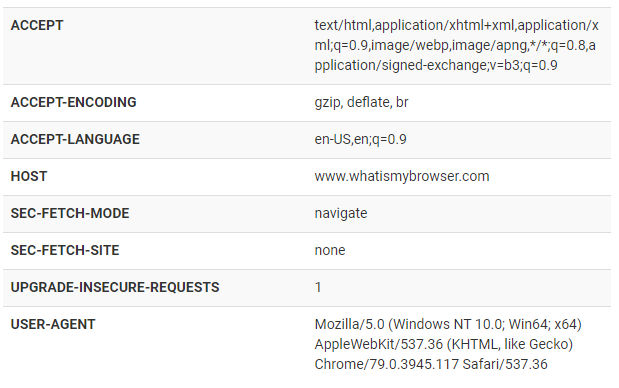
Data Gathering In order to answer the posed research question, we have decided to query amazon search from Windows- and macOS-based devices and collect the results with the Amazon Exposed Amtrex browser extension to compare them. We picked four devices for tests: two laptops running the latest version of Windows 10, one laptop running macOS High Sierra and one running macOS Mojave. To make sure that no other variables rather than the operating system were into play, we have tried to anonymize the devices as much as possible by installing a clean version of Brave browser, clearing all browser data, not logging in Amazon, turning browser history off in its preferences and setting English language and USD as currency on each device. In order to confirm whether Amazon is able to pick up the devices’ operating systems, we have used whatismybrowser.com to detect which HTTP headers our machines are sending to websites. As can be seen in Figure 1, the ‘user-agent’ header contained information not only about the operating system, but also its version for each device.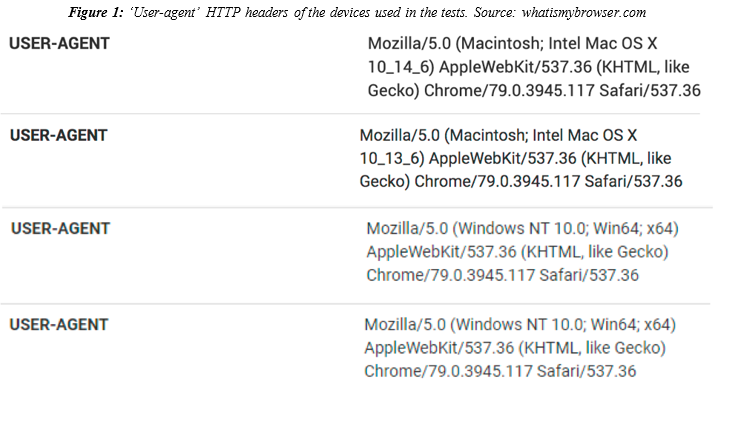 The next was to perform the queries. Amtrex extension was installed on all devices and ‘OS_Mac_clean’ and ‘OS_Win_clean’ tags were created in it to divide the collected data on the operating systems basis. [laptop], [smartphone], [tablet] and [wireless earbuds] were selected as queries because of our anticipation to see more Apple products or their accessories in macOS search results. After performing each query, the search results page would be scrolled down in order for the extension to pick all data on the shown products. To spot any patterns, this test was performed five times, with all browsing data cleared and Amazon settings managed between every attempt. However, the first and four consecutive tests were separated by date, as the former was performed on 15th
of January, and the latter throughout the day of 16th.
Data Visualization
To spot differences in search results and spot products unique to one operating system or even device, we have decided to visualize collected data as a network graph by employing Gephi. Amtrax extension assigns personal pseudonyms to users for identification in the CSVs with collected data that it generates. Thus, we exported these pseudonyms and all products displayed to them during the test to Gephi in the form of a nodes table, where we manually assigned ‘New Mac,’ ‘Old Mac,’ ‘New Win,’ ‘Old Win’ and ‘product’ tags to them, which allowed us to color-code the nodes. While both Windows-based devices were running the same version of Windows 10, the ‘Old Win’ tag indicated an older laptop with weaker hardware, so that our tests could potentially identify any hardware-related personalization in search results. For products, their final prices (with applied discounts and offers) were used as nodes’ labels, so that the ranges of unique products’ prices could be seen immediately. The edges’ table, also exported to Gephi, contained pseudonyms as ‘source’ and products as ‘target’ nodes.
In total, five Gephi network graphs were created, each representing a combination of all products shown to each of the four devices for every test.
The next was to perform the queries. Amtrex extension was installed on all devices and ‘OS_Mac_clean’ and ‘OS_Win_clean’ tags were created in it to divide the collected data on the operating systems basis. [laptop], [smartphone], [tablet] and [wireless earbuds] were selected as queries because of our anticipation to see more Apple products or their accessories in macOS search results. After performing each query, the search results page would be scrolled down in order for the extension to pick all data on the shown products. To spot any patterns, this test was performed five times, with all browsing data cleared and Amazon settings managed between every attempt. However, the first and four consecutive tests were separated by date, as the former was performed on 15th
of January, and the latter throughout the day of 16th.
Data Visualization
To spot differences in search results and spot products unique to one operating system or even device, we have decided to visualize collected data as a network graph by employing Gephi. Amtrax extension assigns personal pseudonyms to users for identification in the CSVs with collected data that it generates. Thus, we exported these pseudonyms and all products displayed to them during the test to Gephi in the form of a nodes table, where we manually assigned ‘New Mac,’ ‘Old Mac,’ ‘New Win,’ ‘Old Win’ and ‘product’ tags to them, which allowed us to color-code the nodes. While both Windows-based devices were running the same version of Windows 10, the ‘Old Win’ tag indicated an older laptop with weaker hardware, so that our tests could potentially identify any hardware-related personalization in search results. For products, their final prices (with applied discounts and offers) were used as nodes’ labels, so that the ranges of unique products’ prices could be seen immediately. The edges’ table, also exported to Gephi, contained pseudonyms as ‘source’ and products as ‘target’ nodes.
In total, five Gephi network graphs were created, each representing a combination of all products shown to each of the four devices for every test.
5. Findings
Table 1: Average prices of all queries and operating system of run number one| OS | QUERY | AVERAGE PRICE ($) |
| Old Mac | laptop | 264.1 |
| New Mac | laptop | 387.6 |
| Old Win | laptop | 264.1 |
| New Win | laptop | 264.1 |
| Old Mac | smartphone | 210.9 |
| New Mac | smartphone | 243.2 |
| Old Win | smartphone | 210.9 |
| New Win | smartphone | 210.9 |
| Old Mac | tablet | 106.7 |
| New Mac | tablet | 155.3 |
| Old Win | tablet | 86.5 |
| New Win | tablet | 106.7 |
| Old Mac | wireless earbuds | 44.2 |
| New Mac | wireless earbuds | 75.7 |
| Old Win | wireless earbuds | 44.2 |
| New Win | wireless earbuds | 44.2 |
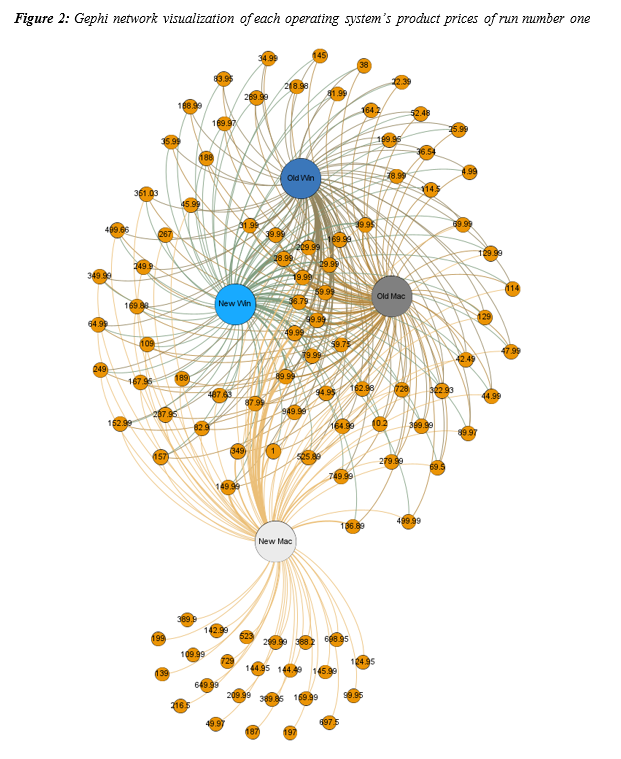 There was a total of five runs conducted on the four queries on January 15-16th, 2019. On January 15th, 2019, the first run was conducted and indicated results that confirmed the hypothesis, which suggested that the newest macOS laptop received the highest average price on all four queries combined (Table 1). Contrary, the oldest Windows OS laptop received the lowest average price on all four queries combined. The Gephi visualization of
Figure 2 shows the product prices and operating systems as nodes, highlighting common products that are shared and unique between each laptop. Figure 2 indicates that the newest macOS laptop has the most unique products that amazon suggested for all four queries, which potentially illustrates why it has the highest average price through the ForceAtlas2 layout that isolates nodes and form clusters through edges to achieve dynamic equilibrium (Jacomy et al.). We also went through the raw CSV file and noticed that the newest macOS laptop had expensive Bose wireless earphones within the search results, while the other laptops did not contain this product which explains why the newest macOS laptop had a high average price for the query “wireless earbuds”. Another observation shows that the first run received the highest amount of shared product prices than any other runs we conducted on the next day which had more unique product prices.
Table 2:
Average prices of all queries and operating system of run number two
There was a total of five runs conducted on the four queries on January 15-16th, 2019. On January 15th, 2019, the first run was conducted and indicated results that confirmed the hypothesis, which suggested that the newest macOS laptop received the highest average price on all four queries combined (Table 1). Contrary, the oldest Windows OS laptop received the lowest average price on all four queries combined. The Gephi visualization of
Figure 2 shows the product prices and operating systems as nodes, highlighting common products that are shared and unique between each laptop. Figure 2 indicates that the newest macOS laptop has the most unique products that amazon suggested for all four queries, which potentially illustrates why it has the highest average price through the ForceAtlas2 layout that isolates nodes and form clusters through edges to achieve dynamic equilibrium (Jacomy et al.). We also went through the raw CSV file and noticed that the newest macOS laptop had expensive Bose wireless earphones within the search results, while the other laptops did not contain this product which explains why the newest macOS laptop had a high average price for the query “wireless earbuds”. Another observation shows that the first run received the highest amount of shared product prices than any other runs we conducted on the next day which had more unique product prices.
Table 2:
Average prices of all queries and operating system of run number two
| OS | QUERY | AVERAGE PRICE ($) |
| Old Mac | laptop | 300.7 |
| New Mac | laptop | 270.5 |
| Old Win | laptop | 289.8 |
| New Win | laptop | 314.6 |
| Old Mac | smartphone | 98.8 |
| New Mac | smartphone | 149.5 |
| Old Win | smartphone | 178.4 |
| New Win | smartphone | 178.4 |
| Old Mac | tablet | 91.6 |
| New Mac | tablet | 90.4 |
| Old Win | tablet | 107.2 |
| New Win | tablet | 109.4 |
| Old Mac | wireless earbuds | 41.9 |
| New Mac | wireless earbuds | 46.4 |
| Old Win | wireless earbuds | 51.6 |
| New Win | wireless earbuds | 51.6 |
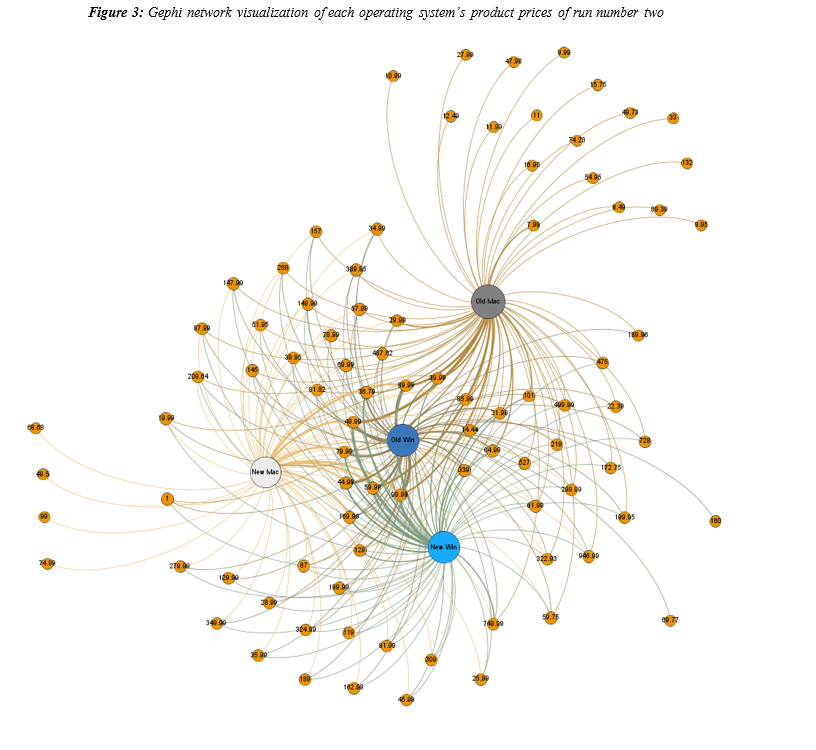 On the next day, we hope to replicate and strengthen our results obtained from yesterday as the second to fifth runs were conducted on January 16th, 2019. However, the second run indicated results that were contradicting the results of the first run, which suggests that the products and prices recommended by Amazon might be randomized rather than dependent on the operating system. On this run, both the older and newer Windows laptops received the highest average prices for all four queries instead of the newest macOS laptop (Table 2). The Gephi visualization of our second run illustrates that this time the older macOS laptop has the most unique products instead of the newer macOS laptop (Figure 3). In this case, even though the older macOS laptop returned more unique product prices that does not indicate that it will have the highest average price if compared to the case in Figure 2. Instead, it justifies why the older macOS laptop received the most unique products because it has significantly lower average prices of products.
Table 3: Average prices of all queries and operating system of run number three
On the next day, we hope to replicate and strengthen our results obtained from yesterday as the second to fifth runs were conducted on January 16th, 2019. However, the second run indicated results that were contradicting the results of the first run, which suggests that the products and prices recommended by Amazon might be randomized rather than dependent on the operating system. On this run, both the older and newer Windows laptops received the highest average prices for all four queries instead of the newest macOS laptop (Table 2). The Gephi visualization of our second run illustrates that this time the older macOS laptop has the most unique products instead of the newer macOS laptop (Figure 3). In this case, even though the older macOS laptop returned more unique product prices that does not indicate that it will have the highest average price if compared to the case in Figure 2. Instead, it justifies why the older macOS laptop received the most unique products because it has significantly lower average prices of products.
Table 3: Average prices of all queries and operating system of run number three
| OS | QUERY | AVERAGE PRICE ($) |
| Old Mac | laptop | 315.5 |
| New Mac | laptop | 315.5 |
| Old Win | laptop | 300.7 |
| New Win | laptop | 315.5 |
| Old Mac | smartphone | 230.9 |
| New Mac | smartphone | 191.9 |
| Old Win | smartphone | 163.7 |
| New Win | smartphone | 230.9 |
| Old Mac | tablet | 104.4 |
| New Mac | tablet | 103.3 |
| Old Win | tablet | 86.5 |
| New Win | tablet | 104.4 |
| Old Mac | wireless earbuds | 48.5 |
| New Mac | wireless earbuds | 46.4 |
| Old Win | wireless earbuds | 42.1 |
| New Win | wireless earbuds | 48.5 |
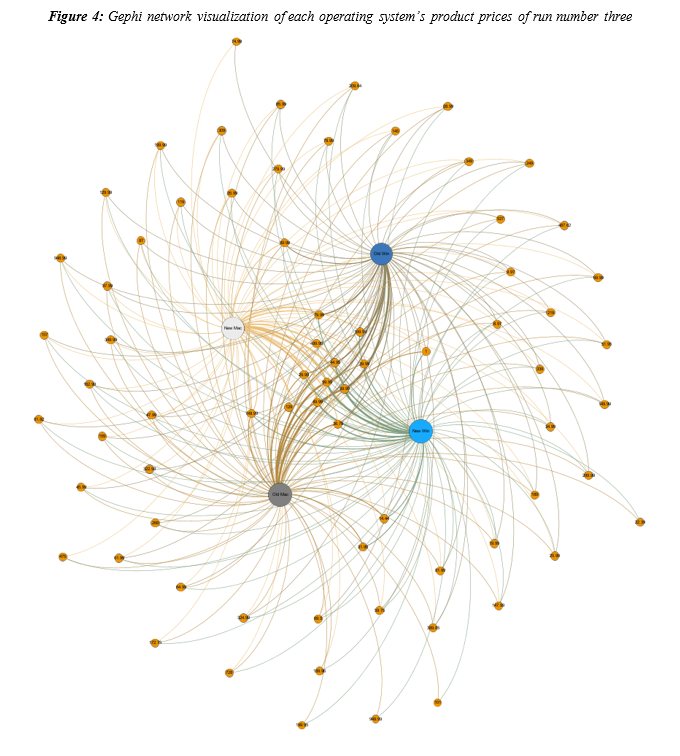 The third run added another layer of variation to the results as it indicates that both the old and new macOS laptops and the new Windows laptop had the highest average prices for the search queries, while the old Windows laptop had the lowest average price (Table 3). The Gephi visualization of the third run (Figure 4) is the most balanced as there were no unique product prices for each laptop if compared to the first two runs, suggesting that this time Amazon’s algorithmic product recommendation system showed similar products prices to all laptops.
| OS | QUERY | AVERAGE PRICE ($) |
| Old Mac | laptop | 252.5 |
| New Mac | laptop | 302.3 |
| Old Win | laptop | 290.6 |
| New Win | laptop | 290.6 |
| Old Mac | smartphone | 153.2 |
| New Mac | smartphone | 221.7 |
| Old Win | smartphone | 221.7 |
| New Win | smartphone | 221.7 |
| Old Mac | tablet | 86.7 |
| New Mac | tablet | 101.6 |
| Old Win | tablet | 101.6 |
| New Win | tablet | 101.6 |
| Old Mac | wireless earbuds | 39.1 |
| New Mac | wireless earbuds | 49.8 |
| Old Win | wireless earbuds | 49.8 |
| New Win | wireless earbuds | 49.8 |
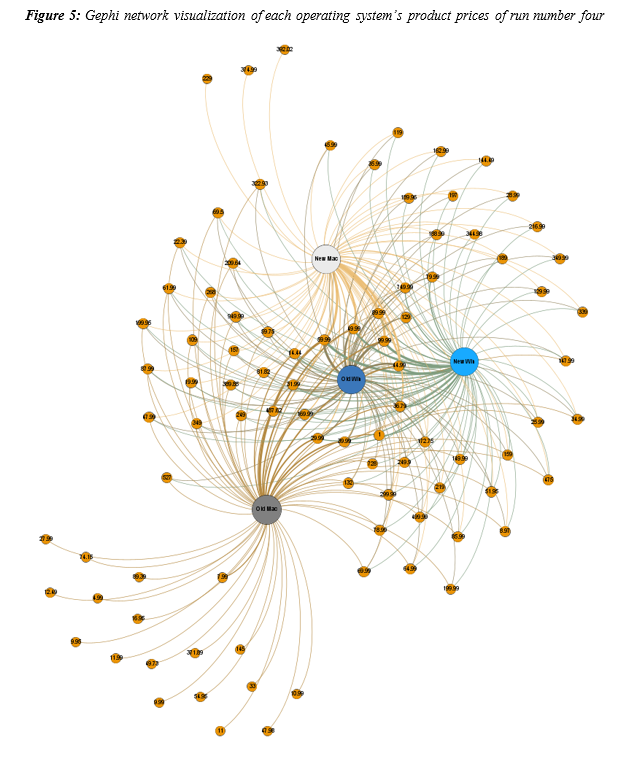 In the fourth run, the average price of the products was almost the same for the new macOS laptop and both the old and new Windows laptops, which indicates that Amazon’s algorithm product recommendation system showed similar products to all three laptops (Table 4). However, on this run, we noticed that the older macOS laptop had average prices that were significantly lower than the other laptops adding another layer of inconsistency if compared to previous runs. The Gephi visualization corresponds to the values of the average prices as the older macOS laptop had the most unique product prices because it has the lowest average prices for all four queries (Figure 5). In retrospect, the other three laptops had similar products as the average prices were almost the same, thus forming a large cluster that isolates itself from the older macOS laptop.
Table 5: Average prices of all queries and operating system of run number five
In the fourth run, the average price of the products was almost the same for the new macOS laptop and both the old and new Windows laptops, which indicates that Amazon’s algorithm product recommendation system showed similar products to all three laptops (Table 4). However, on this run, we noticed that the older macOS laptop had average prices that were significantly lower than the other laptops adding another layer of inconsistency if compared to previous runs. The Gephi visualization corresponds to the values of the average prices as the older macOS laptop had the most unique product prices because it has the lowest average prices for all four queries (Figure 5). In retrospect, the other three laptops had similar products as the average prices were almost the same, thus forming a large cluster that isolates itself from the older macOS laptop.
Table 5: Average prices of all queries and operating system of run number five
| OS | QUERY | AVERAGE PRICE ($) |
| Old Mac | laptop | 306.2 |
| New Mac | laptop | 256.9 |
| Old Win | laptop | 287.4 |
| New Win | laptop | 280.5 |
| Old Mac | smartphone | 182.6 |
| New Mac | smartphone | 112.1 |
| Old Win | smartphone | 182.6 |
| New Win | smartphone | 182.6 |
| Old Mac | tablet | 101.6 |
| New Mac | tablet | 69.1 |
| Old Win | tablet | 101.6 |
| New Win | tablet | 101.6 |
| Old Mac | wireless earbuds | 49.8 |
| New Mac | wireless earbuds | 35.9 |
| Old Win | wireless earbuds | 49.8 |
| New Win | wireless earbuds | 49.8 |
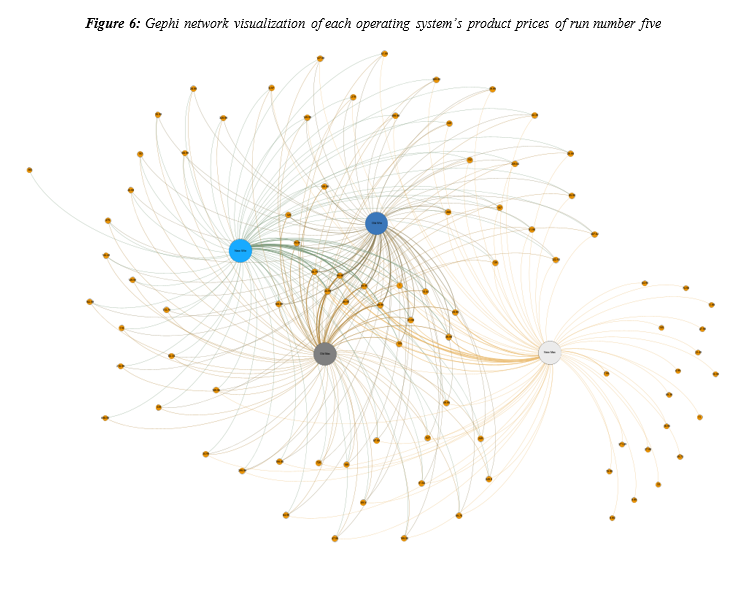 The fifth run had a similar result pattern to the fourth run, however, in this run, the newest macOS laptop had the lowest average prices instead of the older macOS laptop (Table 5). Even though there was a similar pattern to the fourth run, the values for the average prices of both runs are different. Since the newest macOS laptop had the lowest average prices, the Gephi visualization illustrates that the newest macOS laptop had the most unique product prices, while the other laptops shared common product prices (Figure 6).
Overall, the results suggest that there are no exact measures that indicate price discrimination between different operating systems, but rather the results indicate the randomness and unpredictability of Amazon’s algorithmic product recommendation system that constantly fluctuates the average prices of products regardless of the operating system. The only finding that has a degree of consistency within all five runs indicated that there is a higher chance for macOS laptops to obtain unique products with average prices that are either the lowest or highest of the run. In retrospect, Windows laptops rarely received unique product prices, which overall suggests that the products a Windows user receives from Amazon’s algorithmic recommendation system are more consistent than products a macOS user receives from Amazon’s system.
The fifth run had a similar result pattern to the fourth run, however, in this run, the newest macOS laptop had the lowest average prices instead of the older macOS laptop (Table 5). Even though there was a similar pattern to the fourth run, the values for the average prices of both runs are different. Since the newest macOS laptop had the lowest average prices, the Gephi visualization illustrates that the newest macOS laptop had the most unique product prices, while the other laptops shared common product prices (Figure 6).
Overall, the results suggest that there are no exact measures that indicate price discrimination between different operating systems, but rather the results indicate the randomness and unpredictability of Amazon’s algorithmic product recommendation system that constantly fluctuates the average prices of products regardless of the operating system. The only finding that has a degree of consistency within all five runs indicated that there is a higher chance for macOS laptops to obtain unique products with average prices that are either the lowest or highest of the run. In retrospect, Windows laptops rarely received unique product prices, which overall suggests that the products a Windows user receives from Amazon’s algorithmic recommendation system are more consistent than products a macOS user receives from Amazon’s system.
6. Discussion
The findings obtained throughout the runs performed on January 16th imply that there is an aspect of randomness in the personalization algorithms involved in the Amazon platform. While the findings do reveal the prevalence of price discrimination across different users, this discrimination could not be applied to the users’ operating systems given the results. However, it can be argued that the randomness of results is attributed to the constant changes that are being made to Amazon’s platform on a daily basis. Platforms - along with the algorithms that function on them - are highly complex and dynamic, and so are subject to constant upgrades and changes (Bastos and Mercea). Moreover, in our methodology, we maintained a clean browser and a clean Amazon search history, which can be understood as a form of sensory deprivation to Amazon’s personalization algorithms. Following the theory of the cold start problem in recommendation systems, these systems make use of users’ history of interactions and behavior to provide personalized recommendations (Bobadilla Sancho et al.). Therefore, using a clean browser and search history deprives the algorithms of any data from our previous searches and our browsing history. As a result, the system had no user information to predict behavior, and they were not provided with any data that is needed to create any sort of personalization for each user. Therefore, our efforts to maintain a clean browser turned out to be a limitation affecting our results. Another argument towards our results is the possibility that Amazon detected the unusual behavior. Given that each group member was connected to the same WIFI, each laptop would have the same or closely similar IP addresses, which could have been picked up by Amazon. Furthermore, the fact that each laptop was searching the exact same queries, the same number of times could also have been picked up as unusual behavior. This argument is reinforced by the fact that there was an increasing similarity in the average price of the queries across the different laptops and operating systems between each run. However, despite this, this argument is improbable. The obscurity of our findings is a reflection of the lack of transparency that Amazon offers with regards to its personalization algorithms and how they function. This lack of transparency is characteristic of post-API research - in particular, the shift from back-end research methods towards front-end methods (Gerber and Lynch). Regardless of this obscurity, however, our results did support our initial hypothesis, which assumed that price discrimination does exist on Amazon. It is both interesting and daunting to examine the initial and maintained differences in the average prices obtained by each team member. While the variable we tested - operating systems - did not prove to be a factor that contributed to these discrepancies, our study revealed that there are in fact other factor(s) that contribute to these varying prices. This research thus lays the foundation for further research on price discrimination factors on Amazon.7. Conclusion
Where does this leave us with regards to the question of Post-API research in general, and Amazon specifically? Looking at this research through the lens of Post-API research, it shows us that extracting meaningful data is hard without open access to the platform’s inner workings. Amazon specifically exemplifies this through the complexity of their personalization algorithm, a code that’s hard to crack, as seen in our findings. Looking toward the initial research question with our findings in mind, the results seem inconclusive. As the first question seeks to establish a link between the user’s operating system and Amazon’s pricing, the randomness of the findings does not show this link. While the results may not tell us the exact extent to which users’ OS determines query results, certain conclusions can be reached. As indicated by the findings, in three out of five runs, significantly more unique search results can be seen for the MacOS devices, answering the second research question posed. Furthermore, while using clean browsers and histories seems initially to be a good way to test the influence of a single variable, the randomness of the results can be read as implying that Amazon’s algorithms need some minimal degree of “pollution” to start personalizing. An avenue for further research could be found in Amazon’s possible detecting of our unusual browsing and querying behaviour. Ultimately, then, this research should be seen as a first step into researching Amazon’s personalization algorithms and the various elements of possible price discrimination. For future research, a similar approach can be conducted comparing cross-platform devices such as iOS and Android with macOS and Windows, but it will require developing a mobile version of the Amtrex extension to obtain results. Most Amazon users tend to browse Amazon more on mobile devices (Amazon application) rather than laptops (web browsers), therefore it will be interesting to see whether it produces more significant results than our current study.8. References
Bastos, Marco, and Dan Mercea. “The Public Accountability of Social Platforms: Lessons from a Study on Bots and Trolls in the Brexit Campaign.” Philosophical Transactions of the Royal Society A: Mathematical, Physical and Engineering Sciences, vol. 376, no. 2128, Sept. 2018, p. 20180003. DOI.org (Crossref), doi:10.1098/rsta.2018.0003. Bobadilla Sancho, Jesus et al. "A Collaborative Filtering Approach To Mitigate The New User Cold Start Problem. - Archivo Digital UPM". Oa.Upm.Es, 2020, http://oa.upm.es/15302/. Bruns, Axel. “After the ‘APIcalypse’: Social Media Platforms and Their Fight against Critical Scholarly Research.” Information, Communication & Society, vol. 22, no. 11, Sept. 2019, pp. 1544–66. DOI.org (Crossref), doi:10.1080/1369118X.2019.1637447. Chen, Le, et al. “An Empirical Analysis of Algorithmic Pricing on Amazon Marketplace.” Proceedings of the 25th International Conference on World Wide Web - WWW ’16, ACM Press, 2016, pp. 1339–49. DOI.org (Crossref), doi:10.1145/2872427.2883089. Gerber, Hannah R., and Tom Liam Lynch. “Into the Meta: Research Methods for Moving Beyond Social Media Surfacing.” TechTrends, vol. 61, no. 3, May 2017, pp. 263–72. DOI.org (Crossref), doi:10.1007/s11528-016-0140-6. Jacomy, Mathieu, et al. “ForceAtlas2, a Continuous Graph Layout Algorithm for Handy Network Visualization Designed for the Gephi Software.” PLoS ONE, edited by Mark R. Muldoon, vol. 9, no. 6, June 2014, p. e98679. DOI.org (Crossref), doi:10.1371/journal.pone.0098679. Perriam, Jessamy, et al. “Digital Methods in a Post-API Environment.” International Journal of Social Research Methodology, Oct. 2019, pp. 1–14. DOI.org (Crossref), doi:10.1080/13645579.2019.1682840. Useem, Jerry. “How Online Shopping Makes Suckers of Us All.” The Atlantic, May 2017, https://www.theatlantic.com/magazine/archive/2017/05/how-online-shopping-makes-suckers-of-us-all/521448/. Venturini, Tommaso, and Richard Rogers. “‘API-Based Research’ or How Can Digital Sociology and Journalism Studies Learn from the Facebook and Cambridge Analytica Data Breach.” Digital Journalism, vol. 7, no. 4, Apr. 2019, pp. 532–40. DOI.org (Crossref), doi:10.1080/21670811.2019.1591927. Walker, Shawn, et al. “The Disinformation Landscape and the Lockdown of Social Platforms.” Information, Communication & Society, vol. 22, no. 11, Sept. 2019, pp. 1531–43. DOI.org (Crossref), doi:10.1080/1369118X.2019.1648536.This project has received funding from the European Research Council (ERC) under the European Union’s Horizon 2020 research and innovation program (grant agreement No 825974-ALEX, with Stefania Milan as Principal Investigator; https://algorithms.exposed).
Edit | Attach | Print version | History: r2 < r1 | Backlinks | View wiki text | Edit wiki text | More topic actions
Topic revision: r2 - 14 Feb 2020, MarkDavis
Ideas, requests, problems regarding Foswiki? Send feedback