The wiki is being updated at the moment
The project is concerned with the media's visual representation of the vulnerable population who is being forced to leave their homelands and entering the European territory, and more specifically, with how and when are cartographic maps embedded in news articles in order to help narrate and contextualize these displacement. In other words, if the geographical nature of the current crisis has made national borders, roads, shores and coordinates into discursive actors, we may ask: how are maps then being employed as images of vulnerability? For insance, do they articulate a call for solidarity by recognizing the victims and their origins? Or, do they instead depict Europe solely as the recipient of the consequences of conflicts taking place elsewhere? And, do this change when the term migrant or refugee are being employed? Or, depending of the nationality of the media who is reporting? This distiction is relevant as the terms not only have distinct defintions and connotations but also they enable those who carry them different levels of access to solidarity, resources as well as national bounderies. For example, "Many critics say that those who call refugees “migrants” are prejudging them not to be fleeing persecution or war but to be seeking economic advantage, which means receiving countries can send them back" ( Spencer 2015).
In order to answer these question we bring into dialoge two theoretical frameworks, namely, critical cartography (a framework to perform map critique) and media witnessing (the study of the systematic representation of suffering in the media) and then follow to operationalize them using visual content analysis and digital methods. The first move is then theoretical. Critical cartography can be understood, broadly speaking, as an invitation to aproach maps not as netural representations, but instead as visual landscapes, cultural images and “a pictorial way of representing, structuring or symbolising surroundings”. Furthermore, maps are sources of formative values with meanings connected to social memories and identities (Daniels & Cosgrove 1988, 1) and they shape both “the self-image and worldview of the group and the conduct of the individual” (Assmann 2006, 44). Critical cartographers use these perspectives to reposition maps as active social documents and representations that construct knowledge and exercise power, thus revealing their social-politicised nature (Crampton & Kygier 2006; Harley 1988).
In practice they achieve this by: analysing the unique circumstances of the production and consumption of maps; paying attention to deliberate and non-deliberate distortions and their implicit or explicit rules of inclusion and exclusion; considering their representational hierarchies and ‘subliminal geometries’; interpreting their embedded signs and emblems; acknowledging that acts of repression can also be present during maps’ reception as much as production; and finally by recognising that maps themselves can become symbolic (Harley 1988; Barton & Barton 2004). While these approaches have tended to emphasise the power of dominant groups with control over cartographic production (Harley 1988), greater attention has recently been paid to the counter or alternative mapping practices that have increased –partly thanks to the development of the online open-source mapping tools that provide for a “greater pluralism of cartographic expression” (Harley 1988; 1989, 87; Crampton & Kygier 2006). In addition the continued critical study of maps has led to the increasing dissolution of previously assumed binaries of representation/practice, production/consumption and map/space in favour of performative approaches that emphasise that maps are practiced representations or ‘representational practices’, used by numerous social actors, and social actors who are themselves constantly implicated in dynamic processes of (re)writing and (re)reading (Del Casino & Hanna 2006)
Studying seemingly ‘neutral’, objective maps provides insight into the representation of non-Western others (refugees) in Western media. Visualizing and describing the choices that have been been in mediating their journey in Western news articles helps bring into focus what plight is really focused on. If the current influx of people in Europe is make understandable as a European problem, an issue impacting the self, what does that mean for the treatment of the ‘others’ that come in? What might be important in understanding refugees’ journey in terms of empathy or closeness to the other? The choice for these queries was motivated by the fact that the term ‘refugee’ implies a move away from something - fleeing from danger - while the term ‘migrant’ implies a choice for a particular destination, migrating towards a new space.
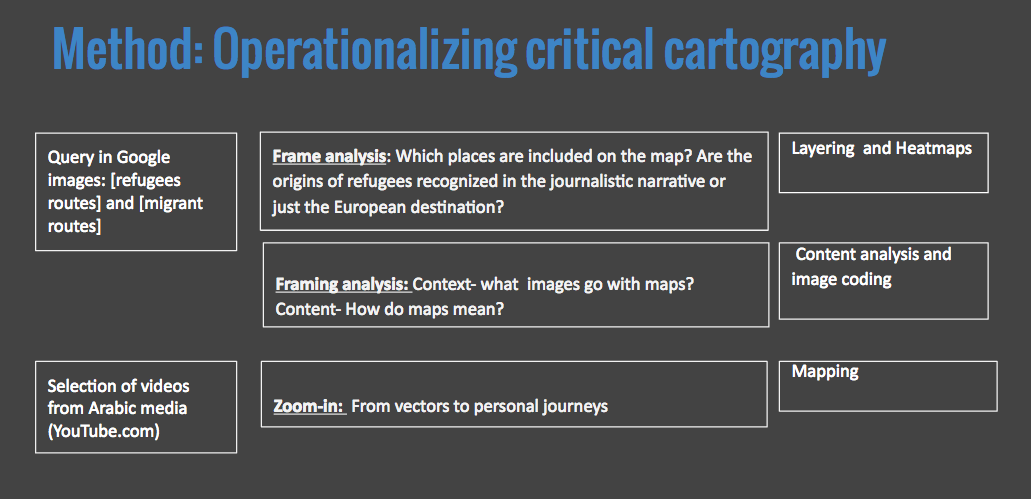
The result is a three-part project beging with frame analysis (who is in the map?), a framing analysis (which images accompany maps?) and a counter-mapping exercise through the technique of zooming-in (from vectors to personal journeys). In order to create a corpus for analysis a query design is performed, that is posing search engines with research questions in the format of query. The terms employed are: [migrant routes] and [refugee routes] in the english, dutch, french, italian, spanish, and arabic language. The first twenty search results for each language are captured, and when maps appeared the images are kept for further analysis (see Figure 1).
 Figure 1. Operationalizing Critical Cartography: Frame analysis, framing analysis and zoom-in.

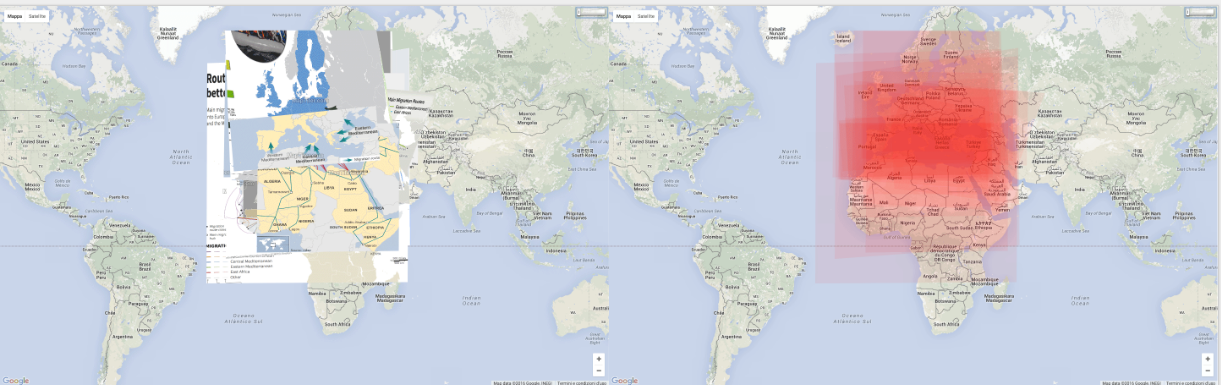 Maps of Migrant Routes found in English Media. Still image. Maps are dowloaded from online articles, layered on the world map, and then visualized as heatmap. For animation follow the link:
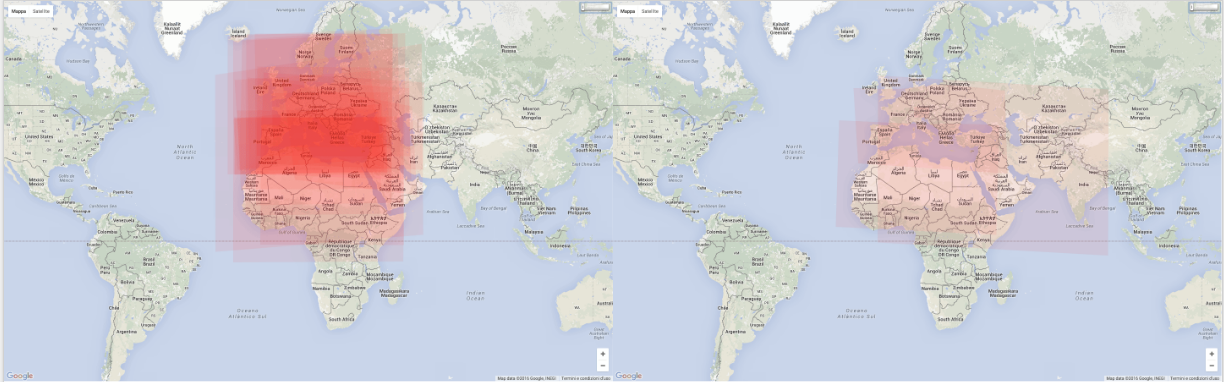 Maps of Refugee Routes found on English and Italian Media Visualized as Heatmaps. Still image. Maps are dowloaded from online articles, layered on the world map, and then visualized as heatmaps. For animation follow the link:

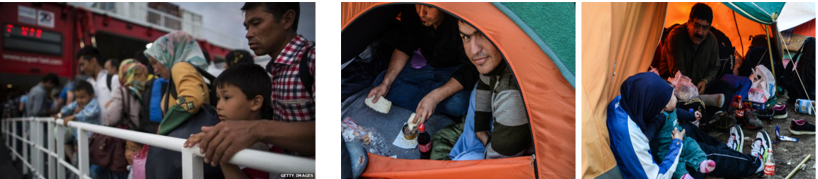
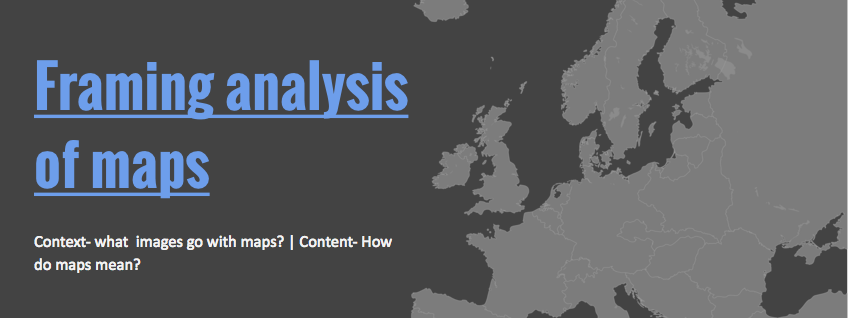
In the news articles which contained them, the maps visualizing the displacement of refugees are embedded in larger narratives and framed by headlines, text, captions and also other images. Taking this into account, the second question that we addressed is: which images tend to accompany this maps, framing the maps in such a way that they are made meaningful? Here we downloaded all images that are featured along with the geographical maps on the web pages collected in the previous section. This image dataset was then coded for the presence of a set of categories (see coding scheme in images mining section) and then visualized for comparison. What differences appear between the visual framing of maps in articles associated with the terms refugee or migrant? How does the nationality of the media source feature in this?
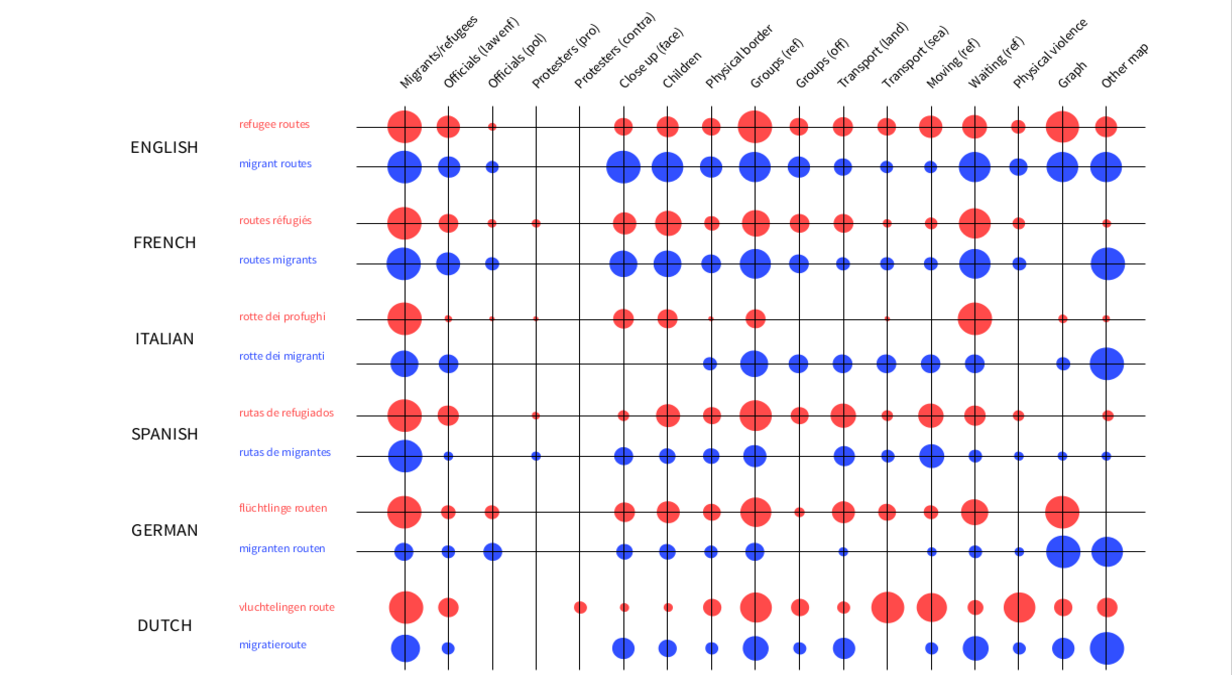
Images Mining : Starting with the web pages that contain the top migration maps ( findings from /1 ), we proceeded with a manual crawling in order to extract co-occurring images. While text mining and scraping may be considered an established field of research, leading to solid and trustworthy pieces of technology, automated image mining is a world yet to be discovered. This is the rationale behind a manual selection and classification of all these images. Firstly, it was important to state what query language is relative to the image ( FR, EN, AR … ) as well as indicating the specific vocabulary ( MIG or REF ) the maps (and thus the co-occurring images as well) belong to. So for each article containing at least one migration map, we collected all the other images, charts, and maps that were included, encoding them following this protocol: 1 = true0 = false
Presence of:
-
Migrants/refugees
-
Officials (law enforcement )
-
Officials (politician)
-
Protesters (pro)
-
Protesters (contra)
-
Close up (face)
-
Children
-
Physical border
-
Groups (refugees)
-
Groups (officials)
-
Transport (land)
-
Transport (sea)
-
Moving (refugees)
-
Waiting (refugees)
-
Physical violence
-
Graph
-
Other map
-
Location (shot where)
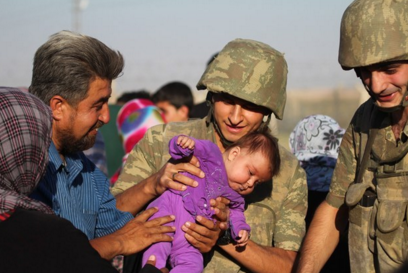
Migrants/refugees = 1, Officials (law enf) = 1, Officials (pol) = 0, Protesters (pro) = 0, Protesters (contra) = 0, Close up (face) = 1, Children = 1, Physical border = 0, Groups (ref) = 1, Groups (off) = 1, Transport (land) = 0, Transport (sea) = 0, Moving (ref) =0, Waiting (ref) = 1, Physical violence = 0, Graph = 0, Other map = 0, Location (shot where) = Syrian border
The location has been obtained using the caption or the context of the article, while the geocodes were found thanks to the geonames.org search engine. We also indicated the lack of images accompanying a map by adding 0 to all the coding points. For visualisation and analysis purposes we aggregated all our results by language and vocabulary. Finally, we normalized them.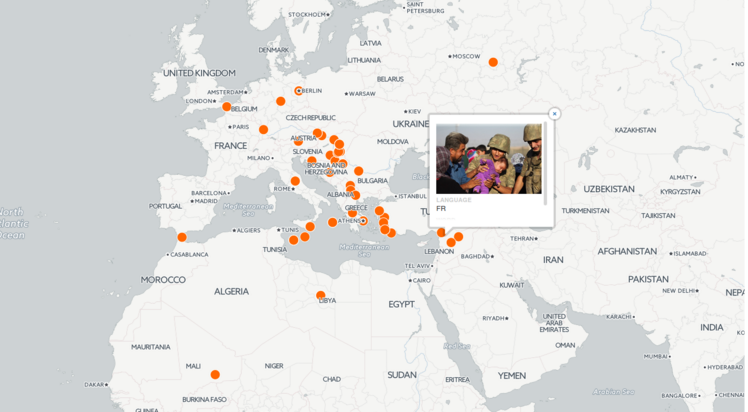
Since the dataset used is quite small, any findings can only be tentative. Nonetheless, some trends seem to warrant further investigation. Maps on migrant routes and refugee routes are both accompanied by visual narratives that represent migrants/refugees as inactive, passive and/or waiting. Instead of showing the officials (both political and law enforcement) that were undoubtedly encountered on the journey, photographs tend to focus on migrants/refugees themselves. Additionally, the images do not contain protesters, be it pro- or contra-migrants/refugees. Finally, accompanying images across the board do not depict the starting or final destinations of refugees/migrants; instead, they show a small part of the journey. This can be inferred from the locations (indicating where the image was taken) in the captions added to the photos.
There are also some characteristics that are present in every language’s media, specific to either maps that use refugee as a term or maps that speak of ‘migrants.’ First, maps showing migrant routes are more often accompanied by additional maps and graphs, i.e. the visual language of economics and policy. This framing of the maps hints at an economization of the discussion surrounding the influx of people in Europe. Maps depicting “refugee routes” show significantly more children and, presumably, families. This invokes the broader journalistic genre of ‘human interest’ and implies a concern with the moral issues concerning the issue. Secondly, the photographs accompanying maps that show refugee routes have a slightly stronger presence of law enforcement, indicating closer attention to the conflicts between Europeans and refugees - this attention is less marked when the discussion is framed in terms of ‘migrants’. A final important observation can be made concerning the images harvested from Arabic language web-pages. Perhaps unsurprisingly, these tend to focus on the dangers encountered on the way. The maps offer practical information for refugees, such as the location of bombs in certain regions on the Balkans, while the images show people under great hardships (frequently, in Eastern Europe).
Comparing Italy and the UK
Adding the distinction between countries produces a wealth of differences to be investigated. A complete analysis of European reporting would require both more data and statistical tools, so we decided to pursue one thorough comparison as a small pilot, to illustrate what kind of findings a larger project might produce. The countries we compared are Italy and England: a Northern European state and a Southern European state, with people entering Europe in the former and perhaps reaching their final destination in the latter. This produced the following specific observations, for which we have added some tentative (possible) explanations and interpretations below. We decided to focus on those aspects in the comparison that we saw occurring more generally as well. Something like this could be done for each of the countries on the list.
Italy does not accompany migrant routes with pictures of children and close-ups – the type of images that ‘humanize’ these people, or at the very least, invoke empathy on a personal level – while the UK offers more close-ups to migrants, and more photos of children to refugee routes. What might this mean? Migrants may not be as relevant to Italy, since Italy is rarely an end-goal: it is the country people pass through to get somewhere else. When people are designated as ‘migrants,’ this implies a choice (often framed as economical) to move towards something, while ‘refugee’ as a term implies a need to flee, i.e. to move away from something. For Italy, then, it makes sense to not personalize/individualize migrants as much as refugees: migrants are moving through Italy, towards something else, while refugees have effectively accomplished their goal (moving away from home) once they set foot on Italian soil. This might explain why Italian maps of refugee routes do warrant ‘humanizing’ images, while migrant routes do not: refugees must be dealt with by Italy, while migrants can be thought of as a mass, on their way to somewhere else. It also explains why the UK might offer more close-ups of migrants’ faces and pictures of their children: these are the people coming to the country, i.e. the people moving towards the UK. Humanizing refugees, whose route may lead them to the UK but not necessarily by choice, is less of a priority in this perspective.
| UK | SHARED | ITALY |
| Equal presence for mig/ref | Less presence for mig | |
| Equal law enf for mig/ref | No law enf for ref, more for mig | |
| More politicians for mig | ||
| More close ups for mig | Only close ups for ref (none for mig) | |
| More children for mig | Only children for ref (none for mig) | |
| (Slightly) more presence of physical borders for mig | ||
| Slightly more group for mig | Much more group for ref | |
| No big differences between ref/mig concerning moving/transport | No transport/moving for ref | |
| More waiting for mig | More waiting for ref than for mig | |
| Equal physical violence for ref/mig (little) | No physical violence for both ref and mig | |
| A lot of graphs for ref and mig equally | Almost no graphs for both ref and mig | |
| More other maps for mig than for ref (slightly in UK, big difference in Italy) |
Another difference concerns the question as to the maps are framed by images of people moving/transporting themselves, or waiting. In the UK, refugee routes are accompanied by images of refugees moving and taking transport more frequently, while maps containing migrant routes are joined by pictures of people waiting. In Italian media, refugee routes are not framed by pictures of refugees moving or transporting themselves at all – only migrants move, refugees wait. Continuing the line of argument that migrants have chosen while refugees are driven by a need, the UK would conceive of migrant routes as characterized by people waiting until they can go where they want to go, while refugee routes show people moving wherever they can. Similarly, Italy would think of refugees arriving in Europe (on the Italian coast) as having reached their destination, not needing to move forwards anymore, while migrants move on – through Italy, towards other countries – to reach their chosen destination.
UK media use graphs in addition to maps equally often for refugees and for migrants, and they do so very frequently, while Italian media rarely use graphs for refugee maps, and do so only slightly more often for migrant maps. Why would the UK media use graphs so much more frequently than the Italian media? It might be that countries that are ‘final destinations’ offer more infographics (number of people, number of illegal border crossings etc) than countries that are ‘passed through’ – the results in the rest of the table support this, because France/Italy/Spain are countries that host relatively few incomers (semi-permanently) than the UK/Netherlands/Germany do. The need to frame refugee/migrant routes with numbers makes sense for a country that is a ‘final destination,’ since people will need to be hosted and accommodated. The graphs may help to make the impact of being at the end of such routes concrete or understandable. For countries that are not at the end of the routes their media publish, the numbers attached to the people passing through (like their ethnicity, criminal records, and so on) won’t necessarily be relevant, since people won’t stay

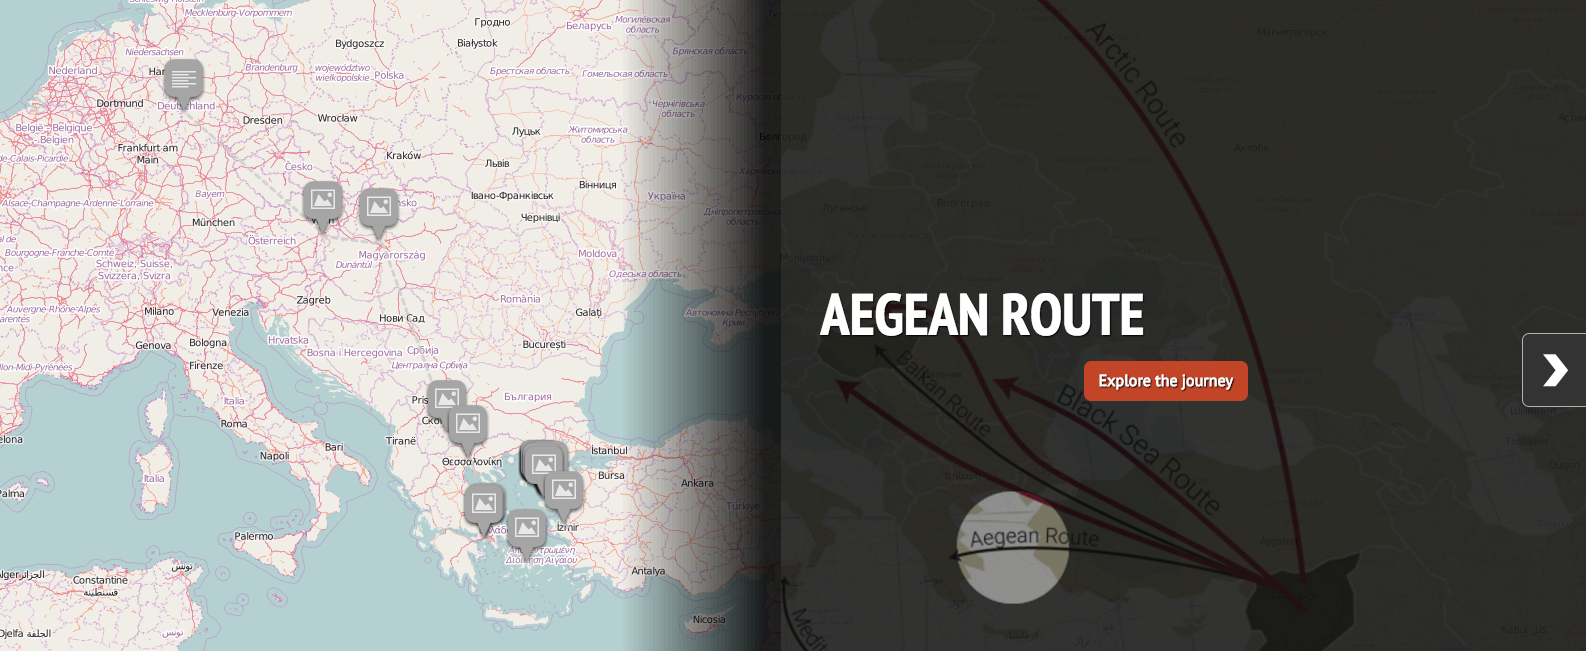
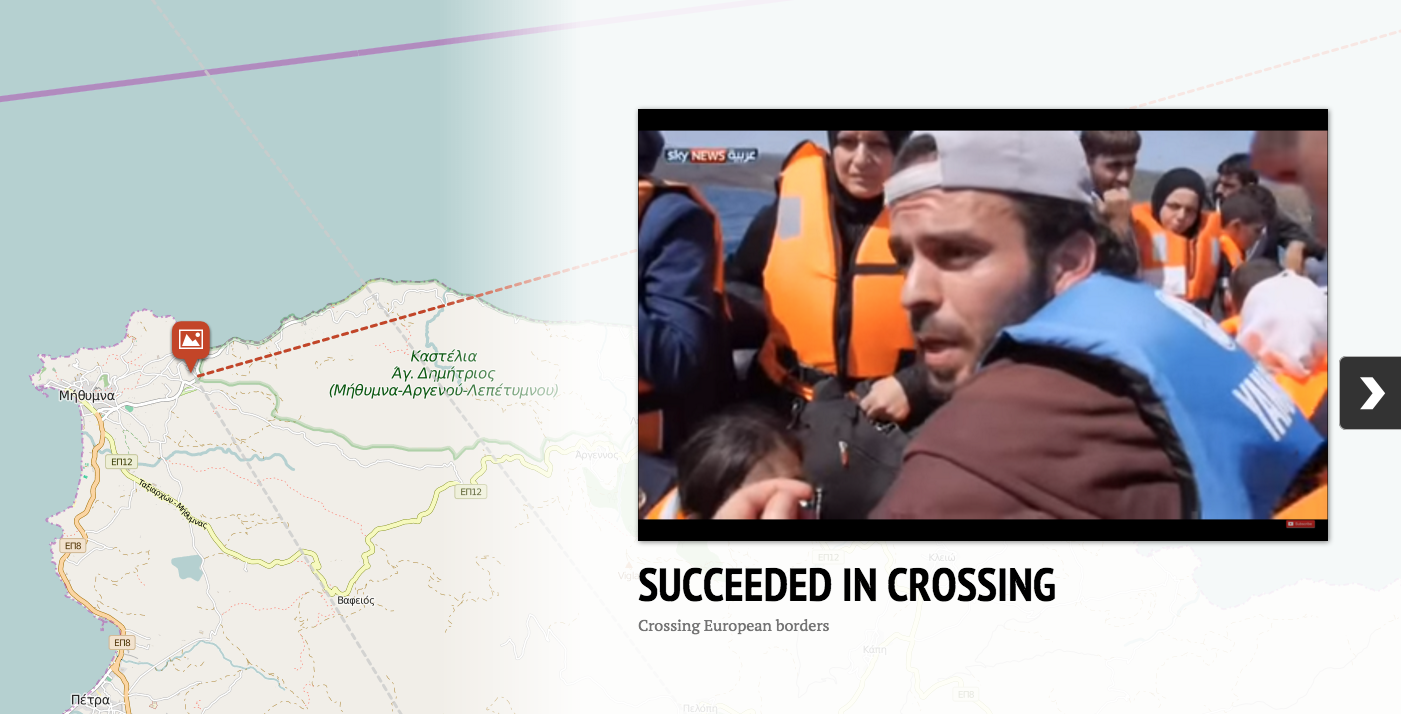
In European maps, the personal journeys of many are aggregated and the difficult processes of going from one point to the others are translated into uninterrupted lines. As part of our effort to see how refugees’ journeys might be framed differently - by paying attention to the experiences of others, rather than a self-reflexive gaze - we decided to zoom in, troubling this notion of uninterrupted, generalized lines and linear progression towards a goal. We sought out individual stories told from the perspective of the people taking the journey by looking for Arab documentary videos that describe the trip. We found three useful videos:
 -- NataliaSanchez - 18 Jan 2016
 - layered and heat map:
-
- Screen_Shot_2016-01-18_at_17.50.06.png:
- Screen_Shot_2016-01-18_at_18.10.33.png:
- Screen_Shot_2016-01-18_at_18.13.56.png:
- Screen_Shot_2016-01-18_at_18.31.46.png:
- Screen_Shot_2016-01-18_at_18.08.55.png:
- Screen_Shot_2016-01-18_at_18.38.41.png:
- Screen_Shot_2016-01-18_at_18.37.58.png:
- Screen_Shot_2016-01-18_at_18.47.56.png:
- Screen_Shot_2016-01-19_at_5.08.03_PM.png:
- Screen_Shot_2016-01-19_at_5.09.17_PM.png:
- Screen_Shot_2016-01-19_at_5.09.33_PM.png:
- Screen_Shot_2016-01-19_at_5.15.39_PM.png:
- Screen_Shot_2016-01-19_at_5.17.22_PM.png:
- Screen_Shot_2016-01-19_at_5.19.09_PM.png:
- Screen_Shot_2016-01-19_at_5.20.59_PM.png:


Topic revision: 25 Jan 2016, NataliaSanchez
Ideas, requests, problems regarding Foswiki? Send feedback