Coping with Vulnerability to Climate Change: Adaptation, its Limits and Post-Adaptation Mechanisms
2nd EMAPS data sprint (1st sprint in Paris and the mapping outcomes)
24-28 March 2014
Digital Methods InitiativeUniversity of Amsterdam
Turfdraagsterpad 9
1012 XT Amsterdam
the Netherlands
The collaborative research project EMAPS (Electronic Maps to Assist Public Science) is pleased to announce the second in its series of four sprints dedicated to mapping climate change controversies, entitled Coping with Vulnerability to Climate Change: Adaptation, its Limits and Post-adaptation Mechanisms. The sprint will take place between 24 and 28 March 2014 at the University of Amsterdam. The sprint is five days, with the first day dedicated to presentations by issue experts, three days devoted to project work and the last day devoted to presentations of outcomes and next steps. EMAPS project members, as well as external climate change experts, designers, developers and new media researchers are invited to participate in the sprint.
Theme
The 19th conference of the United Nations Framework Convention on Climate Change (UNFCCC), which took place in November 2013, culminated in the establishment of an international mechanism for loss and damage. According to the UNFCCC Decision CP.19, such an international mechanism include[s] functions and modalities to address loss and damage associated with the impacts of climate change in developing countries that are particularly vulnerable to the adverse effects of climate change. Some of the adverse effects prompting this arrangement include extreme weather events and sea level rise.
Crucially, the same document acknowledges that loss and damage associated with the adverse effects of climate change includes, and in some cases involves more than, that which can be reduced by adaptation. This recognition of the limits of adaptation marks the opening up of the climate change debates to a new phase that deals with loss and damage as a consequence of the failure to adapt and to mitigate.
The sprint Coping with Vulnerability to Climate Change: Adaptation, its Limits and Post-adaptation Mechanisms addresses national and urban adaptation mechanisms, as well as mechanisms to cope with vulnerability post-adaptation, such as the increasingly prominent loss and damage arrangement. Building on a Digital Methods Initiative workshop from October 2013, this sprint also explores other prominent scenarios resulting from the limits or failure to adapt, such as risk management, regional tensions and conflict.
Research questions
Vulnerability
Vulnerability is given a range of definitions. A number of different variables, from environmental disasters, to habitat change and industry stress, are taken into account in the measurement of vulnerability.
- How is the issue of vulnerability to climate change coming into being in online and scientific literature?
- How resonant are different national vulnerability indexes online and in scientific literature? Which are the central and which are the neglected ones?
- How resonant are different variables or indicators in the composition of national vulnerability indexes?
- What countries are of concern according to various indexes and which are the safe spots?
- How prominent are these countries in the online issue space of climate change and that of its sub-issues (demarcated through their vulnerability indicators)?
Maplecrofts Climate Change Vulnerability Index indicates seven cities central to global economic activity as subject to extreme risk: Dhaka (Bangladesh), Manila (the Philippines), Bangkok (Thailand), Yangon (Myanmar), Jakarta (Indonesia), Ho Chi Minh City (Vietnam), and Kolkata (India).
- How is urban vulnerability to climate change becoming an issue online?
- How prominent are these cities in the online issue space of climate change and that of its sub-issues (demarcated through their vulnerability indicators)? How does this resonance vary across online issue spaces, looking at a citys resonance within climate change on Google.com, Google News, Twitter and other spaces?
- How does imagery (using Google Image results) depict urban spaces for the top most vulnerable and top most resilient cities?
Adaptation
- How is the issue of climate change adaptation discussed online?
- How do online debates around climate change adaptation evolve over time?
- How is climate change adaptation localised? How is "the local" present in online adaptation debates (as a speaker or as a subject)?
- Examining a database of over 300 climate change adaptation projects in Germany, provided by Competence Centre on Climate Impacts and Adaptation ( KomPass), we ask: What is the topical focus of these projects? Can issue attention cycles be identified? Who are the beneficiaries of these projects?
Loss and damage
As the relatively new issue of loss and damage enters the institutional agenda, we ask:
- How is the issue of loss and damage discussed online? Is it a legal issue, a humanitarian issue, an economic issue, or a development issue? What are the scenarios, actors, and associated vulnerability variables? Who is driving this agenda and which are the neglected concerns and actors?
Conflict
As the discourse around the issue of climate change and conflict intensifies, we ask:
- How is the issue of climate change conflict treated in various spheres online? What are the places of climate change conflicts? Who are the actors in this space? Who are the victims and decision makers?
Schedule
24 March, 9.30-17.00. Issue expert presentations. Location: University Library, Singel 425, Doelenzaal (C0.07)
25 March, 9.30-17.00. Data sprint. Location: Media Studies, Turfdraagsterpad 9, rooms 0.12, 0.13 and 0.14.
26 March, 9.30-17.00. Data sprint. Location: Media Studies, Turfdraagsterpad 9, rooms 0.12, 0.13 and 0.14.
27 March, 9.30-17.00. Data sprint. Location: Media Studies, Turfdraagsterpad 9, rooms 0.12, 0.13 and 0.14.
28 March, 9.30-11.00 Presentation preparation. Location: Media Studies, Turfdraagsterpad 9, rooms 0.12, 0.13 and 0.14. 11.15-12.45 Presentations. Location: University Library, Singel 425, Belle van Zuylenzaal (C1.13).
Projects
- Project 1: Climate Change Studies on Adaptation Strategies in Germany and Central Europe: Mapping with Kompass Database
- Project 2: Stormtalk: Situating adaptation and vulnerability with social media
- EmapsAmsterdamSprint2014Project3aOnline ResonanceOfTheInternationalClimateChangeIssueAgenda
- Project 3b: The issuefication of a place: The issue dynamics of a melting Arctic
- Project 4: Uses and Users of Vulnerability Indexes
- Project 5: on Europe's readiness to adapt to Climate change
Maps
How to get to/from Schiphol Airport?
We recommend taking the train which departs from Schiphol airport to Amsterdam Central (Railway) Station approximately every 15 minutes: http://www.schiphol.nl/Travellers/ToFromSchiphol.htm
How to get to the University of Amsterdam from the Central Railway Station?
Media Studies Building
Take tram 4, 9, 14, 16, 24 or 25 and disembark at Spui/Rokin, then walk to Oude Turfmarkt, enter through the passageway, and walk to the Media Studies building, Turfdraagsterpad 9.
University Library
Take tram 1, 2 or 5 and get off at Koningsplein. Head northeast on Koningsplein toward Reguliersdwarsstraat. Turn left onto Singel and the library will be on your right.
Map of the different locations: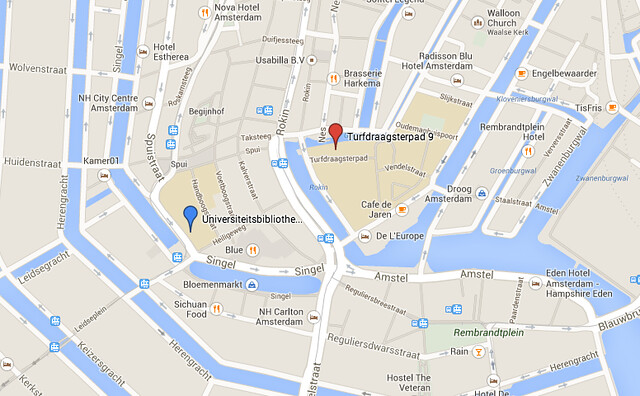
Also, there is a Google Map with all locations of the University of Amsterdam. Here is a guide to the Amsterdam new media scene.
About EMAPS
EMAPS (Electronic Maps to Assist Public Science) is a collaborative research project that aims to get a better understanding of whether the web can provide a meaningful equipment to produce an enhanced interest of a wider public in science and technology issues, not as receivers of information about end results of science, but as potential participants in science in the making. To do that, the project focuses on the emerging uses of the web as a tool of collective endeavor and public debate around two techno-scientific issues: ageing and and climate change adaptation.
The EMAPS consortium comprises of: Fondation Nationale des Sciences Politiques (Sciences Po), the University of Amsterdam, the Institute of Spatial Planning at the University of Dortmund, Barcelona Media, Politecnico di Milano/ Density Design and The Young Foundation.
Contact
For more information about this sprint please contact the organisers Liliana Bounegru (liliana.bounegru[at]digitalmethods.net) and Natalia Sanchez-Querubin (n.sanchezquerubin[at]uva.nl).
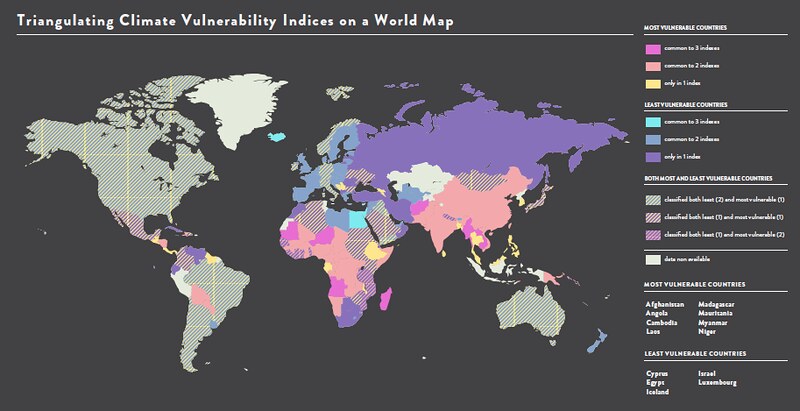
Top-page image: 'Climate Vulnerability World Map'. The map indicates the least and most vulnerable countries, as well as the uncertain ones, based on the triangulation of three vulnerability indexes: the DARA Climate Vulnerability Monitor (CVM), Germanwatch and the GAIN Index. Source: Digital Methods Initiative Climate Conflicts workshop, October 2013


| I |
Attachment | Action | Size | Date | Who | Comment |
|---|---|---|---|---|---|---|
| |
Walk_Through_Projects_EMAPS_Amsterdam_sprint_March_2014.pdf | manage | 3 MB | 09 May 2014 - 12:48 | SophieWaterloo | Walk-through of main findings |
Ideas, requests, problems regarding Foswiki? Send feedback