Taking Stock: Can News Images Be Generic?
This project is part of the ongoing research program “Taking Stock: Why Generic Images Matter” and is both complementary to and a continuation the previous 2016 Digital Methods Winter School project “A critical genealogy of the Getty Images Lean In Collection”:Team Members
Giorgia Aiello, Federica Bardelli, Sofia Chiarini, Giacomo Flaim, Simon Boas, Eva Brussaard, Jennifer Colombari, Rahel Estermann, Oriane Piquer, Jasper Schelling, Pieter Vliegenthart, Jeroen de VosContents
1. Introduction
Image banks like Getty Images, Shutterstock and Alamy that sell ready-to-use ‘stock’ photographs online have become the visual backbone of advertising, branding, publishing and, increasingly, also journalism. Daily exposure to stock images has increased exponentially with the rise of social networking and the generic visuals used in lifestyle articles and ‘clickbait’ posts. The stock imagery business has become a global industry through recent developments in e-commerce, copyright and social media (Glückler & Panitz, 2013). However, stock images are most often overlooked rather than looked at—both by ‘ordinary’ people in the contexts of their everyday lives and by scholars, who have rarely taken an interest in this industry and genre in its own right. This statement is confirmed by eye-tracking research on online newspapers. The research suggests that readers are drawn more immediately to written text than images on home pages (John Nox, 2009). This would explain why images on online webpages are generally kept small (besides the fact that it would take quite some time to load images from greater size). It would also explain why news media would buy a great amount of these images cheap at image banks. There are some notable exceptions, dating back to the ‘pre-Internet’ era of stock photography, of academics who looked to the use of stock imagery; for instance, Paul Frosh’s work on the ‘visual content industry’ in the early 2000s or David Machin’s critical analysis of stock imagery as the ‘world’s visual language’ (Frosh, 2003; Machin, 2004). As a whole, and compared to other media and communication industries, research on online image banks and digital stock imagery is virtually uncharted territory. Why, then, should stock images be ascribed any significance or power since people do not particularly pay attention to them? Stock images are not only the ‘wallpaper’ of consumer culture (Frosh, 2003 and 2013); they are also central to the ambient image environment that defines our visual world, which is now increasingly digital, online and global while also remaining very much analogue, offline and local (just think of your own encounters with such imagery at your bank branch or beauty salon, or on billboards in city streets). Pre-produced images are the raw material for the world’s visual media. In particular, a growing number of the creative and editorial images that we encounter in news media (Figure 1 being an example) originate from a handful of corporate visual content providers that distribute imagery globally (Gürsel, 2016). In light of recent debates on fake news and ‘post-truth’ politics (Bounegru et al. 2017), a critical appraisal of the provenance, circulation and uses of images found in online news media outlets has become increasingly urgent.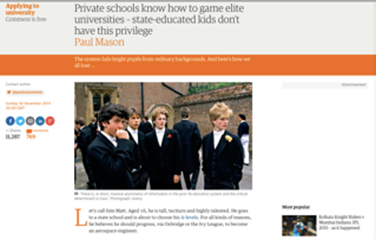 Figure 1 — Editorial image originating from a corporate visual content provider
And yet, public debate on stock imagery remains both very limited and largely dismissive. Often derided as being patently fake and outrageously cliché, in recent years stock photography has become regular fodder for a variety of scornful media commentaries on the role and uses of commercial photography in contemporary communication.
Figure 1 — Editorial image originating from a corporate visual content provider
And yet, public debate on stock imagery remains both very limited and largely dismissive. Often derided as being patently fake and outrageously cliché, in recent years stock photography has become regular fodder for a variety of scornful media commentaries on the role and uses of commercial photography in contemporary communication.From humorous collections of images of women laughing alone with salad or digital tablets (Grossman, 2014) to tongue-in-cheek exposés on the use of inauthentic images of ordinary citizens in political campaign ads (Hooton, 2014), bloggers and social media journalists have relished producing scathing critiques of the generic, ready-to-use photographs that can be purchased from online image banks. In a similar vein, news media have been in the spotlight in relation to questionable uses of stock images for the purposes of in-depth journalism. For example, in 2014 the Daily Mirror sparked a debate among journalists in The Guardian and The Independent for using a stock portrait of a weeping child (Figure 2) for a front-page splash on the alarming growth of food banks in the UK (Burrell, 2014; Tooth, 2014).

Figure 2 — Usage of a stock portrait of a weeping child Whether it is because of its poor quality, extreme blandness, lack of veracity, or exploitative cheapness, stock imagery is frequently discounted as insignificant and rarely taken seriously. This said, our everyday encounters with images, including news images, are largely linked to only a handful of visual content providers. Among these, Getty Images is still the undisputed global leader, with customers in 100 countries and an archive of over 80 million images.
For these reasons, this project focuses on tracing the provenance, circulation and uses of images found in online newspapers to understand whether the bulk of these images originate from global image banks, where and how these images are used and recontextualized in other online media texts, whether news images can also be ‘generic’, and ultimately also what this may all mean for an up-to-date critical understanding of news imagery. In spite of all current emphasis on user-generated imagery as a dominant mode of communication in contemporary visual culture (Highfield and Leaver, 2016), we quite literally swim in an ocean of images that were made for and are distributed by very few big corporations. Therefore, I hope that we keep taking stock of where this pre-produced, ready-to-use and reusable imagination leads us, both culturally and politically.
2. Initial Data Sets
We chose to focus on a selection of European national newspapers with similar formats and orientations, i.e. online versions of traditional broadsheet newspapers with broadly liberal/progressive outlooks. We also made sure to select newspapers in languages that at least one of our team members could understand, so that we could examine the images in relation to their uses in these newspapers. Focusing on newspapers from different countries, though in a culturally and geographically proximate context, allows us to consider some of the ways in which stock imagery is used and circulates globally. In addition, focusing on the progressive elite press, rather than more openly commercial or digitally native news media, may also offer insights into the growing entrenchment of ‘traditional’ journalism and digital commercialism. Therefore our sample consists of the following five online newspapers:- The Guardian (United Kingdom)
- Libération (France)
- La Repubblica (Italy)
- NRC (the Netherlands)
- Süddeutsche Zeitung (Germany)
3. Research Questions
Main Question: How do concepts like visual genericity and reusability contribute to a critical appraisal of the role of images in contemporary news-making?
- Research Question 1: How many of the images that can be found in major online newspapers originate from image banks? Among these ‘stock’ images, how many of them fall into the creative and editorial categories?
- Research Question 2: What do the creative and editorial ‘stock’ images found in newspapers represent? What kinds of images are consistently associated with particular kinds of ‘news’ content?
- Research Question 3: How are the stock images found in newspapers used in other media texts and contexts? What are the media outlets and platforms in which these images live beyond the newspapers under investigation?
- Research Question 4: What do this study’s findings add to our current understanding of the news image?
4. Methodology
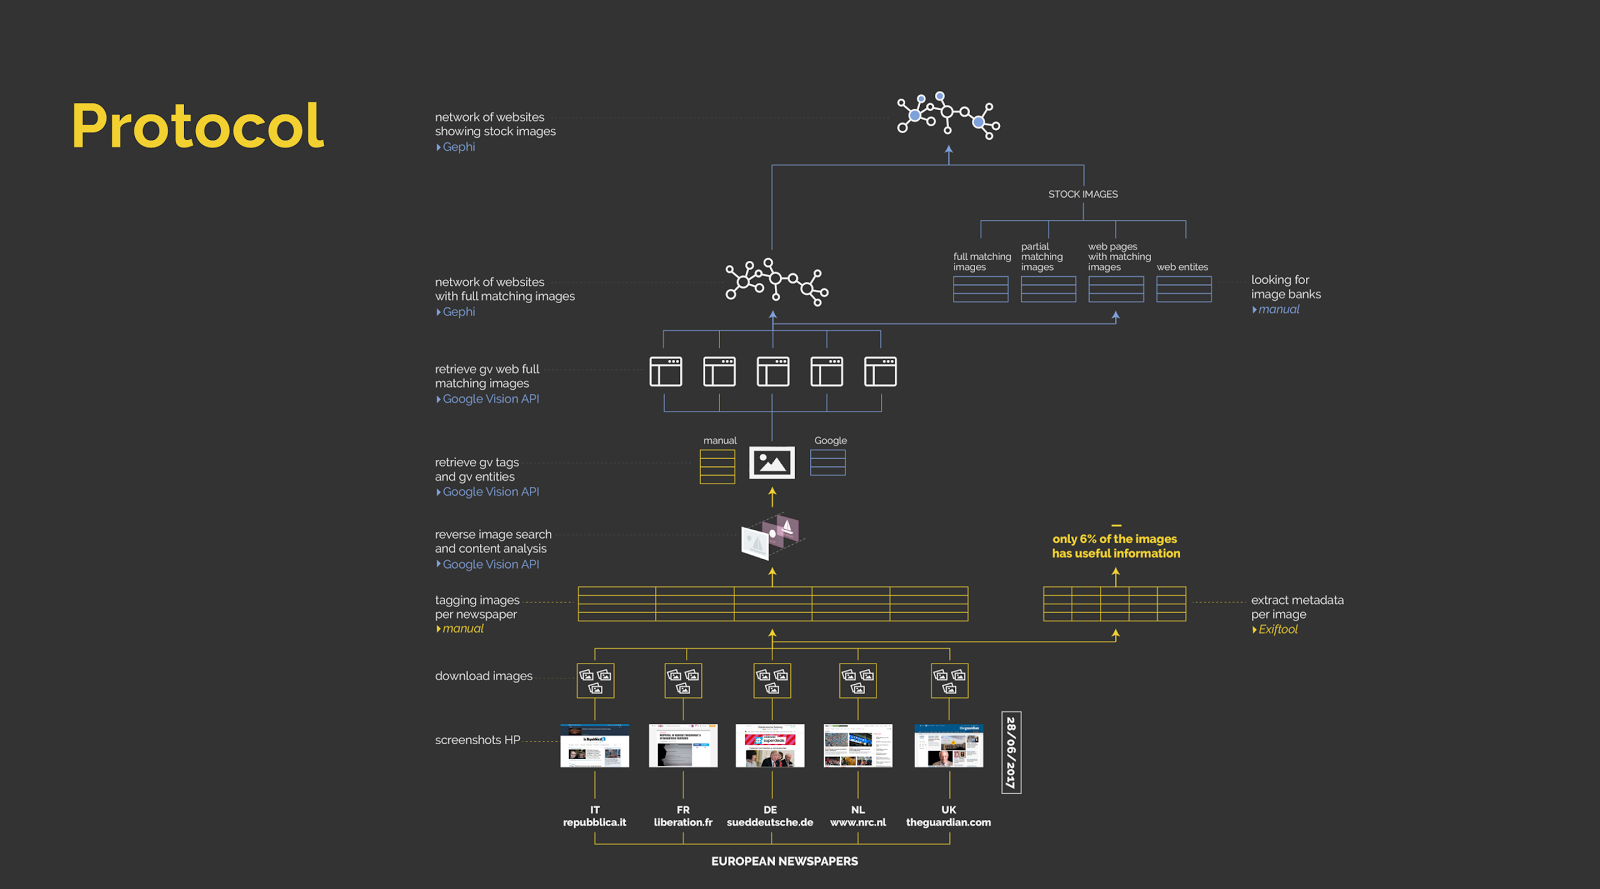 Figure 3 — Research Protocol
Newspaper home pages are frequently updated, as news develops during the day. In order to study what images are used on the webpages of the different newspapers we took screencaptures of the homepages of the newspages shortly before retrieving the URLs of the individual images that were used on the webpages. Full-page screenshots were made using Paparazzi and Ember and shared amongst members of the project team.
In order to retrieve our images we initially wanted to use the DMI Image Scraper, but for some newspaper websites we ran into difficulties retrieving the image URLs. Newspapers such as The Guardian uses advanced media serving software that incorporate images into the webpage in such a way that their sources are not easily automatically retrievable. So, instead of using the DMI Image Scraper, we elected to retrieve image URL’s using the Chrome Developer Tools. Using the Chrome Developer Tools we could study the page structure, and learn per newspaper what kind of implementation they used for serving images. By injecting a JQuery JavaScript library into the site on the client side, we could automatically read and manipulate the HTML page structure and retrieve the image sources from the page per newspaper frontpage. For every newspaper, a list of image url’s was retrieved and put into a Google spreadsheet. Using image embedding, the images were incorporated into the spreadsheet for visual analysis. We obtained an initial dataset of 424 images, from which we removed images of interface elements, buttons and logos, graphic design other graphic elements not attached to specific news content. Our final dataset included 245 images spread across five newspapers’ homepages.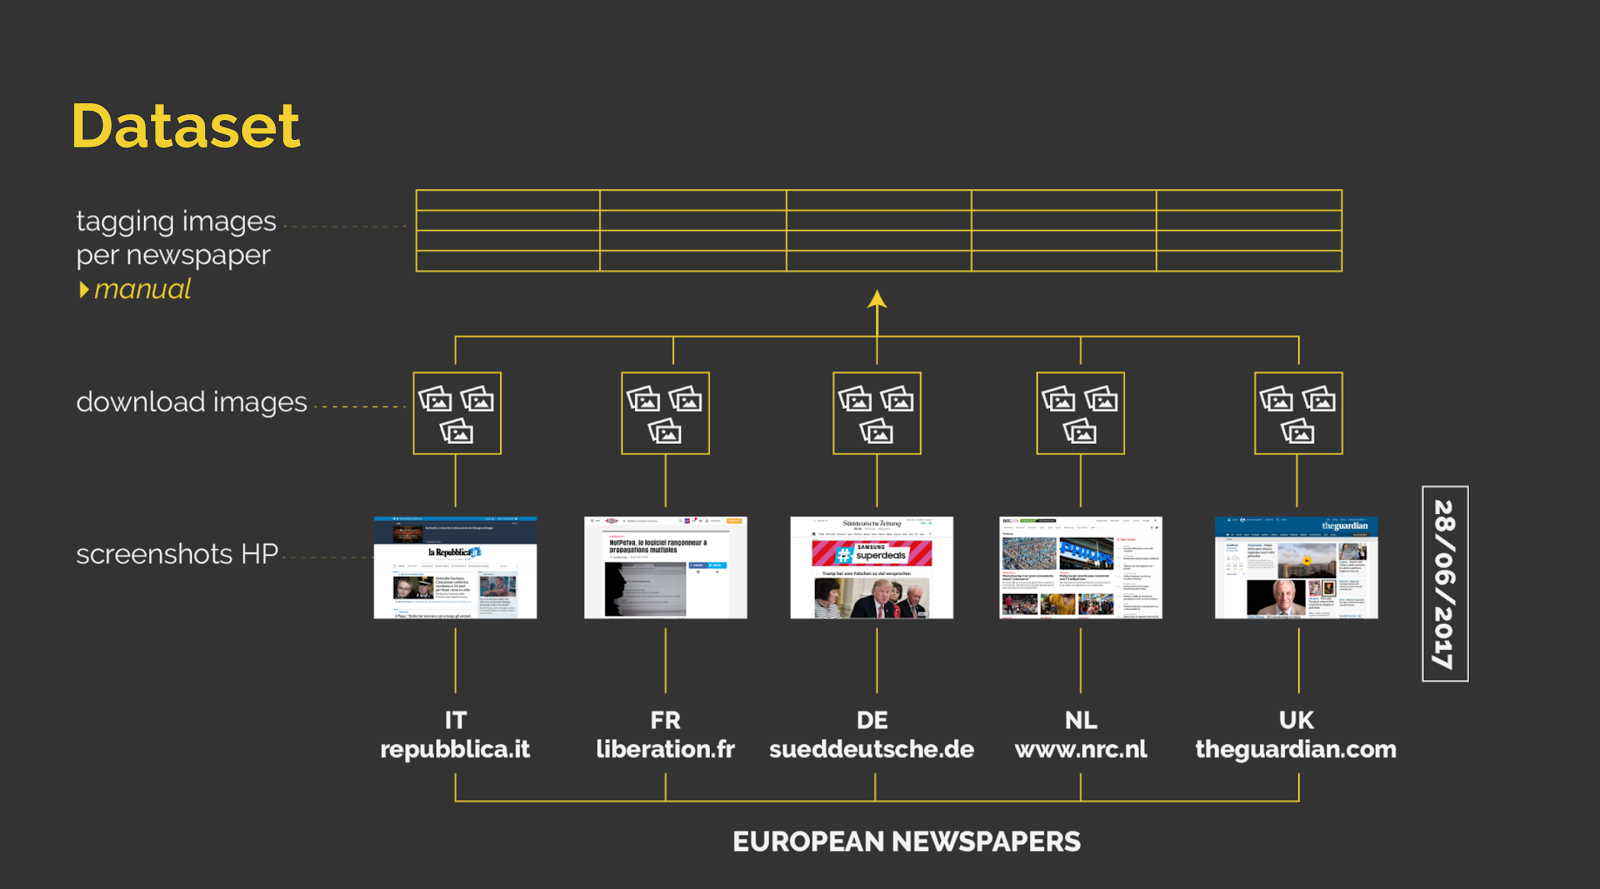 Figure 4 — Retrieving our dataset
In order to address our research questions more effectively, we operationalized them further into the following procedural questions:
-
How many images come from image banks?
-
How many of these images are creative or editorial?
-
What do these images represent?
-
What kind of images are associated with particular news topics and content?
-
Where else do these images live?
-
How else are they used?
Algorithmic coding
To address these questions, we decided to use a combination of manual coding and computer vision. We chose to use Google’s Cloud Vision API, as this enabled us to collect data about our images’ content (gv_tags), context (gv_web_entities) and additional web presence (gv_web_pages_with_matching_content). It also lets us detect the additional web presence of images considerably faster than the DMI Reverse Image Scraper tool. Initially, we also thought that we could gain valuable information about our images (e.g. the specific image banks from which they originated) by scraping their metadata using the EXIF tool, but this approach did not prove to be as informative as using the Vision API.**
We used a fork of Bernhard Rieder’s DMI tool memespector. This fork, by Emile den Tex, expanded memespector’s use of the Google Cloud Vision API to include its ability to detect common visual entities from around the web and the URLs of other places where the image has appeared online, even if the image has been manipulated. The tool appended to our Google Spreadsheet is the aforementioned “gv_” data.
Manual coding
Our manual coding protocol was based on the following categories:- Name of newspaper
- URL of image on newspaper homepage
- Image (.jpg format)
- What/who is represented in the image
- Newspaper category (sports, domestic etc.)
- Topics
- Generic/specific
- Source
- Image Bank/News Agency/Other
- Creative/Editorial
Once we discovered which images came from stock archives, we also noted if the pictures were creative or editorial. The “creative” category means that the images were usually created for advertising, branding and publishing. This kind of pictures does not reveal elements that allow us to recognize the represented objects or places, such as logos, famous people or identifiable historical monuments. The world represented in creative images is always crafted and often also staged and shot in a studio setting. Their objective is to express ideas and generic concepts, in order to be able to reuse them in many different contexts. On the other hand, the “editorial” images can be taken in both studio and real context but they show clearly recognizable places, events and people, showing “real-life” contexts and situations.
Finding the stock images
We created a list of ten stock photography agencies that includes major providers like Getty, Corbis, Shutterstock, Alamy and Fotolia (Glückler and Panitz, 2013) plus a few more, widely used, image banks that mainly deal in royalty-free imagery (see Table 1).
| Getty Images |
| Corbis |
| Shutterstock |
| Alamy |
| Dreamstime |
| Fotolia |
| Depositphotos |
| iStock |
| 123RF |
| Stocksy |
5. Findings
We've organised our findings around our research questions, so we will first give an overview of the analysis of the overall corpus, and go into detail on specific issues that are part of the sub-questions.Surveying the corpus
First, to have an overall view of the corpus, we made some visualisation of the distribution of the general topics per newspaper frontpage online.
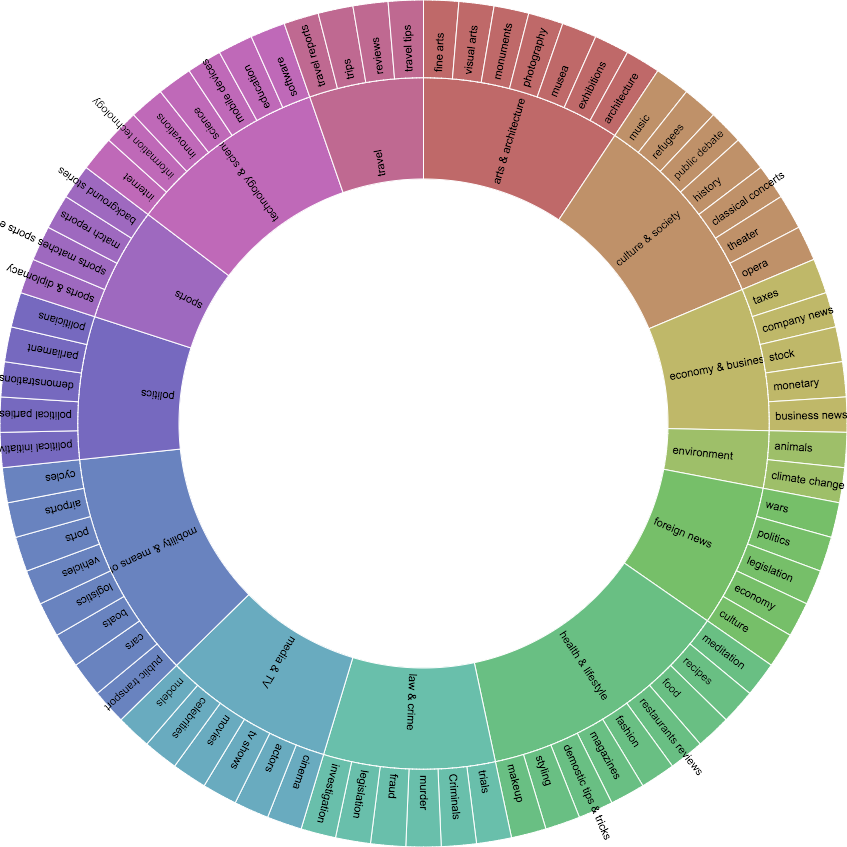
Figure 5 — Topics and subcategories
The produced graph is not showing the distribution of the topics in entire the newspaper, as we are focused on the frontpage. Therefore, the graph is a visualisation of the images displayed on the frontpage. It also shows the proportion of images of a certain topic on the frontpage. The research of the distribution of the general topics was done thanks to a patient work of manual categorization (in an excel table). This work enabled us to have this visualisation.
We chose an alluvium data visualisation, that we made with rawgraphics.io.
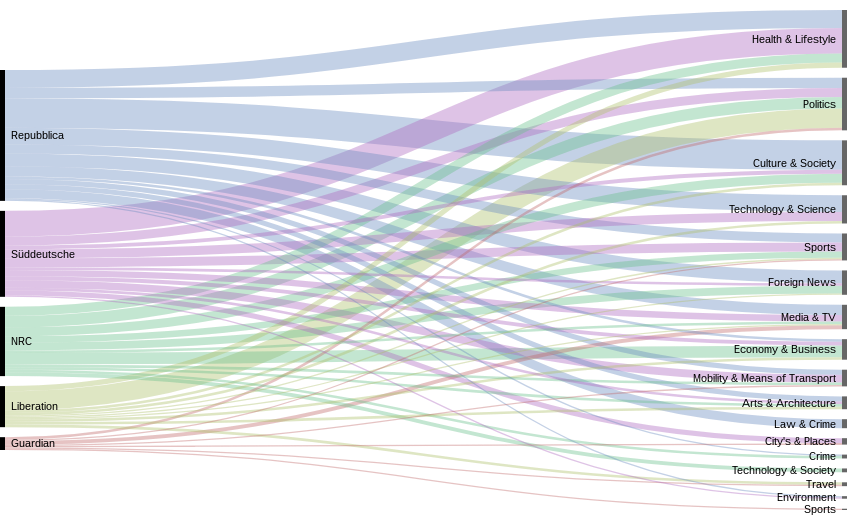 Figure 6 — Image topics per newspaper
Note that in the visualisation, we see that the "Guardian" section is very little in comparison with the others, because, as we went analyzing, the Guardian changed its frontpage. So we had to use fewer images than for the others to categorize. What this visualisation does show us is that the different newspaper illustrate differently the different subjects. For example the German newspaper is using a lot more of images in the “Health & Lifestyle” category than others. This raises the question whether: “health & lifestyle” is a “classic” stock photo topic. Does this proportion in the visualisation caused by the fact that there are more stock photo here? Are the “classic stock photo topics” illustrated like we would expect the newspapers to do it or not?
In order to operationalize this question, we examined some images from our dataset:

Figure 7 — Example Image 1
Image 1
Image 1 was found on the homepage of the online version of the Dutch newspaper NRC. The image accompanied an article titled ‘Branche is niet bang voor verbod’, meaning ‘Branche is not afraid for prohibition’. The article was about the EU-regulation on the lamps that are used in tanning salons. The regulation ensures that the lamps are less intensive as they used to be. However, the branch is not afraid for an integral prohibition on tanning salons. The image shows a tanning bed from the inside which seems to be on since the lamps are coloring blue. The particular image appeared generic at first glance, because it does not show a spokesman of the branch or, for example, a particular tanning salon. The image envisions rather an abstract idea. This first impression was enforced by the fact that the NRC enclosed a reference to iStock. Istock, as we know, is a well known image bank which is a department of the Getty Image ‘family’. Further research to the provenance of this image gave 20 results on TinEye and more than 150 results on the Google Reverse Engine. We could conclude therefore that this image is indeed a stock photograph. An image we can classify as creative, because it is created to illustrate the idea of a tanning salon, rather as a classic journalistic news image that we classify as editorial. Moreover, the image appeared under the tab domestic, which made him an image of semi-relevance in the newspaper. In other words, we needed two times scrolling to get to this news item.
Image 2

Figure 8 — Example Image 2
Image 2 was found on the homepage of the online version of the newspaper The Guardian on Wednesday 28th of July. The image accompanied an article titled ‘'Petya' ransomware attack strikes companies across Europe and US’ and shows a person typing code from above. Therefore we could classify this image for our analysis under topics as computer, web, technology.
The image appears as generic, because it does not show a particular person or event. We also found in TinEye image 192 results which made us think that this image would probably be from an image bank. Nevertheless, the image came from a news agency, named EPA.
This result meant that we also have to deal with images which are generic and editorial, appearing multiple times on the Internet, but not from a big image stock company. In addition, this finding also meant that a manual method for our project would be too intensive as extensive. It also means that we need other digital methods for our project. This also raises a new research question: 'How do concepts like visual genericity and reusability contribute to a critical appraisal of the role of images in contemporary news-making?'
Research Question 1: How many of the images that can be found in major online newspapers originate from image banks? Among these ‘stock’ images, how many of them fall into the creative and editorial categories?
In order to sucessfully determine whether an image originated from an image bank we deployed the Google Image API: Figure 9a — A newspaper photo of Front National politician Gilbert Collard sourced from AFP
 Figure 9b — A newspaper photo of Front National politician Gilbert Collard sourced from Getty Images
When we deployed the Google Image API, we only looked at the exact image match to find out if a picture was a stock image or not. However, when we looked into the similar image results, we found similar pictures that seem to be taken at the same moment, that actually are stock images. This is probably due to the partnership between the French Press Agency and Getty images, but also suggests that more pictures used on the homepages of the newspapers might be stock photos.
The image on the top originates from AFP - Similar image on the bottom is from Getty Images. Very likely that they are part of the same shoot (due to AFP/Getty partnership).
In order to find out how many images that can be found in major online newspapers originate from image banks, we first looked at the algorithmic categorization of the images. We found that 45 images (10,6%) used by the newspapers in our research corpus, originated from image banks. In order to identify the nature of those pictures (creative or editorial), the algorithmic categorization of the images was merged with the manual categorization. From the manually analysed images, 30 images could be traced back as image bank picture. The difference between the two datasets (30 versus 45 images) is caused by the temporal character of newspapers: some images disappeared from the websites before they could be analysed. From those 30 images, 12 (4.5% of the manually coded database) were classified as editorial image, 18 (6.7% of the manual coded database) as creative image.
Different topics, different uses of stock photo: General distribution of topics and image bank sources
To answer this question, we went further on what was done in the first visualisation work. For each of the newspapers, we were able to triangulate between computer-based and qualitative input (using a script to match the two spreadsheets). This enabled us to guess if an image came from an image bank. This leads to another visualisation work: we can see here the correspondence between topics, image banks and newspapers.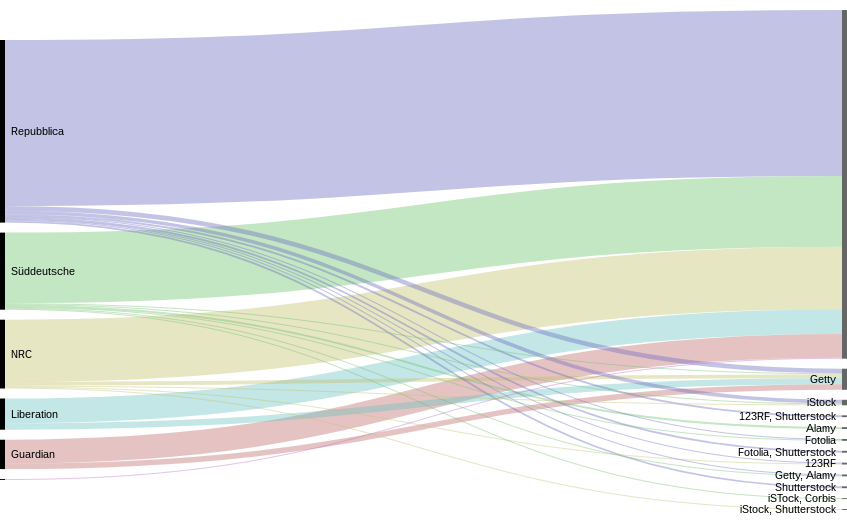 Figure 10 — Origin of stock images on the frontpapers of new websites.
Here is the match between newspapers and image banks.
What we learn from this image is that, actually, the overall proportion of image coming from identified stock photo source is not that big compared to the rest. We can also see that La Reppublica seems to use more stock images (and more from Getty) than the others. The Guardian also has a good proportion of Getty images compared to the little corpus we had.
Below we have the same match, but with the topics in between, to see the proportion of bank images per topic. The blank topic part of the graph represents the part of the images we didn’t code manually.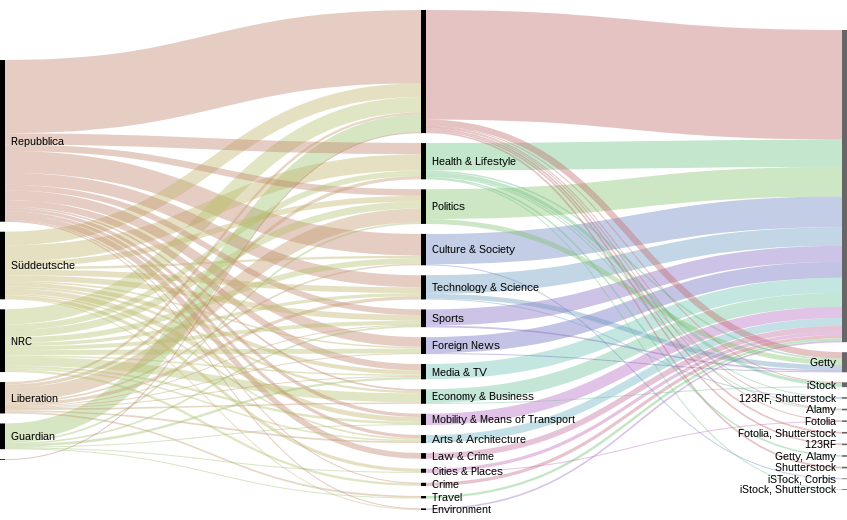 Figure 11 — Relation between topics on newspaper websites and stock imagery usage
This gives us a general picture of the distribution of the images per topic and stock image banks. The distribution of the image bank source is quite good, newspapers seem to take images from several bank image (and not only one or two). Though, we can notice that Getty is obviously preferably used rather than other stock image banks, on the overall proportion. And, surprisingly, mostly used for technology and science and...politics. We refer to our exploration with the Google Vision API. Newspaper to help understand this.
It could be interesting to see if this proportion of political topics in the use of image banks is recent or not. It is expected to use stock photo for technological subjects (it is sometimes very abstract and difficult to actually illustrate) but the use of political subjects is surprising, we would expect newspapers to illustrate this news with actual photos taken by their journalists, . We chose to make a focus on three topics which are very classic stock images topics. The general conclusion of theses focuses is that the addressing of theses topics depends on the newspaper’s editorial line. The newspaper seems to have a different way of handling the topic. And our hypothesis would be that the more confident they are in a topic, the less they are using stock images. This needs further analysis, of course. The other general observation that we can do is that image banks seem to have a speciality: some image banks are preferred according to the topics addressed: iStock is more used for “Heath & lifestyle” topics but Getty is prominent for “Technology and Science”, for instance.Focus on Health & Lifestyle
Here, we can see that, for example, La Repubblica is using stock images (from diverse sources of stock image banks) in the same proportion that non-stock images.
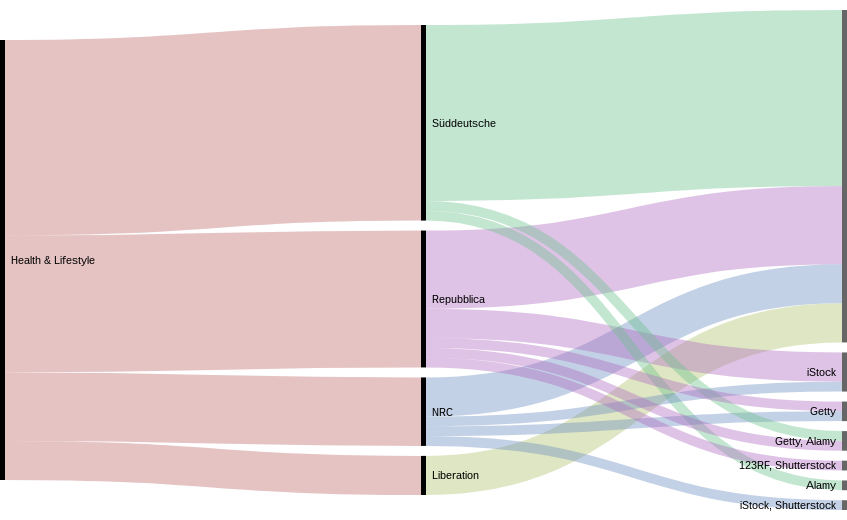
Figure 12 — Comparison of stock imagery usage in the Health & Lifestyle category
Libération is using non-stock images, and Suddeutsche using a lot of non-stock and a bit from Getty and Alamy.
It’s surprising to see a newspaper using entirely non-stock images for such a classic “stock photo topic”. Two hypothesis to draw from that: first, these newspapers already have a collection of images that can be used as stock images in their archives and are reusing them, which does not mean they have produced the images for the articles. So the question here would go further the scope of this project, to see the uses of images by the newspapers, and how what type of image is used or re-used. The second hypothesis is that the newspaper is actually producing editorial pictures for the articles. This needs further investigation, with for example a focus comparing the images used, their articles, in La Reppublica and Libération.Focus on Technology & Science
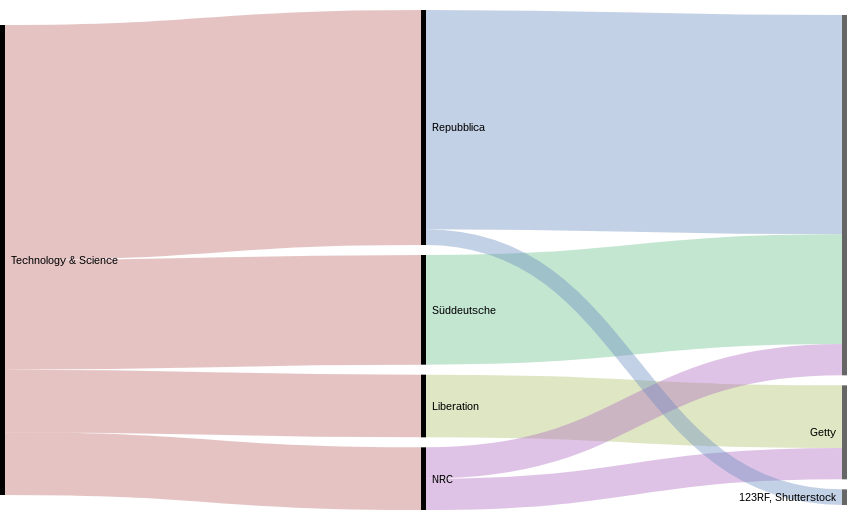
Figure 13 — Comparison of stock imagery usage in the Technology & Science category
As it can be seen in the chart, it is not the case. Süddensche is not using stock photo at all, Libération, on the contrary, uses only Getty Images, NRC is using non-stock and Getty, and finally, La Reppublica uses a bit of Shutterstock.We can first remark that this topic is addressed by very few stock image banks, which, is interesting regarding the increasing importance of such a topic in the news. It needs further research to verify this, but it seems that very few agencies are selling images regarding science and technology. This concentration of the source of the images on two or three agencies can explain in part their great standardization: in the first part, we explained that the scientific and technical subjects are indeed illustrated with images always on the same model. There are very few variations.
The second remark we can do is that we could expect more stock photo because of the abstractness of some technological topic, but we witness the use of a lot of non-stock photo. From this, we can draw the hypothesis that the more confident the newspaper is in the topic the less it is likely to use stock photo, and the more likely the photo is to be related to the article.
Research Question 2: What do the creative and editorial ‘stock’ images found in newspapers represent? What kinds of images are consistently associated with particular kinds of ‘news’ content?
The creative and editorial stock images show as expected lifestyle images and images of known persons. In fact:
-
We found 45 images from image banks in the complete dataset
-
We found 30 images from these image banks in our manually coded dataset
-
12 of these images were editorial images
-
18 of these images were creative images
-
All images in Health and Lifestyle are creative
-
All images from Politics are editorial
-
Technology and Science is mixed
Research Question 3: How are the stock images found in newspapers used in other media texts and contexts? What are the media outlets and platforms in which these images live beyond the newspapers under investigation?
In order to interpret how and where stock images live we created multiple network visualizations in order to study how the images move across different newspapers and websites.
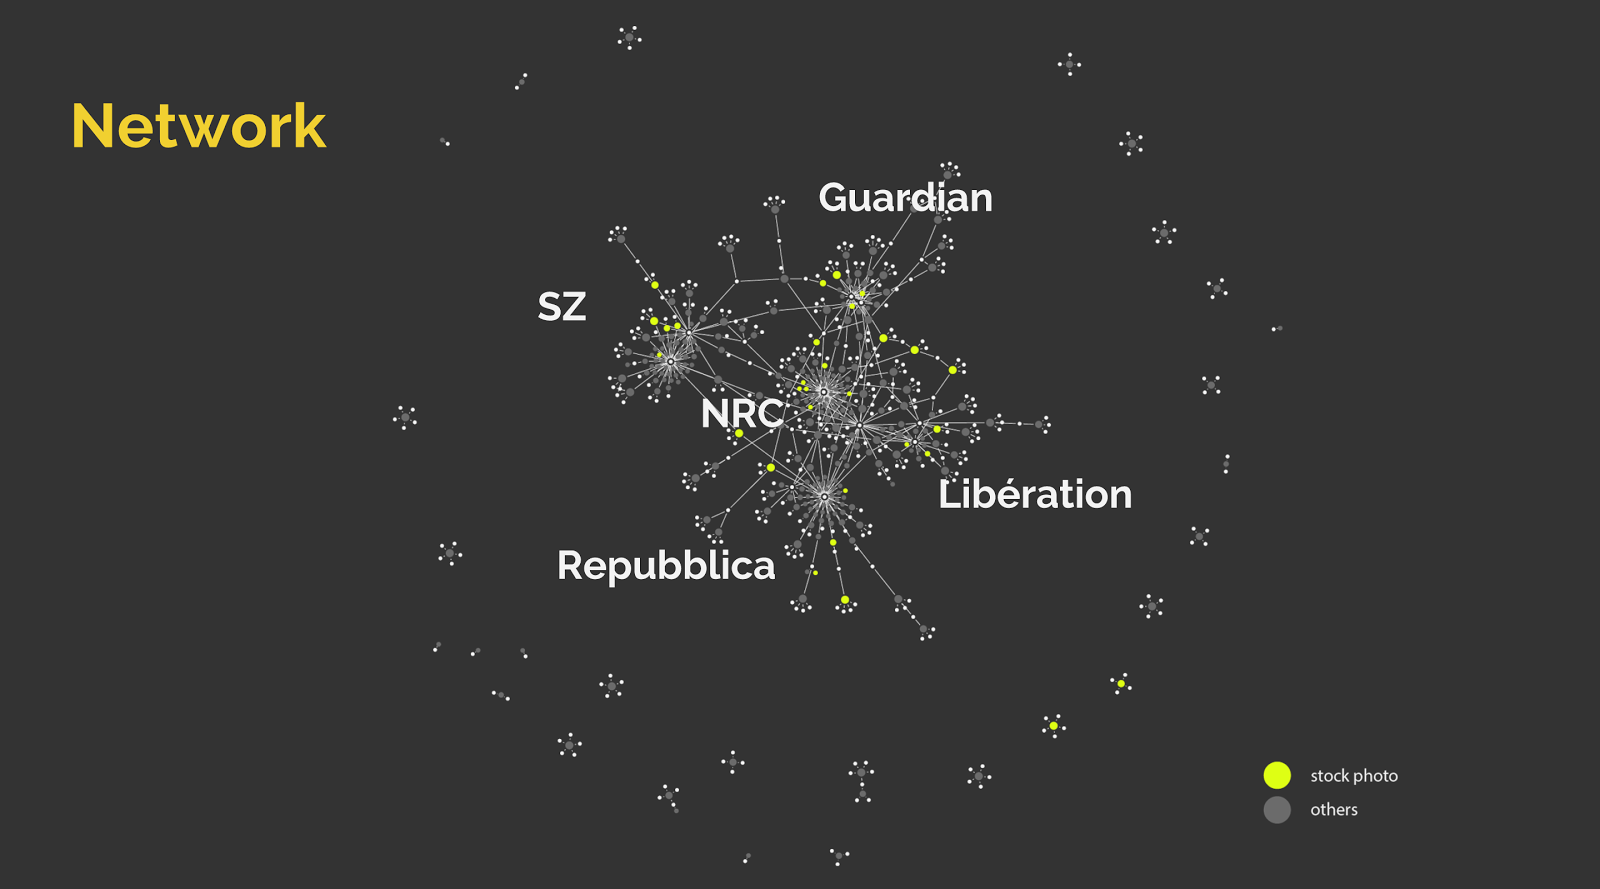
Figure 14 — The network of images across publications
The first network represents the movement of images across different websites and newspapers. In other words, the network shows the relation between the images we found in newspapers and other websites (this means fully matching images according to Google Vision API analysis).
Most of the images are well connected, as we can see, apart from a few islands (small clusters around the network). This means that the images that were present on the online news pages that we selected are shared a lot among other (news) websites. Furthermore, the white dots in this representation are websites, the yellow nodes are images categorized as stock photos and gray nodes are non-stock images. A lot of the stock photos are present in the network and quite shared, but also a lot of the non-stock photos are a core part of the network: for further analysis it could be interesting to focus also on these images, and to think about if we can include these very-shared images in the list of stock photographic images, as well as the websites that spread these images a lot among different newspapers.We then decided to visualize inside the same network the actual images that are shared, to see which specific contents or visual features are recurrent within stock image photography.
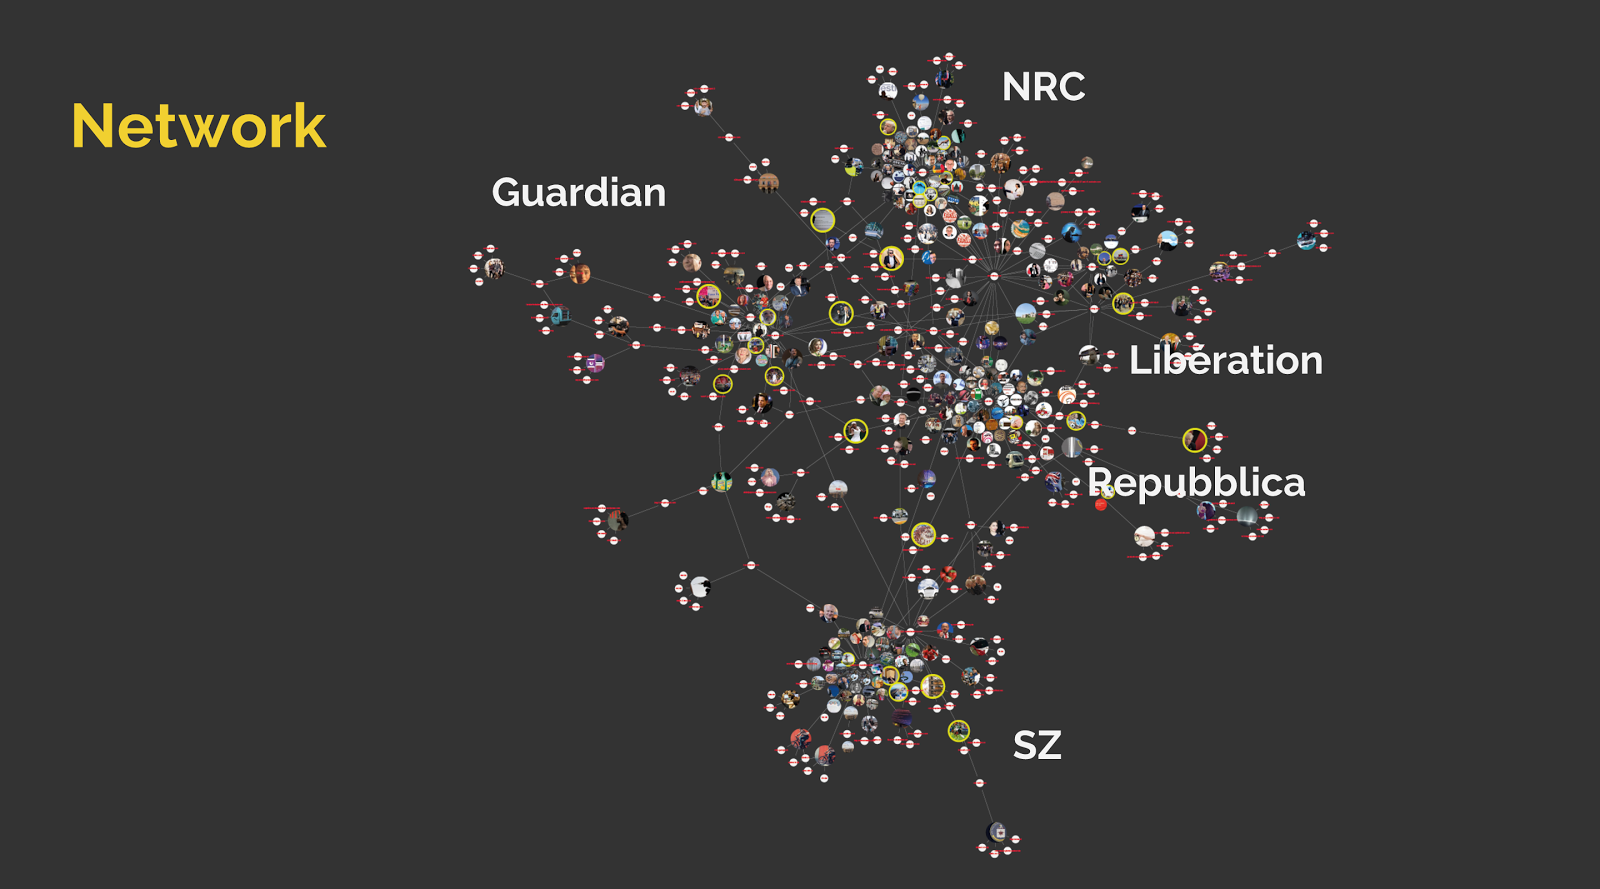
Figure 15 — Examining Image clustering
If an image is in between two different clusters, that means that the same image is used in two or more websites/newspaper. The images with a yellow border are images categorized as stock photography images.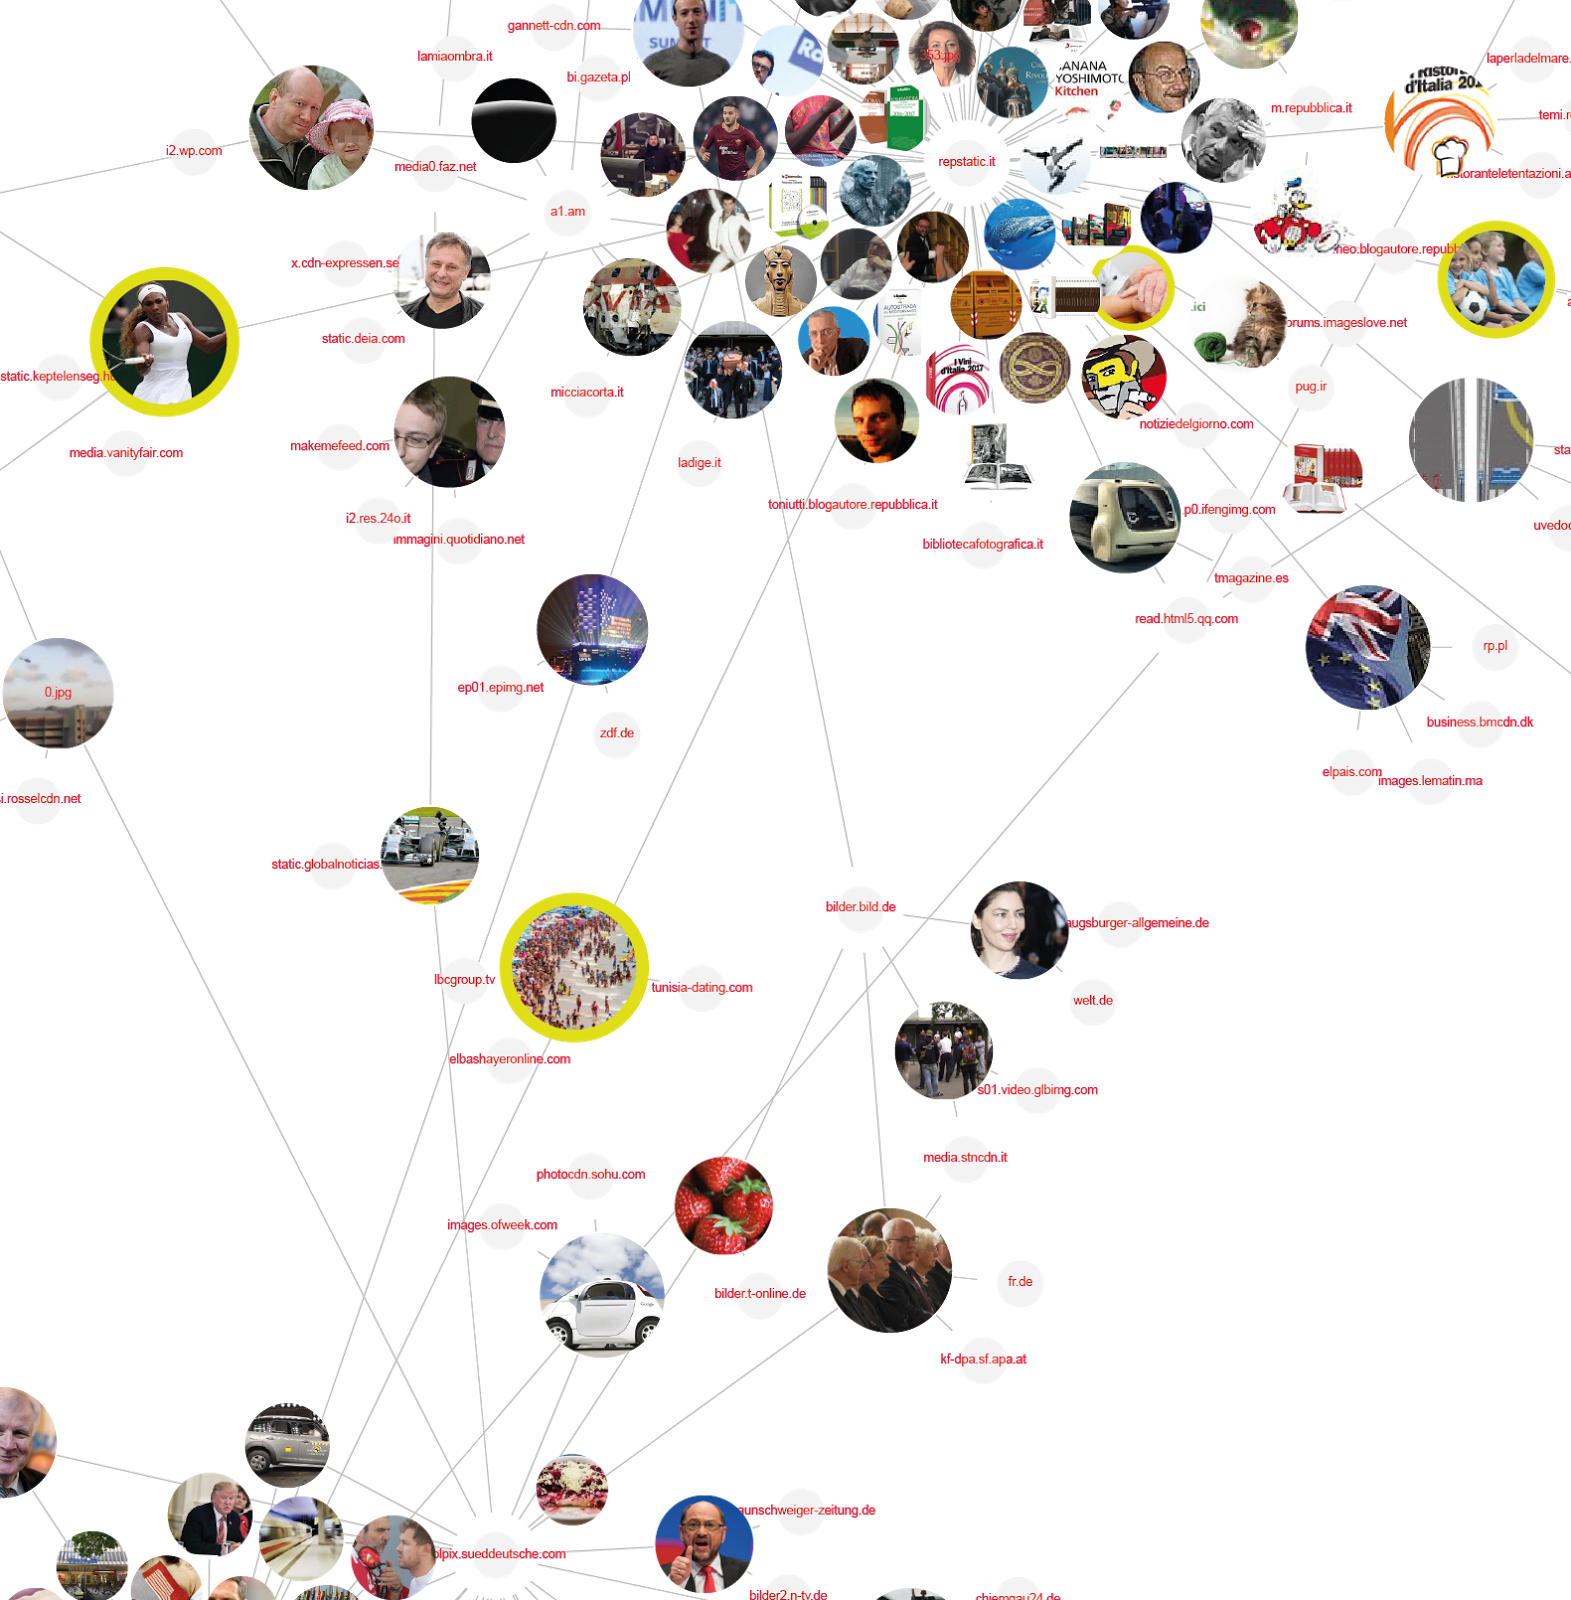 Figure 16 — Close up of the image network. The size of the image is related to the number of time the image occurs.
Research Question 4: What do this study’s findings add to our current understanding of the news image?
As David Machin and Sarah Niblock already noticed in their article ‘Branding Newspapers. Visual texts as social practice’ (2008) “there has been a trend in re-branding newspapers with increased attention to fonts, colors and choices of images…. Ideas, moods and styles are not only presented by written context, but also by visual design” (page number?). The images on the news pages, typography and the placement should therefore be taken into account as well.The appearance of creative and editorial stock images (and sometimes from news agencies) in our findings does indeed contrast the (naive) believe that published images are only placed as a witness of an event. Moreover, we could conclude from our findings that stock images are not only used for the images with a placement low on the homepage, the ‘soft news’ so to say, but also for the ‘hard news’ on the top of the home page of the online newspaper.
Furthermore, we should take into account that since the nineties waves of deregulation in the media industry have led to a commercialization of news production (Hallin, 2000). Newspapers had to reduce staffing in terms of journalists, editors and photographers which pressed them to alter their method in news producing. Not only is the reliance on press releases increased but are reports, interviews and photographs provided as ready-made packages by news agencies for newspapers. This became visible to us when we saw that some of the images that we found on the front page of the online newspaper also appeared on other news websites. We observed also that the images who accompanied an article were often reused for other articles. They were used in a follow up of the first article or a related article. It also happened that articles remained longer on the website while being accompanied by another image. These findings prove that images are indeed no longer placed particularly to be descriptive or bear witness of an event. It suggests adversely that images are used dynamically, but also that a specific image can turn into a generic image over time. 6. Discussion6.1 Opportunities
-
In further research it would be interesting to investigate how many of the images from news agencies are generic in combination with the text. How many articles on online webpages are written by the newspaper’s own journalists or are bought up by bulk? Are the articles from the newspaper’s own journalists more often accompanied with stock images to reduce the costs? In other words, further research could look at the text-image relation in articles that are accompanied with a stock image or a news agency image.
-
It would also be interesting to re-do this project in a year or two. Then we could see if there is an increase in the use of stock images and if news websites are more transparent about the provenance of their images. Another opportunity is to look if the use of stock images for certain topics change over time. Julian Kilker's article 'All About Whom? Stock Photos, Interactive Narratives and How News About Governmental Surveillance Is Visualized’ demonstrates that this kind of research could be interesting, especially with the method that we developed.
6.2 Limitations
-
Due to liveness of newspapers, troubles occurred with scraping both URLs and contextual screenshots of the articles / frontpage. Images that could not be found during analysis are excluded from the research.
-
Using Google Cloud Vision API only lets us search images and web pages that have been indexed by Google. Stock image sources that do not allow search engine indexing may not necessarily be detectable with this method.
-
The memespector tool returns up to 5 urls per match type (gv_web_full_matching_images, etc.), so web presences of images beyond the first five results may have been excluded. The DMI Google Reverse Image Search tool may return more complete results, but that tool runs significantly slower than Vision API and has difficulty finding images from URLs that do not end in a filename (e.g. ‘image.jpg’).
-
Vision API returned a list of visually similar images from around the web for each input image, but we excluded these images from our analysis because these images are often entirely different from the input image. In some cases, they are very visually close to the input image, but it is very difficult to tell if they are the same, even with manual qualitative analysis of both images. Even though many of the images returned under “gv_web_visually_similar_images” were from stock image sources, it would be impossible to discern whether they come from the same source as the input image without more advanced analysis.
-
Our method is limited to images traceable to our list of major stock image providers. In some cases, we found fully matched images from smaller stock image sources, but we did not test for these in our analysis.
-
Scraping all image files on a newspaper’s front page website yields some duplicate images--likely from various images being hosted at different sizes but only one being displayed on the page to the viewer at optimum size. In some cases, though multiple copies of a single image might be displayed at once (such as in the main page and on a “Trending Stories” sidebar).
-
To really analyze the changing significance of stock photos due to their variable use, it is necessary to do a qualitative research (or a very very extensive quantitative one). Capture the (changing) meaning of an image is not (yet) possible without manual coding.
7. Conclusions
In this project we traced the provenance, circulation and uses of images we found on the homepage of five ‘liberal’ national European online newspapers to news websites. The chosen online newspapers had a comparable domestic reputation and do exist in the ‘old fashioned’ paper version as well. This made them interesting to research the quantity of use of global image banks.
In our case study, we found that 11.3% of the images used by newspapers on their front pages originated from image banks. From those image bank pictures, 40% was classified as ‘editorial’ image, 60% belonged to the ‘creative’ category. This case study based research, therefore, proves that the use of image bank pictures by newspapers is a practice that is widely adopted. We should therefore keep in mind that even images in newspapers can be pre-produced and are therefore not necessarily representing an actual event. How do concepts like visual genericity and reusability contribute to a critical appraisal of the role of images in contemporary news-making? Further research should take into account that online newspapers refresh their page frequently. This means that the moment of extracting images, URL’s and all the metadata should be near to each other.8. References
Aiello, G. (2016). Taking Stock. Ethnography Matters.
Aiello, G. (2013). Generiche differenze: La comunicazione visiva della soggettività lesbica nell’archivio fotografico Getty Images. Studi Culturali, anno X, n. 3, 523-548.
Aiello, G. (2012). The ‘other’ Europeans: The semiotic imperative of style in Euro Visions by Magnum Photos. Visual Communication, 11(1), 49-77.
Aiello, G. and Woodhouse, A. (2016). When corporations come to define the visual politics of gender: The case of Getty Images. Journal of Language and Politics, 15(3), 352-368.
Bounegru, L. et al. (2017). A Field Guide to Fake News. Public Data Lab.
Burrell, I. (2014, April 16). The Mirror’s photo of a crying child isn’t what it seems, but that doesn’t make it a hoax. Independent.
Frosh, P. (2003). The Image Factory: Consumer Culture, Photography and the Visual Content Industry. Oxford: Berg.
Frosh, P. (2013). Beyond the image bank: Digital commercial photography. In Martin Lister (Ed.), The Photographic Image in Digital Culture, second edition (pp. 131-148). London and New York: Routledge.
Glückler J. and Panitz, R. (2013). Survey of the Global Stock Image Market 2012. Heidelberg: GSIM Research Group.
Grossman, S. (2014, December 8). ‘Women laughing alone with tablets’ is the new ‘women laughing alone with salad’. TIME.com.
Gürsel, Z. (2016). Image Brokers: Visualizing World News in the Age of Digital Circulation. Berkeley: University of California Press.
Hallin, D. (2000). Commercialism and professionalism in the American news media. In J. Curran and M. Gurevitch (Eds.), Mass Media and Society, third edition. London: Arnold.
Highfield, T. and Leaver, T. (2016). Instagrammatics and digital methods: Studying visual social media, from selfies and GIFS to memes and emoji. Communication Research and Practice, 2(1), 47-62.
Hooton, C. (2014, October 2). The ‘Republicans’ in the ‘Republicans are people too’ advert are all just stock photos. Independent.
Jewitt, C., & Oyama, R. (2001). Visual meaning: A social semiotic approach. In T. van Leeuwen & C. Jewitt (Eds.), Handbook of Visual Analysis (pp. 134–156). London: Sage.
Kennedy, H., Hill, R., Aiello, G. and Allen, W. (2016). The work that visualisation conventions do. Information, Communication & Society, 19(6), 715-735.
Kilker, J. (2016). All about whom? Stock photos, interactive narratives, and how news about governmental surveillance is visualized. Visual Communication Quarterly, 23(2), 76–92.
Machin, D. (2004). Building the world’s visual language: The increasing global importance of image banks in corporate media. Visual Communication, 3(3), 316–36.
Machin, D. and Niblock, S. (2008). Branding newspapers: Visual texts as social practice. Journalism Studies, 9(2), 244–259.
Tooth, R. (2014, April 17). Mirror’s weeping child picture is a lie and smacks of lazy journalism at best. The Guardian.
Thurlow, C. and Aiello, G. (2007). National pride, global capital: A social semiotic analysis of transnational visual branding in the airline industry. Visual Communication, 6(3), 305-344.
Van Leeuwen, T. (2005). Introducing Social Semiotics. London and New York: Routledge.
 Copyright © by the contributing authors. All material on this collaboration platform is the property of the contributing authors.
 Ideas, requests, problems regarding Foswiki? Send feedback


