You are here: Foswiki>Dmi Web>SummerSchool2022ClusteringCultures (12 Sep 2023, HelenaMovchan)Edit Attach
From Ranking to Clustering Cultures
towards a time-varying network analysis of YouTube algorithms on Global Warming and Climate Change
Team Members
Facilitator: João Guilherme Bastos dos Santos
Participants: Aleksy Szymkiewicz Alessandra Facchin Carlos Eduardo Barros Helena Movchan Julia Jasińska Luis Landa Michal Salamon Tal Cohen Xiaoyue Yan
Contents
Links
Introduction
This project aims to improve our understanding about YouTube algorithms’ time-varying dynamics and diverse clustering methods used to analyse it - including video images, descriptions, related videos connections and content subtitles. To do so, we developed a mixed methods approach based in R and Python programming languages, combining network analysis, two strategies for text analysis (Reinert and Semantic Networks), image analysis and multimodal clustering. To collect YouTube search results and correspondent related videos, we used DMI YouTube Data Tools - for subtitles, we used a Python script written by one of the team members. The queries were related to words “Climate Change” and “Global Warming” and its corpus will be the case study of our project.We pay particular attention to (i) how YouTube algorithms could benefit specific clusters of videos in spite of other clusters (instead of looking at videos individually); (ii) the way a combination and comparison among clusters found through different methods could help us understand different layers of this complex network of videos. These methods include network analysis (based on related videos connections and modularity adjustments), text analysis (based on semantic networks and hierarchical clustering), image analysis (using pixplot) and multimodal clustering (clip-ViT-B-32); (iii) network time-varying dynamics (related to variations in search and related videos results obtained from YouTube API, probably related with AI learning and events impacting it). The team was splitted into the following groups, through crossing and discussing the results of each one collectively: Facilitation, video network analysis and R coding
- João Guilherme Bastos dos Santos
- Tal Cohen
- Michal Salamon
- Julia Jasińska
- Xiaoyue Yan
- Aleksy Szymkiewicz
- Carlos Eduardo Barros
- Luis Landa
- Helena Movchan
- Alessandra Facchin
Research Questions
- How does the network built by YouTube ’s related videos algorithm vary on a daily basis for the query ‘Climate Change or Global Warming’? Does its search ranking and related videos centrality favour specific clusters of videos found through network clustering techniques? How does it vary on a daily basis?
- How could we compare different clustering techniques (based on related videos, video descriptions, subtitles, video image thumbnails and engagement metrics) to better understand possible biases in algorithmic decisions involving clusters of videos (instead of considering them individually)? Do the diverse clustering techniques converge in their clustering of similar contents?
- Could we connect changes in the algorithm decisions with global events happening when the changes occurred?
- Will AI generated content (both visual and written) match one of the clusters from the recommended YouTube videos about “Climate Change or Global Warming”? If so, will the generated content fit in clusters well ranked in search results and centrality when it comes to search results and related videos?
Methodology
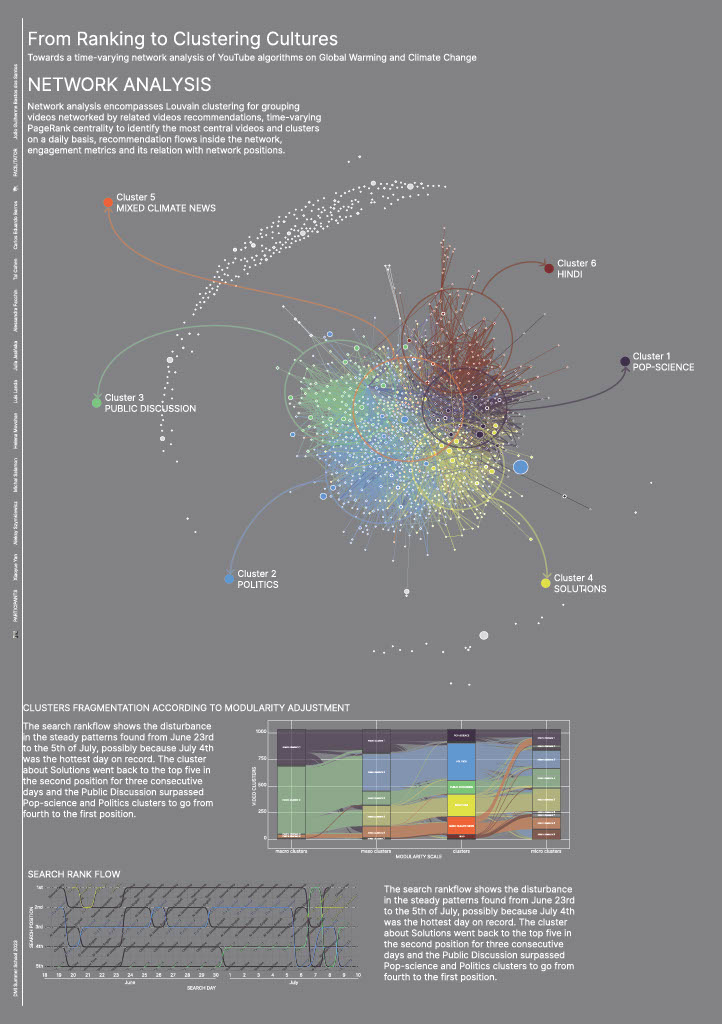
This is a mixed methods approach, combining network, image and text analysis assisted by R and Python languages and interpreted qualitatively by researchers from different fields. Initially, based on the data described previously, we use an original R script to perform:- network analysis: network analysis encompasses Louvain clustering (with four different adjustments) for grouping videos networked by related videos connections, time-varying PageRank centrality to identify the most central videos and clusters on a daily basis, balance among inter-cluster bridges arriving and departing from each cluster, comparisons between search and centrality rankflows over time, engagement metrics and its relation with network positions.
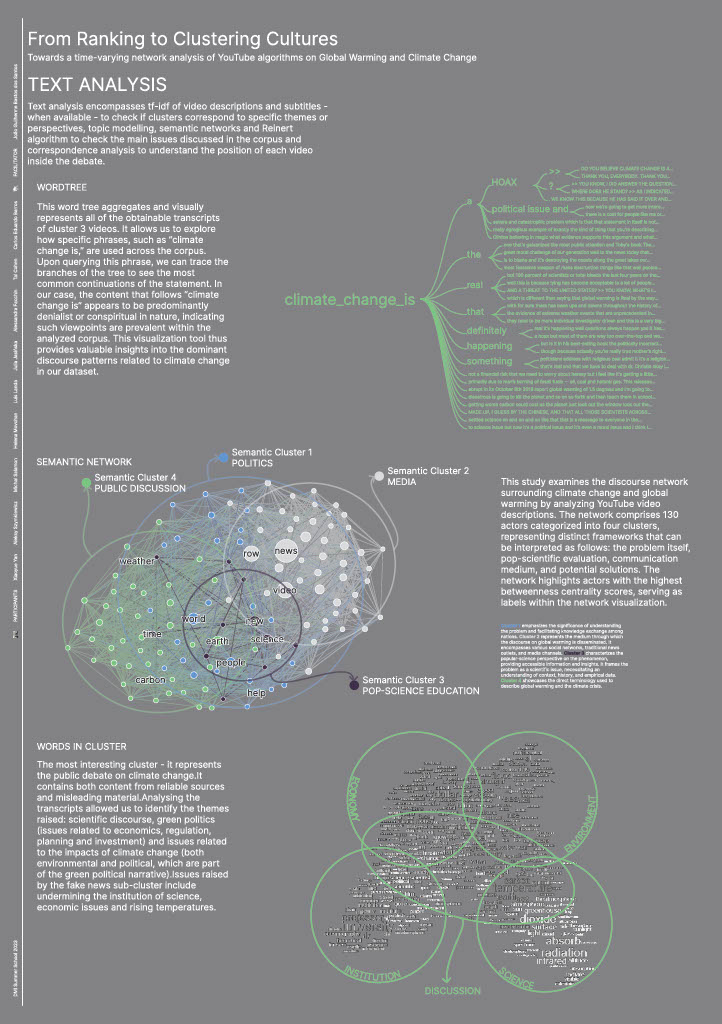
- text analysis: Reinert algorithm for hierarchical clustering (reaching ‘genealogical trees’ of vocabularies inside the corpus), tf-idf of video descriptions to check if clusters correspond to specific themes or perspectives, and topic modelling. The script also produces outputs for IRaMuTeQ (Interface de R pour les Analyses Multidimensionnelles de Textes et de Questionnaires), used to help the group dedicated to interpreting and investigating through text analysis.
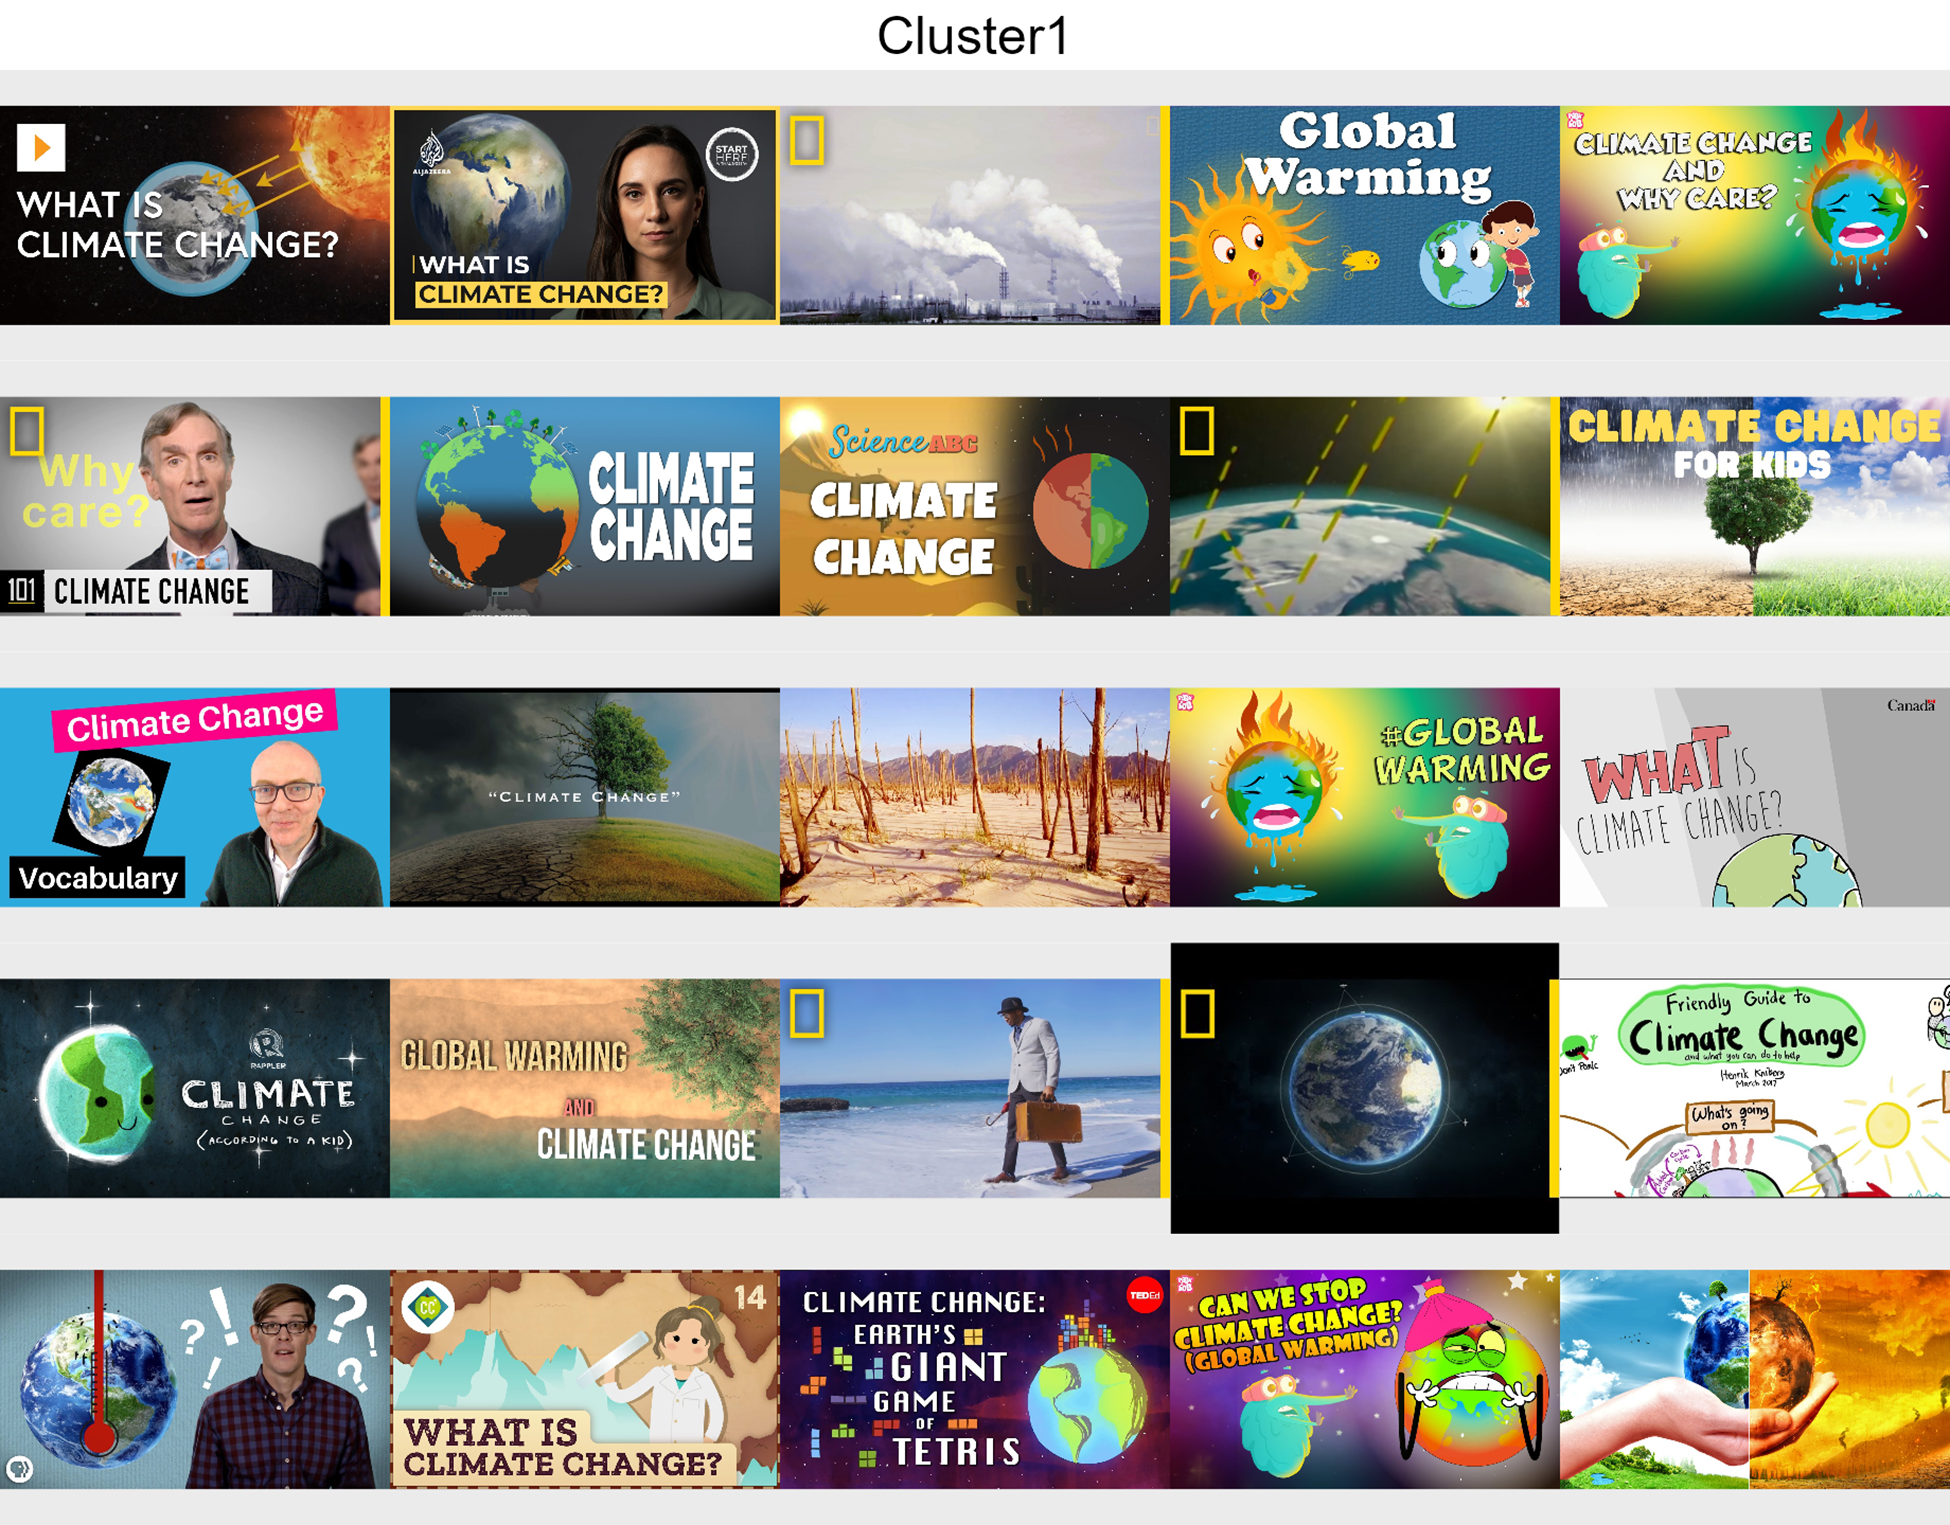
- image analysis: download video thumbnail images, build thumbnail grids per cluster with the videos receiving more related video connections and cluster folders with all thumbnail images available also splitted by cluster to be analyzed qualitatively to check if clusters correspond to specific grammars, aesthetics or symbols.
- Video thumbnails and descriptions were also used for a multimodal clustering, which used the model clip-ViT-B-32 (Radford et al., 2021) to create multimodal embedding and the Python package BERTopic to cluster the embeddings.
- Based on the video list, a Python script was written to download the complete subtitles of the videos, perform subtitles tf-idfs indicating the most specific topic in each video.
- The description of the videos was used as a source for the composition of a graph using WORDij to identify connections among words and Gephi to cluster and analyse its semantic networks.
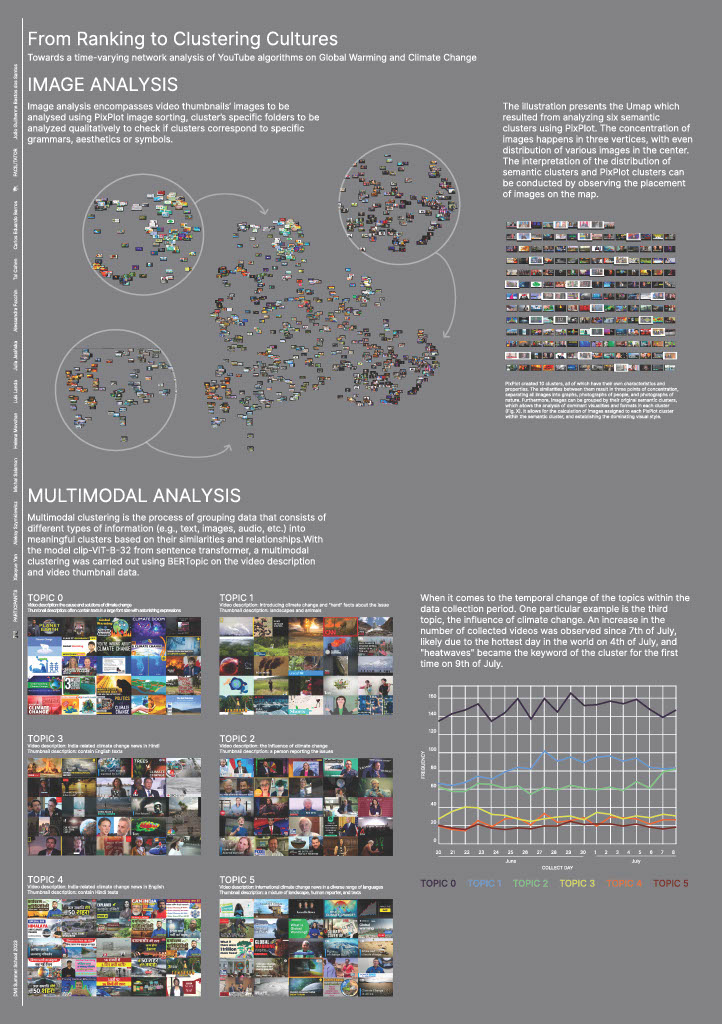
- Image analysis encompasses video thumbnails’ images to be analysed using PixPlot image sorting, cluster’s specific folders.
- We used ChatGPT to produce hypothetical video metadata for the same words used in the query and check with which cluster this data would match (and consequently, if it would be in clusters privileged by YouTube algorithm when it comes to search ranking and network centrality).
Initial Data Sets
Using DMI YouTube Data Tools we collected lists of videos resulting from the query ‘Climate Change’ and ‘Global Warming’ (gathering the maximum of 500 videos) and their related videos network (only collecting related videos that are also present in the video list from the query). Using an R code, both datasets (daily collections of search results and related videos) were compiled and crossed. Considering how the related videos of each day constitute a different network graph, it enabled us to create a time-varying network of related videos, allowing us to grasp the dynamic network structure of videos combined with search rankflow and other video metadata. The dataset is a two weeks daily collection (from 19/06/23 until 10/07/23) of YouTube video lists for the query Global Warming and Climate Change - and its related videos - using DMI YouTube Data Tools. It has 9,257 search results, encompassing 1,289 unique videos from 724 channels. These videos were connected to each other by 35,441 related videos connections during the period analysed, which will be the edges to our clustering.Findings
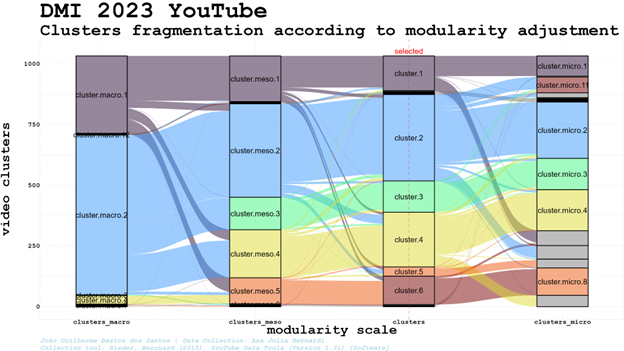
Using Louvain (igraph R package) to cluster the videos in the related videos network can result in sharply different scenarios according to slight changes in its modularity adjustments. Ranging from a clearly two-sided polarised scenario using modularity 0.5 (polarised between cluster.macro.1 and cluster.macro.2) to a plural eleven-sided cluster identification considering modularity 1.25 (splitted into diverse micro clusters), the very same network can depict radically different clustering patterns and landscapes. Like other research methods, more than a reality discovered through algorithms, network clusterization is rather constructed[1] by algorithmic adjustments chosen by the researchers using it - or inadvertently accepting the default adjustment as the only one possible.
We checked images and texts to understand if the adjustment chosen, modularity 1, was able to split the network into thematically coherent clusters, described below. We do not discard, though, the way in which these clusters can be merged or splitted with new adjustments. In our method, the selection of specific adjustments is related to the cluster's capacity to group videos related to specific perspectives or activities (disinformation campaigns, for example) enabling further qualitative analysis. The related video connections were useful, for example, to cluster videos containing disinformation into a cluster (though mixed with truthful ones in this specific cluster), enabling us to quickly identify topics and aesthetics to track if we are interested in this kind of content.
Clusters and YouTube algorithms
Checking qualitatively the related videos clusters found using modularity 1 and 25 thumbnails of videos receiving most related video edges on each cluster, the participants focused on clusters’ interpretation described the clusters as follows[2]:
■Cluster 1: Pop-science
Educational content mixing institutional and childish styles, images of planet earth, drawings and many videos from NatGeo.[1]
Like other research methods, more than a reality discovered through algorithms, network clusterization is rather constructed[1] by algorithmic adjustments chosen by the researchers using it - or inadvertently accepting the default adjustment as the only one possible.
We checked images and texts to understand if the adjustment chosen, modularity 1, was able to split the network into thematically coherent clusters, described below. We do not discard, though, the way in which these clusters can be merged or splitted with new adjustments. In our method, the selection of specific adjustments is related to the cluster's capacity to group videos related to specific perspectives or activities (disinformation campaigns, for example) enabling further qualitative analysis. The related video connections were useful, for example, to cluster videos containing disinformation into a cluster (though mixed with truthful ones in this specific cluster), enabling us to quickly identify topics and aesthetics to track if we are interested in this kind of content.
Clusters and YouTube algorithms
Checking qualitatively the related videos clusters found using modularity 1 and 25 thumbnails of videos receiving most related video edges on each cluster, the participants focused on clusters’ interpretation described the clusters as follows[2]:
■Cluster 1: Pop-science
Educational content mixing institutional and childish styles, images of planet earth, drawings and many videos from NatGeo.[1]
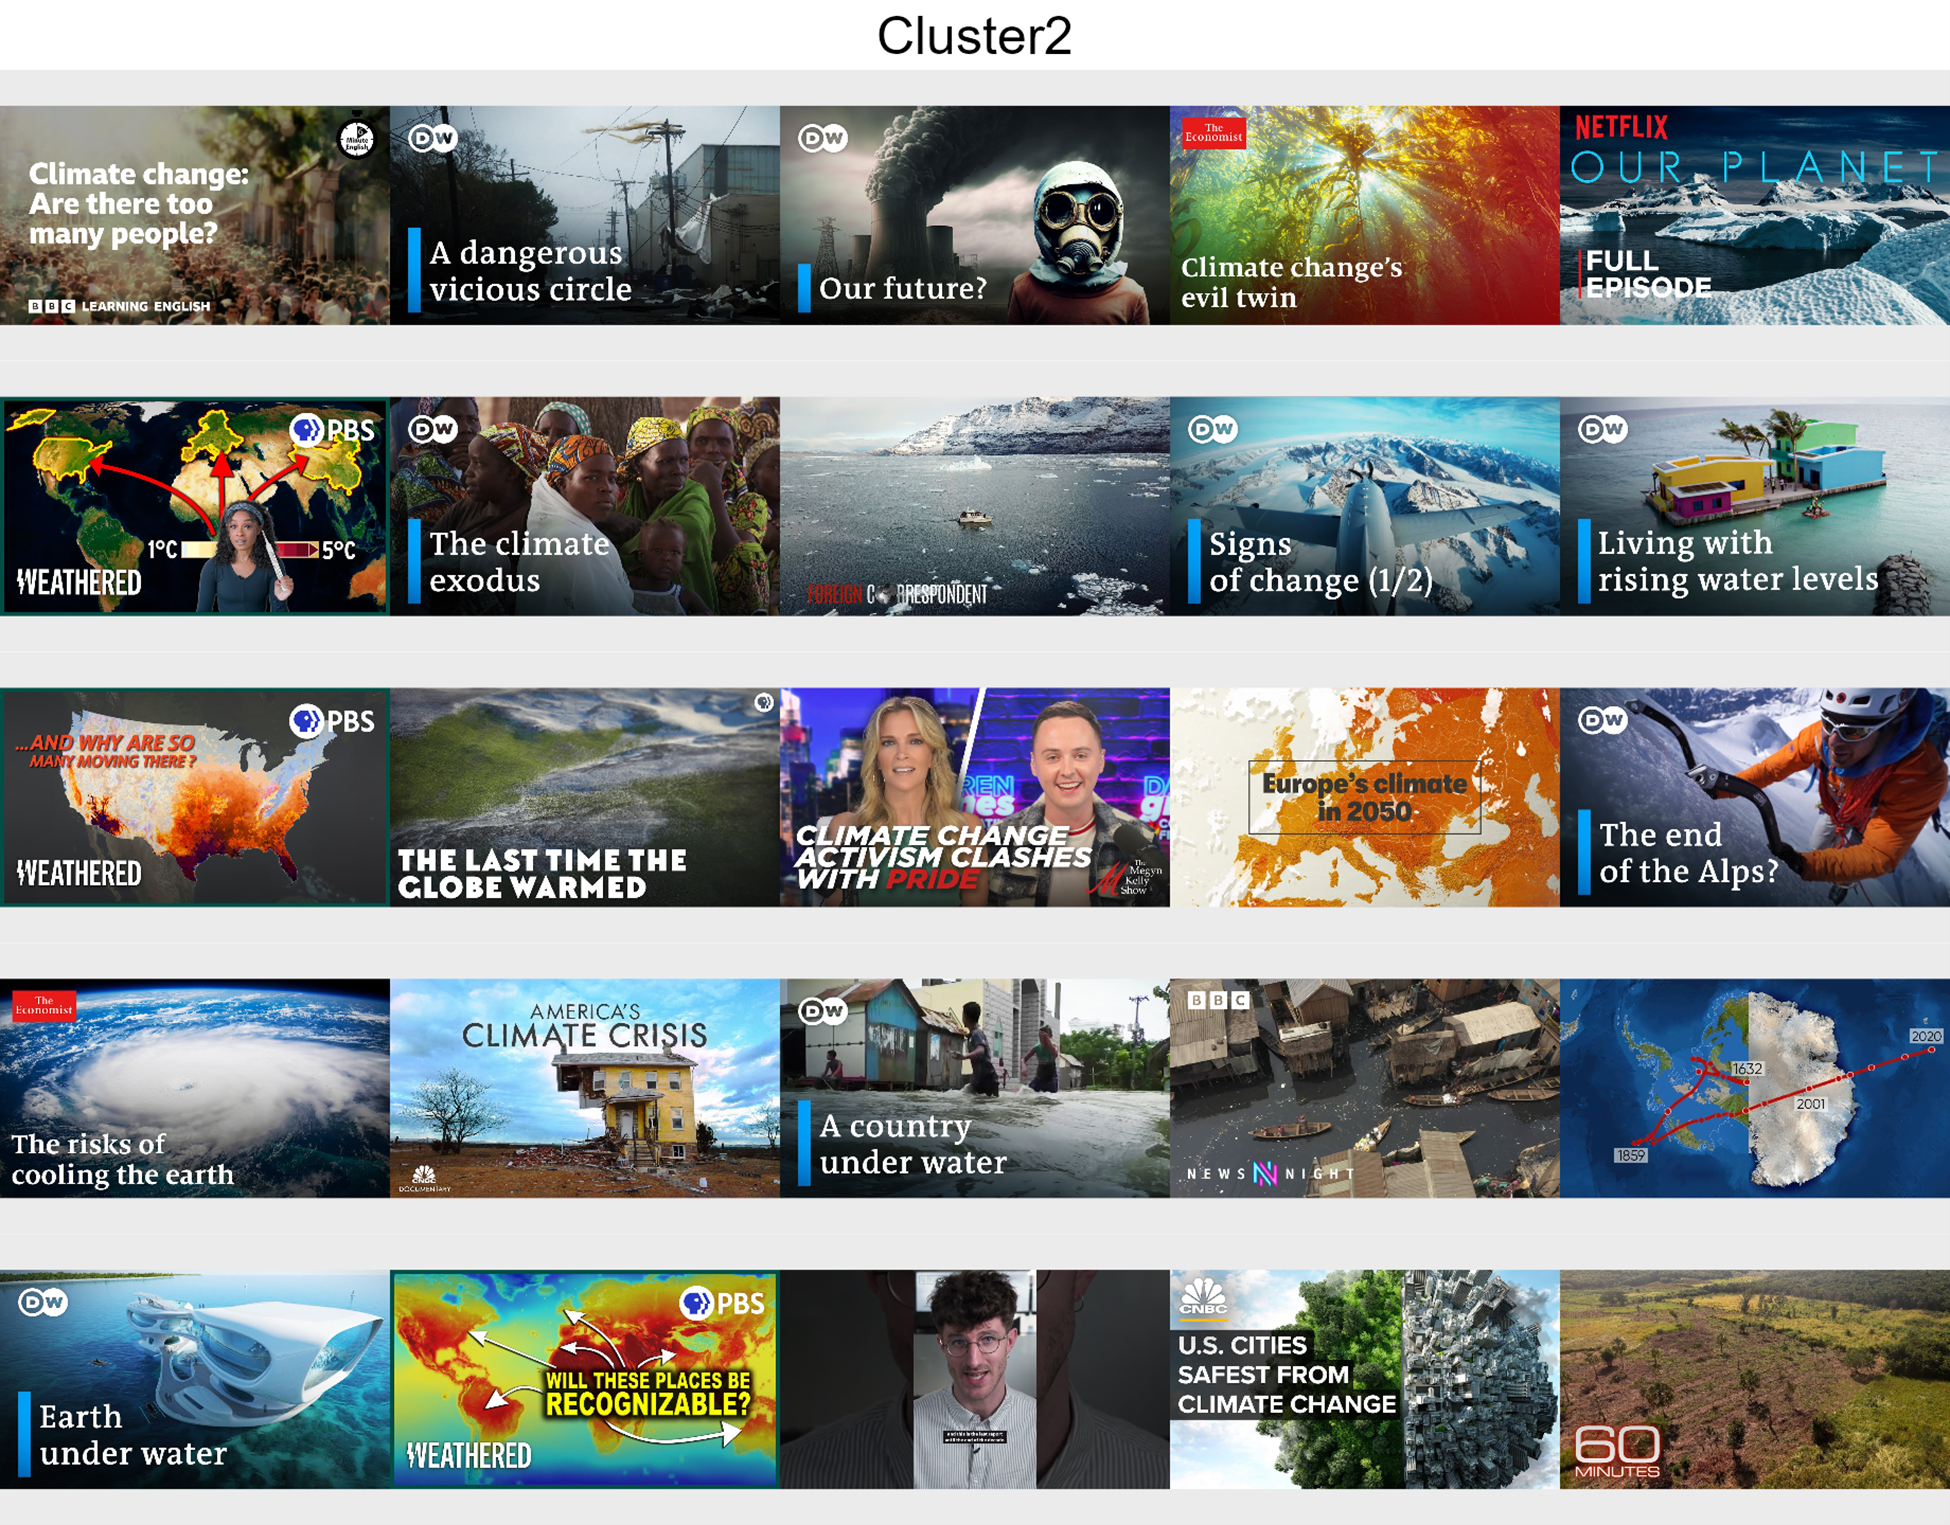
 ■Cluster 2: Politics
Media videos (mainly DW) about news and curiosities on current and further impacts of climate change, using images of disasters and altered landscapes (image 2).
■Cluster 2: Politics
Media videos (mainly DW) about news and curiosities on current and further impacts of climate change, using images of disasters and altered landscapes (image 2).
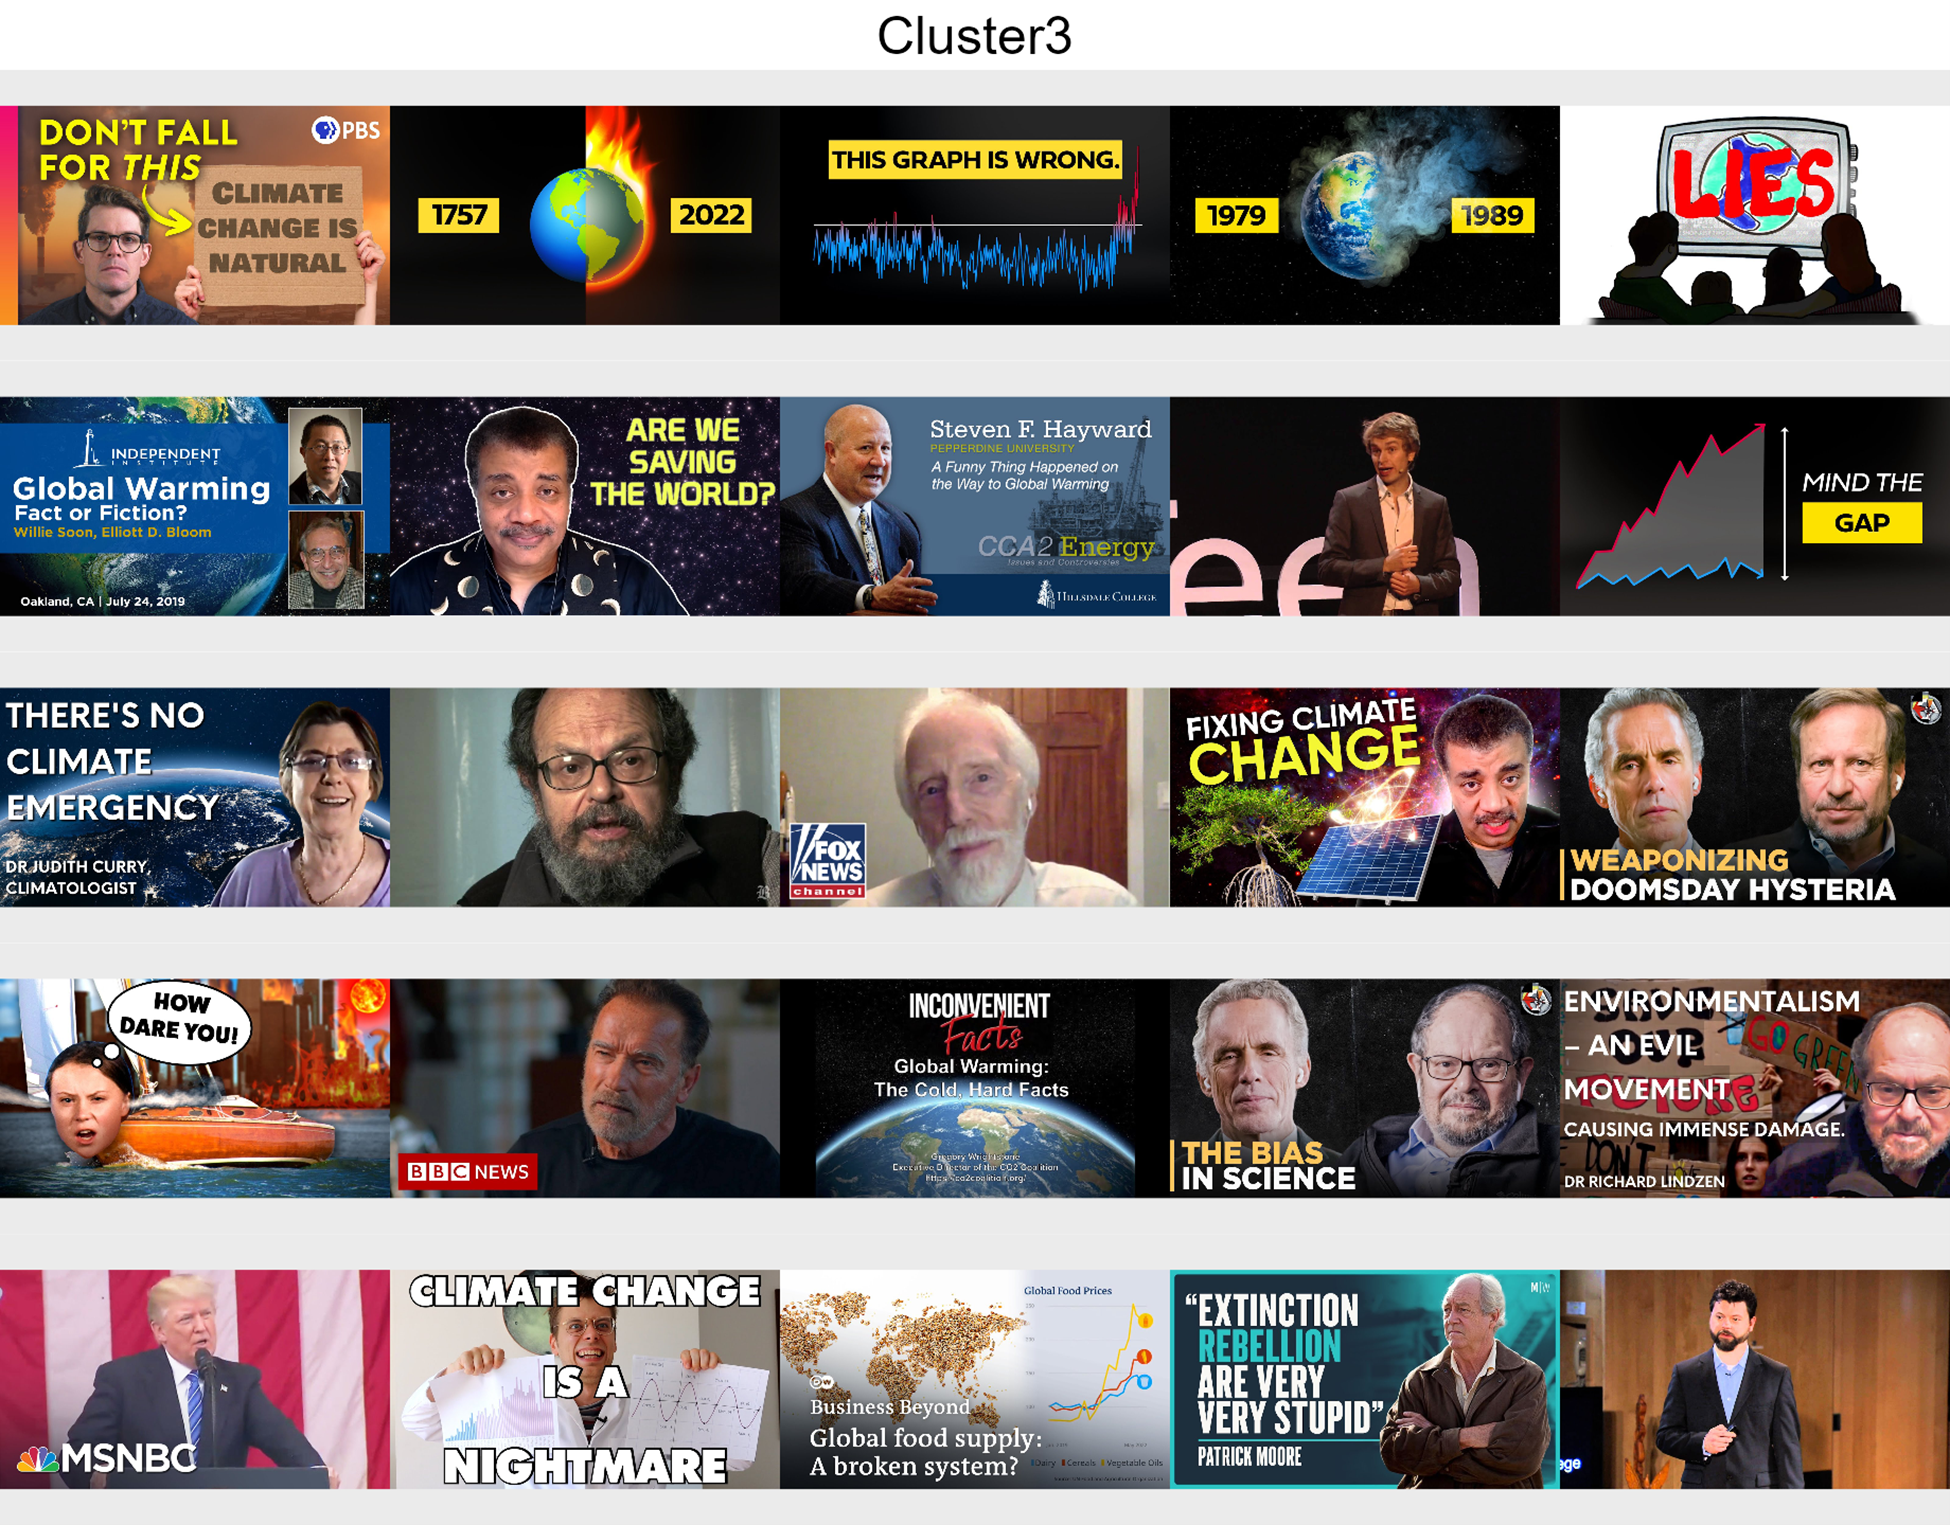
 ■Cluster 3: Public discussion
Portraying scientists, politicians and data graphs, both reliable and misleading content are presented here in a debunker attitude about climate change details, limits and misinterpretations.
■Cluster 3: Public discussion
Portraying scientists, politicians and data graphs, both reliable and misleading content are presented here in a debunker attitude about climate change details, limits and misinterpretations.
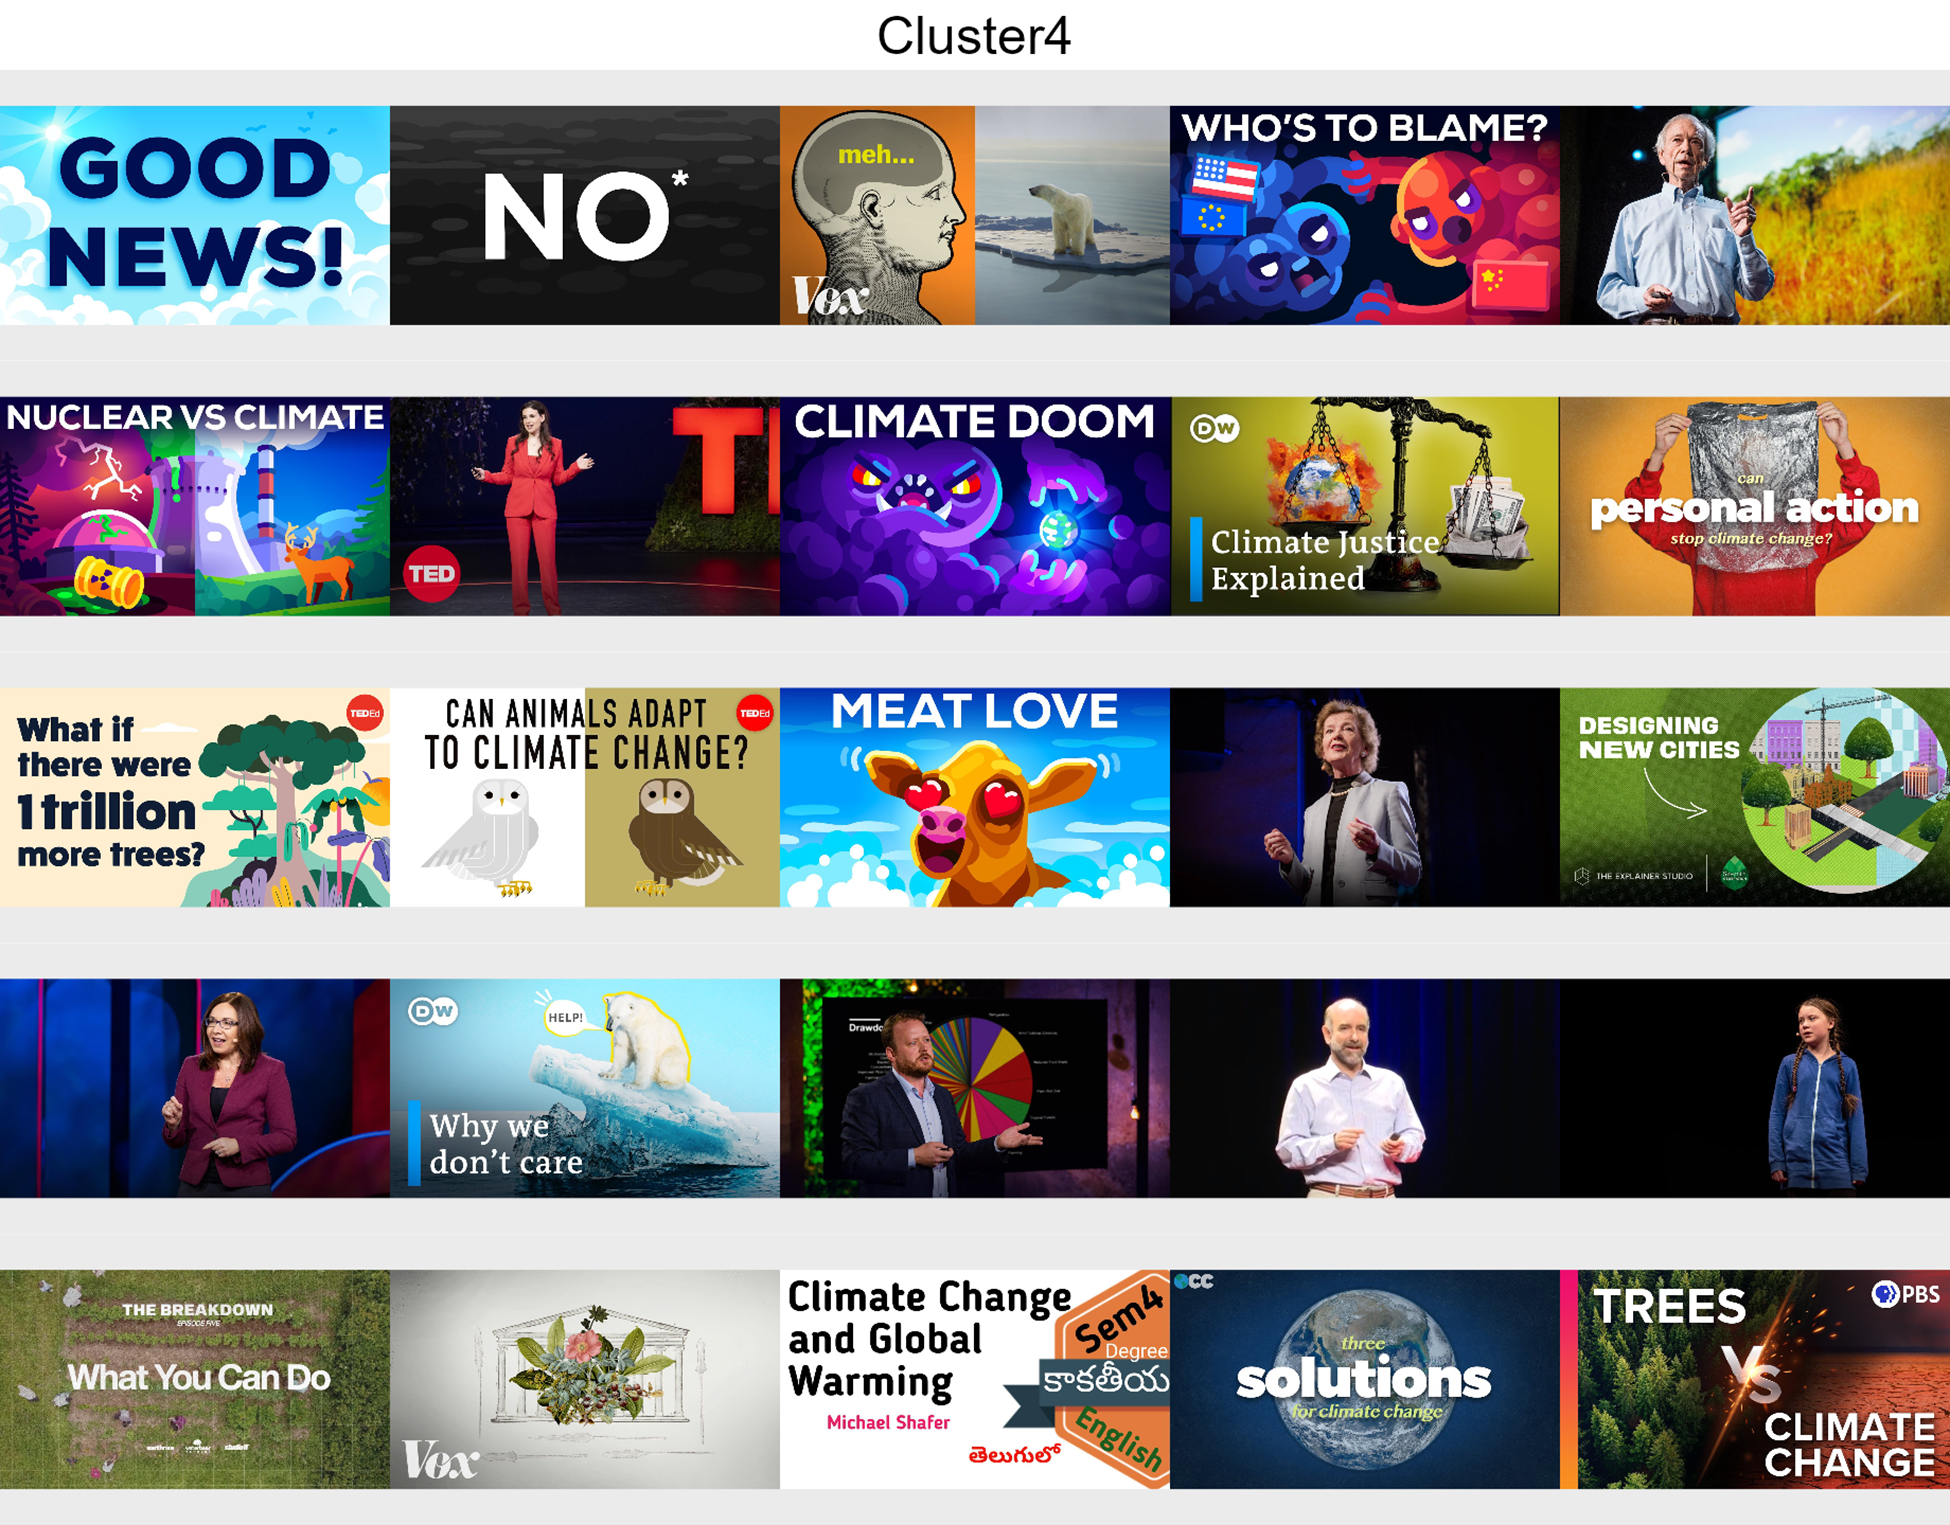
 ■Cluster 4: Solutions
Analysis videos such as lecturers and animations about solutions on what to do to minimise climate change.
■Cluster 4: Solutions
Analysis videos such as lecturers and animations about solutions on what to do to minimise climate change.
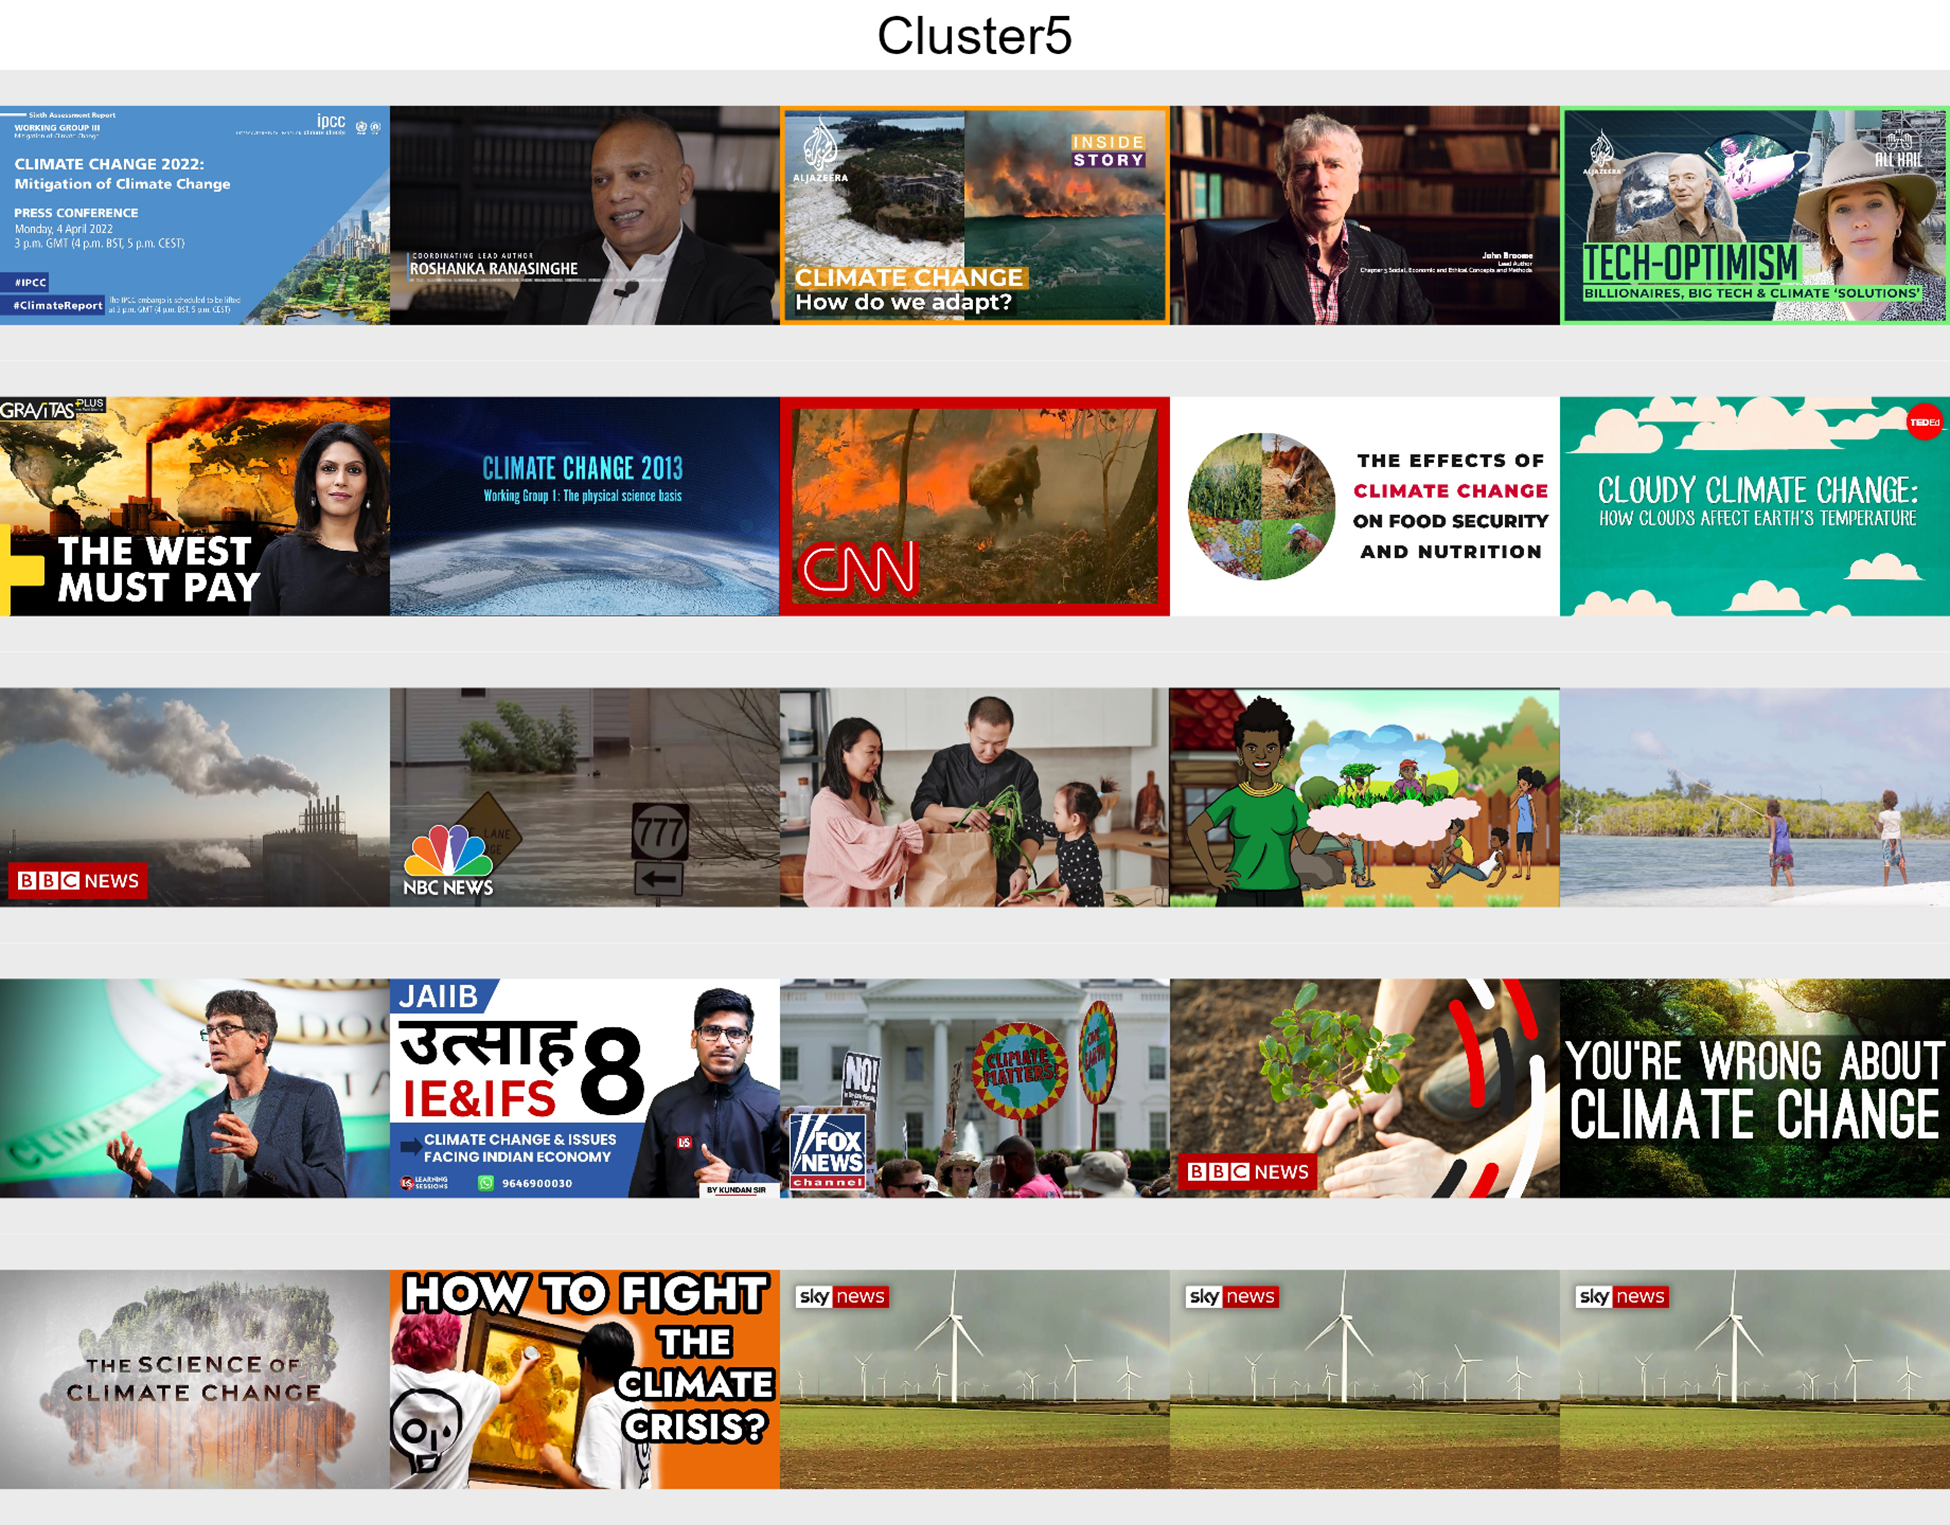
 ■Cluster 5: Mixed climate news
 Different types of content about the topic, presenting experts, illustrations and nature landscapes.
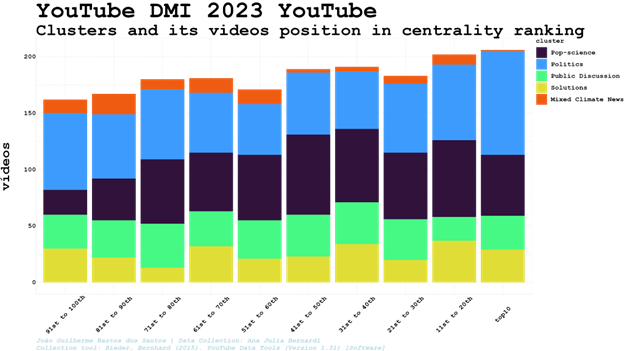
 Though the related videos clustering considers just this network dimension of videos - not taking into account position in search results, video description or thumbnail images - it produces groups presenting specific patterns in the way they appear in search results, the words in its descriptions and images in its thumbnails. It is worth noting the relevance of round images of earth among images in related videos cluster 1 and absence of it in cluster 2. Therefore, we confirm that image or text clustering might be able to reach results similar to the ones offered by related videos network clustering - what is extremely relevant once researchers will not be able to access related videos data a month after the end of DMI 2023 Summer School.
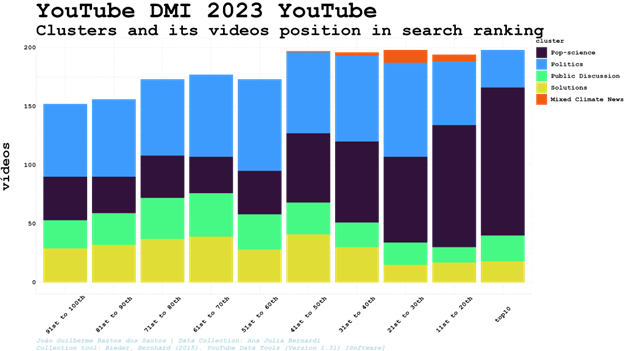
Below, the distribution of the five clusters among the top 100th top positions in search results during the period analysed, including 7,801 videos from our search results (out of 9,257, once there are videos outside the major clusters. That’s the reason why there is a blank space upon some columns).
Though the related videos clustering considers just this network dimension of videos - not taking into account position in search results, video description or thumbnail images - it produces groups presenting specific patterns in the way they appear in search results, the words in its descriptions and images in its thumbnails. It is worth noting the relevance of round images of earth among images in related videos cluster 1 and absence of it in cluster 2. Therefore, we confirm that image or text clustering might be able to reach results similar to the ones offered by related videos network clustering - what is extremely relevant once researchers will not be able to access related videos data a month after the end of DMI 2023 Summer School.
Below, the distribution of the five clusters among the top 100th top positions in search results during the period analysed, including 7,801 videos from our search results (out of 9,257, once there are videos outside the major clusters. That’s the reason why there is a blank space upon some columns).
 Being in the cluster of videos identified as Pop-science a video clearly has more chances of being the top10. Once the videos were clustered only considering its related video connections, it can show a degree of interaction between search and related videos algorithms. Therefore, instead of checking videos well ranked individually, we can identify groups of videos - and the perspectives, frames, words and images it entails - more willing to be better positioned in the search results during a specific period of time or political event (daily variations will be considered using clusters search and centrality rankflows).
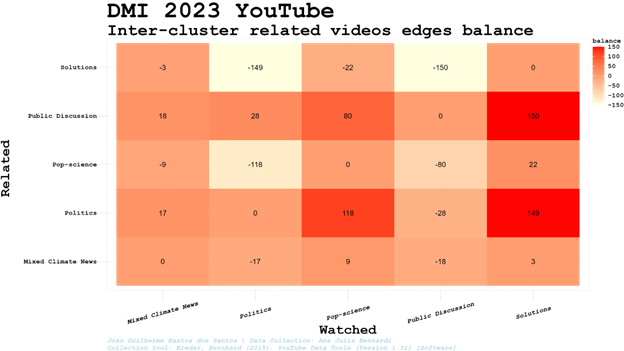
On the other hand, if users have contact with a cluster of videos through search results, following video connections related to the video chosen (from which we could just collect related videos using the platform API, a feature deactivated by YouTube in August 2023) they might be directed to other clusters and videos (including the ones not well ranked or even shown in search results). Therefore, we must also consider the inter-cluster edge balance (difference between the amount of inter-cluster related videos edges entering and leaving the cluster, resulting in ‘0’ when we check connection of a cluster with itself).
Being in the cluster of videos identified as Pop-science a video clearly has more chances of being the top10. Once the videos were clustered only considering its related video connections, it can show a degree of interaction between search and related videos algorithms. Therefore, instead of checking videos well ranked individually, we can identify groups of videos - and the perspectives, frames, words and images it entails - more willing to be better positioned in the search results during a specific period of time or political event (daily variations will be considered using clusters search and centrality rankflows).
On the other hand, if users have contact with a cluster of videos through search results, following video connections related to the video chosen (from which we could just collect related videos using the platform API, a feature deactivated by YouTube in August 2023) they might be directed to other clusters and videos (including the ones not well ranked or even shown in search results). Therefore, we must also consider the inter-cluster edge balance (difference between the amount of inter-cluster related videos edges entering and leaving the cluster, resulting in ‘0’ when we check connection of a cluster with itself).
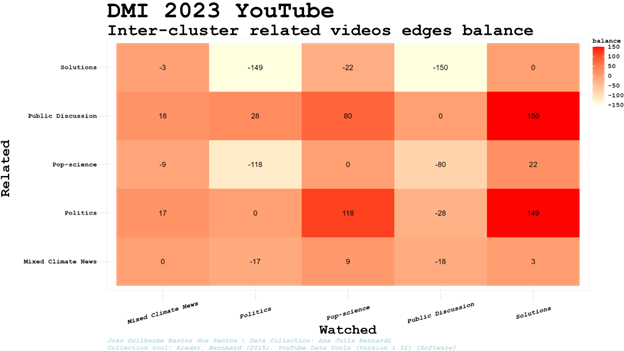 Therefore, probably entering our network of videos through the Pop-science cluster, users are more willing to be directed (if we consider related videos as network connections) to the Politics or Public Discussion clusters. Though the group of videos clustered is collectively relevant in search results, it does not mean that the same cluster will be the most relevant in network indegree or centrality. It is worth noting that the Public Discussion cluster is the only one ‘receiving’ more than ‘sending’ edges to all other clusters considered, and this cluster will be explored in detail in the following sections.
Considering the time-varying dynamics, search results presented more stable ranking results on a daily basis considering clusters, even when the channels involved varied (two channels of the same cluster take turns, but the cluster keeps its position in the rank). The search rankflow shows a disturbance in the steady patterns found from June 23rd to the 5th of July, possibly because of the interest in the topic brought by the fact that July 4th was the hottest day on record.
Therefore, probably entering our network of videos through the Pop-science cluster, users are more willing to be directed (if we consider related videos as network connections) to the Politics or Public Discussion clusters. Though the group of videos clustered is collectively relevant in search results, it does not mean that the same cluster will be the most relevant in network indegree or centrality. It is worth noting that the Public Discussion cluster is the only one ‘receiving’ more than ‘sending’ edges to all other clusters considered, and this cluster will be explored in detail in the following sections.
Considering the time-varying dynamics, search results presented more stable ranking results on a daily basis considering clusters, even when the channels involved varied (two channels of the same cluster take turns, but the cluster keeps its position in the rank). The search rankflow shows a disturbance in the steady patterns found from June 23rd to the 5th of July, possibly because of the interest in the topic brought by the fact that July 4th was the hottest day on record.
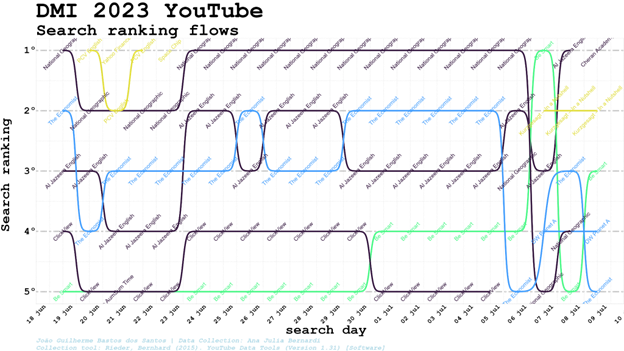 The Solutions cluster, out of the search top5 since 23rd of June, stabilised itself in the second position for three consecutive days (probably more, once it was in this position in our last collection). At the same time, Public Discussion went from 4th to 1st position, then subsequently 5th and 4th, while Politics went from 2nd in July 5 to 5th, 4th, 3rd, 4th and 3rd again in the following days, taking turns with Public Discussion in these positions. At the same time, Pop-science occupied the first position again for three consecutive days after the only day in which the Public Discussion cluster reached it. The cluster about Solutions went back to the top five in the second position for three consecutive days and the Public Discussion surpassed Pop-science and Politics clusters to go from fourth to the first position.
 Considering the disturbances in days 5 to 7 of July, we hypothesise that this may be due to an increase in Google and YouTube Search queries for content related to climate change and the hottest day on Earth since measurements began (it occurred on 4th of July). We checked the number of queries for "hottest day" and "climate myth" in Google Trends. The results of Google Trends for both the phrases “hottest day” and “climate day” show that Google searches between 5th and 7th of July showed an increase in query interest. For YouTube, on the other hand, queries increased on 5th July, then returned to their original values. Between July 5th and 7th there was indeed an increase in searches for these terms on both search engines. Though the collection for the summer school is not long enough to enable broader conclusions, it is worth pointing it out as an object for further investigation of the possibility of changes in the algorithm linked to global climate-related events, despite the fact that we are unable to confirm causality.
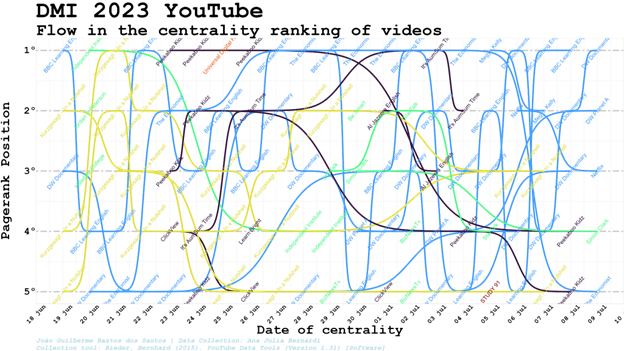
Checking how clusters and channels relevances in network PageRank centrality varies in the same period, we can see a rather unstable scenario of changes on a daily basis (that might look less unstable if we check rankflow hour to hour, or minute to minute). The Politics cluster is the one that seems to dominate the top 10, with diverse channels inside this cluster taking turns in the first positions.
Given sharp variations according to the day analysed, grouping the PageRank positions and clusters in a single snapshot puts together the periods in which it was relevant and the ones in which it was not, depicting some clusters as simultaneously among the top 10 and last positions. It confirms the relevance of understanding the positions in the period and context in which these PageRank positions were registered, without expecting a cluster to be always relevant or always in the last positions regardless of the day in which the collection was made.
Considering the disturbances in days 5 to 7 of July, we hypothesise that this may be due to an increase in Google and YouTube Search queries for content related to climate change and the hottest day on Earth since measurements began (it occurred on 4th of July). We checked the number of queries for "hottest day" and "climate myth" in Google Trends. The results of Google Trends for both the phrases “hottest day” and “climate day” show that Google searches between 5th and 7th of July showed an increase in query interest. For YouTube, on the other hand, queries increased on 5th July, then returned to their original values. Between July 5th and 7th there was indeed an increase in searches for these terms on both search engines. Though the collection for the summer school is not long enough to enable broader conclusions, it is worth pointing it out as an object for further investigation of the possibility of changes in the algorithm linked to global climate-related events, despite the fact that we are unable to confirm causality.
Checking how clusters and channels relevances in network PageRank centrality varies in the same period, we can see a rather unstable scenario of changes on a daily basis (that might look less unstable if we check rankflow hour to hour, or minute to minute). The Politics cluster is the one that seems to dominate the top 10, with diverse channels inside this cluster taking turns in the first positions.
Given sharp variations according to the day analysed, grouping the PageRank positions and clusters in a single snapshot puts together the periods in which it was relevant and the ones in which it was not, depicting some clusters as simultaneously among the top 10 and last positions. It confirms the relevance of understanding the positions in the period and context in which these PageRank positions were registered, without expecting a cluster to be always relevant or always in the last positions regardless of the day in which the collection was made.
 Reading through the main clusters
Analysing videos of each cluster, participants looked for what was in debate, who was speaking, which scenarios were described about present and future, which vocabulary and aesthetic elements were presented, and if there were calls to action or not. The subset of videos classified by them as false information was later submitted to the same process of video content transcription analysis and semantic network. The so-called ‘disinformation videos’ show similar aesthetic patterns with the rest of the Public Discussion cluster. Most of the discussions in this cluster were based on technical details that supposedly compromises the data about global warming. Speakers are also scientists, politicians or journalists focused on debunking the emergency status of the topic, wondering about political motivations for mainstream scientists’ claims and arguing against the idea of a consensus on anthropogenic climate change and its real impact and danger.
Curiously, Public Discussion cluster concentrates videos pro and against mainstream climate science, being particularly interesting to our purposes. Therefore, the disinformation might not be the factor influencing most the clustering of these videos, but the way arguments are framed and presented could be an important feature - related videos are also influenced by co-viewing activities, and viewers can check both kinds of videos for comparisons or act commenting in videos with which they disagree to favour their perspective, etc. Once we don’t have access to co-viewing data, it is hard to tell the impact of metadata not available to us. It can tell us how false information receiving more attention inside this topic is being framed and which template they are using, helping investigations to subset the videos and reach them, rather than expecting all disinformation to receive a specific set of homogeneous related videos.
Hierarchical clustering
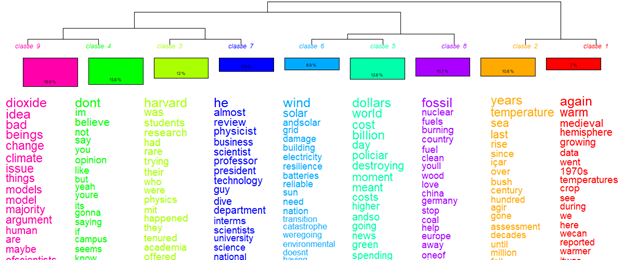
We decided to look deeper into the video content of Public Discussion cluster to better understand (i) which of these videos contains disinformation[3] and (ii) what narratives they address. We then downloaded automatic translations of the videos and also fed them into IRaMuTeQ [4] (Interface de R pour les Analyses Multidimensionnelles de Textes et de Questionnaires) for text analysis. More specifically, to employ descendent hierarchical clustering and correspondence analysis and export the plots (also using the rainette R package directly during the analysis). This hierarchical clustering is presented as a dendrogram, and can be understood as a “genealogical tree” of vocabularies in the corpus.
The dendrograms show that Public Discussion cluster subtitles include: scientific discourse; green politics (issues related to economics, regulation, planning and investment); and issues related to climate change impacts (both environmental and political, which are included in the green politics narrative).
Reading through the main clusters
Analysing videos of each cluster, participants looked for what was in debate, who was speaking, which scenarios were described about present and future, which vocabulary and aesthetic elements were presented, and if there were calls to action or not. The subset of videos classified by them as false information was later submitted to the same process of video content transcription analysis and semantic network. The so-called ‘disinformation videos’ show similar aesthetic patterns with the rest of the Public Discussion cluster. Most of the discussions in this cluster were based on technical details that supposedly compromises the data about global warming. Speakers are also scientists, politicians or journalists focused on debunking the emergency status of the topic, wondering about political motivations for mainstream scientists’ claims and arguing against the idea of a consensus on anthropogenic climate change and its real impact and danger.
Curiously, Public Discussion cluster concentrates videos pro and against mainstream climate science, being particularly interesting to our purposes. Therefore, the disinformation might not be the factor influencing most the clustering of these videos, but the way arguments are framed and presented could be an important feature - related videos are also influenced by co-viewing activities, and viewers can check both kinds of videos for comparisons or act commenting in videos with which they disagree to favour their perspective, etc. Once we don’t have access to co-viewing data, it is hard to tell the impact of metadata not available to us. It can tell us how false information receiving more attention inside this topic is being framed and which template they are using, helping investigations to subset the videos and reach them, rather than expecting all disinformation to receive a specific set of homogeneous related videos.
Hierarchical clustering
We decided to look deeper into the video content of Public Discussion cluster to better understand (i) which of these videos contains disinformation[3] and (ii) what narratives they address. We then downloaded automatic translations of the videos and also fed them into IRaMuTeQ [4] (Interface de R pour les Analyses Multidimensionnelles de Textes et de Questionnaires) for text analysis. More specifically, to employ descendent hierarchical clustering and correspondence analysis and export the plots (also using the rainette R package directly during the analysis). This hierarchical clustering is presented as a dendrogram, and can be understood as a “genealogical tree” of vocabularies in the corpus.
The dendrograms show that Public Discussion cluster subtitles include: scientific discourse; green politics (issues related to economics, regulation, planning and investment); and issues related to climate change impacts (both environmental and political, which are included in the green politics narrative).
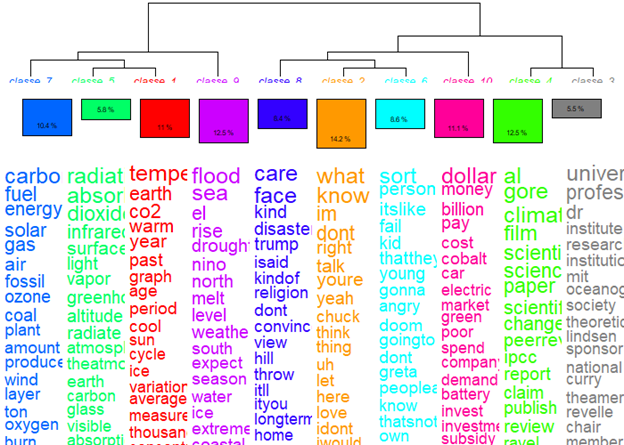 We identified 35 videos as potentially misleading or misinformative videos out of the 201 videos in the collection. In doing so, we were able to identify the sub-cluster inside the Public Discussion cluster dealing specifically with false information and compare the textual patterns found with the overall patterns. It shows that Public Discussion cluster works as a hub for content exchange between reliable material on climate change and misleading information.
 The main themes in this subcluster were issues related to undermining science and its institutions, economics and rising temperatures. The analysis shows that there is a small range of words unique to misrepresentation (hoax, scientific models, believing, opinions), but in the main the vocabulary was strongly associated with the credibility subcluster. The implication is that authors of misleading material may be using the same concepts and vocabulary in an attempt to undermine their credibility and scientific validity.
Semantic network analysis
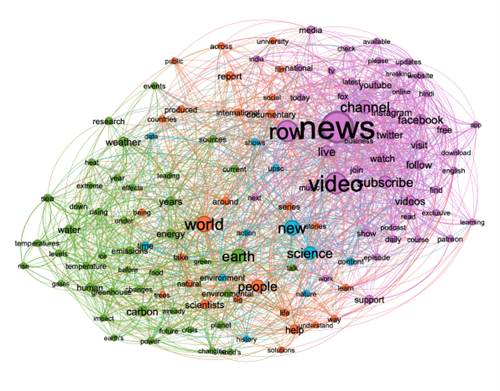
Using WordIJ, a semantic network analysis software (Danowski, 2013), we created a word link list for the description of the videos. The measures we used were words that appeared at least 25 times, at a window size for word pairs of 3. We used the software’s English stop word dictionary and extracted a list of the edges of the semantic network. Afterwards, we inserted the edges list to Gephi (Bastian, Heymann & Jacomy, 2009) and created the network, which contains 130 nodes. We used the modularity measure for clustering the network’s actors, and the size of the nodes indicates the betweenness centrality measure. The resulting network consists of 130 actors divided into four clusters representing distinct frameworks. The actors with the highest betweenness centrality scores in each cluster are: "world," "people," and "help" in Semantic network cluster 1; "news," "video," and "row" in Semantic network cluster 2; "new," "science," and "time" in Semantic network cluster 3; and "earth," "carbon," and "weather" in Semantic network cluster 4.
The main themes in this subcluster were issues related to undermining science and its institutions, economics and rising temperatures. The analysis shows that there is a small range of words unique to misrepresentation (hoax, scientific models, believing, opinions), but in the main the vocabulary was strongly associated with the credibility subcluster. The implication is that authors of misleading material may be using the same concepts and vocabulary in an attempt to undermine their credibility and scientific validity.
Semantic network analysis
Using WordIJ, a semantic network analysis software (Danowski, 2013), we created a word link list for the description of the videos. The measures we used were words that appeared at least 25 times, at a window size for word pairs of 3. We used the software’s English stop word dictionary and extracted a list of the edges of the semantic network. Afterwards, we inserted the edges list to Gephi (Bastian, Heymann & Jacomy, 2009) and created the network, which contains 130 nodes. We used the modularity measure for clustering the network’s actors, and the size of the nodes indicates the betweenness centrality measure. The resulting network consists of 130 actors divided into four clusters representing distinct frameworks. The actors with the highest betweenness centrality scores in each cluster are: "world," "people," and "help" in Semantic network cluster 1; "news," "video," and "row" in Semantic network cluster 2; "new," "science," and "time" in Semantic network cluster 3; and "earth," "carbon," and "weather" in Semantic network cluster 4.
 Figure 14: portrays the network of the most frequent actors mentioned in the youtube climate change discourse, divided into four clusters.
Table 1: Centrality and clusters of words in the YouTube discourse around climate change and global warming.
Figure 14: portrays the network of the most frequent actors mentioned in the youtube climate change discourse, divided into four clusters.
Table 1: Centrality and clusters of words in the YouTube discourse around climate change and global warming.
| *Id* | *modularity_class (Semantic Clusters Numbers)* | *eigen_centrality* | *betweeness_centrality* |
| *news* | 2 | 0.821947 | 132572.9593 |
| *video* | 2 | 0.814197 | 81483.37988 |
| *row* | 2 | 0.77466 | 79885.40229 |
| *new* | 3 | 0.597272 | 46688.4608 |
| *science* | 3 | 0.651329 | 36788.27224 |
| *time* | 3 | 0.29441 | 11280.74634 |
| *earth* | 4 | 0.579893 | 41571.79539 |
| *carbon* | 4 | 0.341972 | 20842.89696 |
| *weather* | 4 | 0.462298 | 18886.83559 |
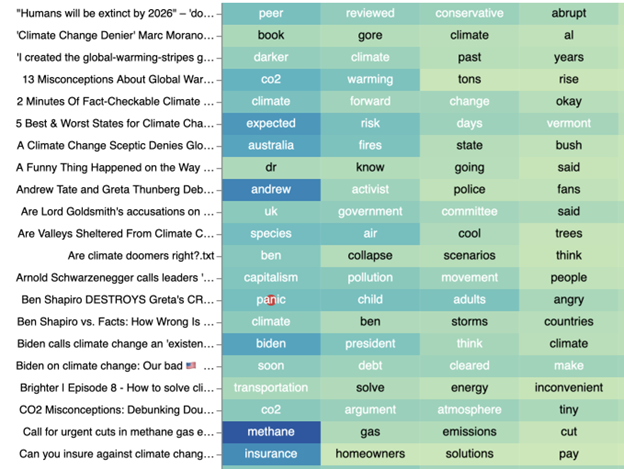
 As seen above, the words that score the highest tf-idf score across this random sample are very varied and mainly denote scientific vocabulary. This is true for most of the corpus. Our initial assumption that this cluster is the one with the most denialist content could be false. However, upon manual inspection, we can see that while there is some denialist content (approximately 35 videos or ~20% of the dataset) the vocabulary used to argue for such a position is similar to the vocabulary used by those that seek to educate and debunk common myths around the climate crisis. While no precise taxonomy exists, common strategies include calling out supposed hypocrisy.
PixPlot Image clusters
For the visual clustering we used PixPlot - a Deep learning tool that aims to clutter images by their visual similarities and commonality[5]. The visualisation is powered by WbGL, and consists of a two-dimensional map of images clustered based on their visual similarities.
We downloaded the images for the 5 related video clusters analysed (893 images in total). Images were accompanied by metadata including video id, category, and their original cluster number. PixPlot ’s analysis results in creation of Umap of images, clustering them according to their visual properties such as colours, style, and recognised objects. The addition of the metadata allows for sorting images by their original related video clusters and investigating the categorisation per group. The original clusters based on the youtube related videos will be compared to the visual clusters in PixPlot, to determine if there is correlation and cluster agreement, and to seek visual patterns that might be meaningful.
Overall structure and patterns:
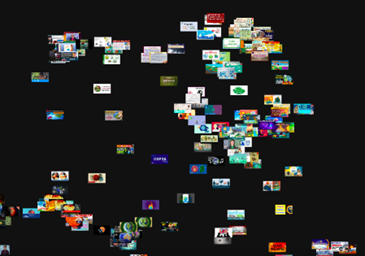
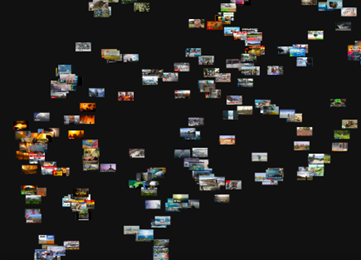
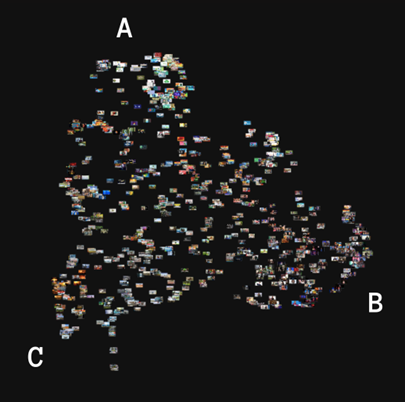
Running the analysis through PixPlot resulted in a triangle shaped map of images (Fig 15,16,17). Each vertex is a point of concentration of images, with a more-or-less even distribution of images in the centre. Most clusters detected by PixPlot are located in those vertices, with overlapping occurrences in the centre and on the edges.
PixPlot detected ten clusters, whose names and characteristics can be consulted below, and distributed them thematically or visually among main points of concentration. Overall, the map can be divided into three main topic areas, more related to the visual templates than to specific perspectives. They are: (i) graphics and infographics, (ii) images with people, and (iii) images of nature:
As seen above, the words that score the highest tf-idf score across this random sample are very varied and mainly denote scientific vocabulary. This is true for most of the corpus. Our initial assumption that this cluster is the one with the most denialist content could be false. However, upon manual inspection, we can see that while there is some denialist content (approximately 35 videos or ~20% of the dataset) the vocabulary used to argue for such a position is similar to the vocabulary used by those that seek to educate and debunk common myths around the climate crisis. While no precise taxonomy exists, common strategies include calling out supposed hypocrisy.
PixPlot Image clusters
For the visual clustering we used PixPlot - a Deep learning tool that aims to clutter images by their visual similarities and commonality[5]. The visualisation is powered by WbGL, and consists of a two-dimensional map of images clustered based on their visual similarities.
We downloaded the images for the 5 related video clusters analysed (893 images in total). Images were accompanied by metadata including video id, category, and their original cluster number. PixPlot ’s analysis results in creation of Umap of images, clustering them according to their visual properties such as colours, style, and recognised objects. The addition of the metadata allows for sorting images by their original related video clusters and investigating the categorisation per group. The original clusters based on the youtube related videos will be compared to the visual clusters in PixPlot, to determine if there is correlation and cluster agreement, and to seek visual patterns that might be meaningful.
Overall structure and patterns:
Running the analysis through PixPlot resulted in a triangle shaped map of images (Fig 15,16,17). Each vertex is a point of concentration of images, with a more-or-less even distribution of images in the centre. Most clusters detected by PixPlot are located in those vertices, with overlapping occurrences in the centre and on the edges.
PixPlot detected ten clusters, whose names and characteristics can be consulted below, and distributed them thematically or visually among main points of concentration. Overall, the map can be divided into three main topic areas, more related to the visual templates than to specific perspectives. They are: (i) graphics and infographics, (ii) images with people, and (iii) images of nature:
- Vertex A (upper) consists of drawings, graphics and infographics. There are almost no occurrences involving people. The style varies, with childish-like drawings in the top, and more professional towards the centre. The clusters there are 1, 4, 7, and 10.
- Vertex B (right) is the only one that includes images of people - clusters 5 and 6. Mixed clusters are located further away from the peak, for example, clusters 2 and 10, which are combining humans and graphics are on the right edge, and Public Discussion cluster is towards the centre.
- Vertex C (left) concentrates on landscapes, nature, and natural disasters. There are no people present. Many images are coming from news channels and National Geographic. Images from news videos are located toward the centre. The dominant clusters are 1, 8, and 9.

 Cluster agreement:
To compare the agreement between input related video clusters, the number of images assigned to different clusters by PixPlot (below) was counted. It can be seen that all the initial clusters seem to be highly diverse, and include images assigned to all visual clusters.
Cluster agreement:
To compare the agreement between input related video clusters, the number of images assigned to different clusters by PixPlot (below) was counted. It can be seen that all the initial clusters seem to be highly diverse, and include images assigned to all visual clusters.
| Related videos cluster no.: | PixPlot Cluster 1 | PixPlot Cluster 2 | PixPlot Cluster 3 | PixPlot Cluster 4 | PixPlot Cluster 5 | PixPlot Cluster 6 | PixPlot Cluster 7 | PixPlot Cluster 8 | PixPlot Cluster 9 | PixPlot Cluster 10 | No cluster assigned | Total in Related videos cluster |
| Cluster 1 | 9 | 9 | 10 | 34 | 5 | 10 | 18 | 7 | 7 | 14 | 14 | 137 |
| Cluster 2 | 41 | 14 | 24 | 13 | 14 | 17 | 16 | 33 | 15 | 6 | 37 | 230 |
| Cluster 3 | 22 | 32 | 29 | 6 | 28 | 17 | 14 | 11 | 6 | 3 | 9 | 177 |
| Cluster 4 | 36 | 14 | 24 | 17 | 25 | 28 | 14 | 7 | 8 | 8 | 15 | 196 |
| Cluster 5 | 6 | 6 | 3 | 4 | 8 | 0 | 3 | 3 | 4 | 1 | 5 | 43 |
| Cluster 6 | 7 | 28 | 6 | 17 | 1 | 3 | 6 | 1 | 17 | 18 | 6 | 110 |
| Total in PixPlot Cluster | 121 | 103 | 96 | 91 | 81 | 75 | 71 | 62 | 57 | 50 | 86 |
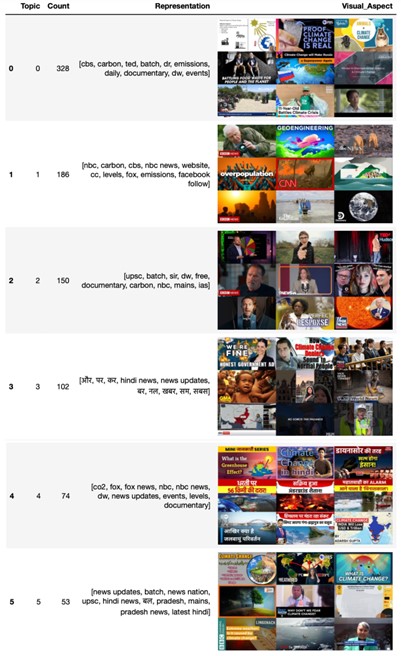
- Topic 0: The first and largest returned cluster contains N = 328 videos, the video descriptions focus mainly on the cause and solutions of climate change and the video thumbnails often contain texts in a large font size with astonishing expressions such as "climate doom", "3 weird climate change solutions" to catch the audiences' attention.
- Topic 1: The second cluster consists of N = 186 videos, the video descriptions are mainly introducing climate change and convey "hard" facts about the issue, while the video thumbnails feature a variety of landscapes and animals.
- Topic 2: The third cluster includes N = 150 videos, the descriptions often talk about the influence of climate change and the thumbnails often showcase a person in the middle reporting the issues.
- Topic 3: The fourth cluster contains N = 102 videos, addressing mainly India-related climate change news. Interestingly, although most of the video descriptions are in Hindi, the language on the video thumbnails is still English.
- Topic 4: The fifth cluster is another Indian cluster, containing N = 74 videos. The video descriptions suggest this cluster mainly includes news updates on climate change in India and the language on most of the video thumbnails in this cluster is Hindi.
- Topic 5: The last cluster represents international climate change news, which includes N = 53 videos. The video descriptions contain a diverse range of languages and the video thumbnails also reflect a mixture of landscape, human reporter, and texts.
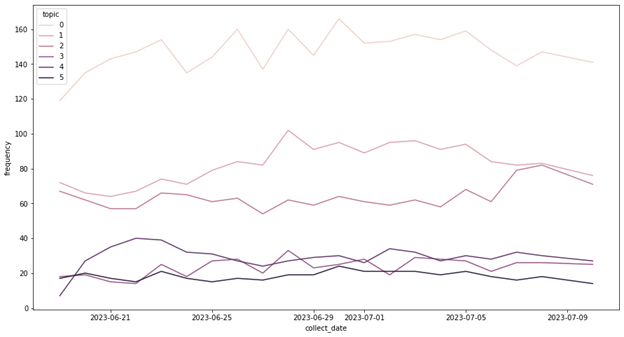
 When it comes to the temporal change of the topics within the data collection period.
Dynamic topic modelling was carried out with BERTopic to reflect content change within each cluster over the data collection period. The change in the number of videos under each cluster over time was also plotted and analysed.
One particular example is topic 3, the influence of climate change. An increase in the number of collected videos was observed since 7th July, likely due to the hottest day in the world on 4th July, and "heatwaves" became the keyword of the cluster for the first time on 9th July (see Figure 5).
Figure 19: The distribution of the number of topics over the data collection period
When it comes to the temporal change of the topics within the data collection period.
Dynamic topic modelling was carried out with BERTopic to reflect content change within each cluster over the data collection period. The change in the number of videos under each cluster over time was also plotted and analysed.
One particular example is topic 3, the influence of climate change. An increase in the number of collected videos was observed since 7th July, likely due to the hottest day in the world on 4th July, and "heatwaves" became the keyword of the cluster for the first time on 9th July (see Figure 5).
Figure 19: The distribution of the number of topics over the data collection period
 Regarding the distribution of the topics across the original related videos network clusters, no complete overlap has been found. However, certain relationships do exhibit between the topics and network clusters. For example, 39% of topic 4, the topic addresses Indian climate news, goes to the (not interpreted) related videos network cluster 6. For topic 3, the first related videos network cluster (Pop-science) is the cluster that incorporates most of its content (24%), and interestingly, cluster 1 also reflects an increase in the number of videos collected around 7th of July.
Table 6: The distribution of the network clusters within each topic, distributions that are higher than average (16.67%) are bolded
Regarding the distribution of the topics across the original related videos network clusters, no complete overlap has been found. However, certain relationships do exhibit between the topics and network clusters. For example, 39% of topic 4, the topic addresses Indian climate news, goes to the (not interpreted) related videos network cluster 6. For topic 3, the first related videos network cluster (Pop-science) is the cluster that incorporates most of its content (24%), and interestingly, cluster 1 also reflects an increase in the number of videos collected around 7th of July.
Table 6: The distribution of the network clusters within each topic, distributions that are higher than average (16.67%) are bolded
| topic | Related videos network clusters | distribution |
| 0 | Cluster2 | 35% |
| Cluster4 | 21% | |
| Cluster3 | 18% | |
| Cluster1 | 16% | |
| Cluster6 | 6% | |
| Cluster5 | 5% | |
| 1 | Cluster2 | 29% |
| Cluster3 | 19% | |
| Cluster4 | 19% | |
| Cluster1 | 19% | |
| Cluster6 | 8% | |
| Cluster5 | 7% | |
| 2 | Cluster1 | 24% |
| Cluster2 | 22% | |
| Cluster3 | 18% | |
| Cluster4 | 18% | |
| Cluster6 | 10% | |
| Cluster5 | 7% | |
| 3 | Cluster6 | 39% |
| Cluster2 | 21% | |
| Cluster1 | 16% | |
| Cluster3 | 13% | |
| Cluster4 | 12% | |
| Cluster5 | 0% | |
| 4 | Cluster3 | 33% |
| Cluster2 | 30% | |
| Cluster1 | 14% | |
| Cluster4 | 10% | |
| Cluster5 | 7% | |
| Cluster6 | 7% | |
| 5 | Cluster2 | 28% |
| Cluster1 | 26% | |
| Cluster6 | 25% | |
| Cluster3 | 13% | |
| Cluster4 | 6% |
- Scientific facts and Scientific foundations of global warming.
- Consequences in daily live and planet
- Renewable energy and sustainability (2)
- Impact on wildlife and biodiversity (2)
- Frequency and intensity of extreme weather events (2)
- International agreements, domestic policies, government and political systems addressing global challenges.
- Debunk common myths and misconceptions about climate change by presenting scientific research, separating truth and fiction. (2)
- Impact on global health (or human health), from infectious diseases to mental health (2)
- Sustainable development and green economy (2)
- Solutions to combat global warming, actionable steps for individuals, communities and governments (or associated with renewable energy). (2)
- Impact on the Artic and the Antarctic regions (polar environments).
- Role of governments and political systems, from international cooperation to the implementation of the Paris agreement.
[1] A reference to Paul Watzlawick’s foreword of The Invented Reality: How Do We Know What We Believe We Know? (Contributions to Constructivism). W. W. Norton & Company. New York and London, 1984.
[2] The 6th cluster brought many educational videos, some of the ones receiving most related video connections presenting thumbnails in hindi or dealing with the impact of climate change in India. For this report, considering our team clustering techniques and interpretative resources, we chose not to deal with this cluster during the data sprint.
[3] We analysed the content of 327 videos from Public Discussion cluster and classified them regarding the absence or presence of non-flagged false information on climate science issues. This binary categorization considers (only and entirely) the video content, not the source, and it aims to separate the fair public debate on science issues from the potential disinformation content. Mainstream media videos that show third part objectively false statements without pointing as it are classified as disinformation content.
[4] Developed at the LERASS (Laboratoire d’Études et de Recherches Appliquées en Sciences Sociales), l’Université de Toulouse 3 – Paul Sabatier.
[5] “PixPlot uses the penultimate layer of a pre-trained convolutional neural network for image captioning to derive a robust featurization space in 2,048 dimensions” (DHLab, n.d.).
[6] air pollution, biodiversity, carbon reduction, clean technology, climate change, climate change economics, climate change explained, climate change facts, climate change impacts, climate change myths, climate change solutions, climate effects, climate science, cost-benefit analysis, daily life, debunking misinformation, disease outbreaks, droughts, endangered species, energy transition, environmental activism, environmental awareness, environmental science, extreme weather, floods, global warming, government action, green economy, habitat loss, heatwaves, hurricanes, international agreements, mental health, policy, politics, public health, renewable energy, science communication, sustainability, sustainable development, sustainable future, sustainable living, wildlife conservation.
[7] air pollution, Antarctica, Arctic, biodiversity loss, carbon footprint reduction, clean technology, climate action, climate change, climate change impacts, climate change misinformation, climate policies, climate science, cost of inaction, ecosystems, energy transition, extreme weather, floods, global warming, global warming economics, global warming effects, global warming facts, global warming myths, global warming solutions, green economy, greenhouse gases, habitat destruction, heatwaves, human health, hurricanes, infectious diseases, international cooperation, melting ice caps, Paris Agreement, polar ecosystems, politics, renewable energy, species extinction, sustainable development, sustainable future, sustainable living, temperature rise.
Conclusions
Right category, preferential tag,- How does the network built by YouTube ’s related videos algorithm vary on a daily basis for the query ‘Climate Change or Global Warming’? Does its search ranking and related videos centrality favour specific clusters of videos found through network clustering techniques? How does it vary on a daily basis?
- How could we compare different clustering techniques (based on related videos, video descriptions, subtitles, video image thumbnails and engagement metrics) to better understand possible biases in algorithmic decisions involving clusters of videos (instead of considering them individually)? Do the diverse clustering techniques converge in their clustering of similar contents?
- Could we connect changes in the algorithm decisions with global events happening when the changes occurred?
- Will AI generated content (both visual and written) match one of the clusters from the recommended YouTube videos about “Climate Change or Global Warming”? If so, will the generated content fit in clusters well ranked in search results and centrality when it comes to search results and related videos?
References
Grootendorst, M. (2022). BERTopic: Neural topic modeling with a class-based TF-IDF procedure (arXiv:2203.05794). arXiv. https://doi.org/10.48550/arXiv.2203.05794 Radford, A., Kim, J. W., Hallacy, C., Ramesh, A., Goh, G., Agarwal, S., Sastry, G., Askell, A., Mishkin, P., Clark, J., Krueger, G., & Sutskever, I. (2021). Learning Transferable Visual Models From Natural Language Supervision. Proceedings of the 38th International Conference on Machine Learning, 8748–8763. https://proceedings.mlr.press/v139/radford21a.html Reimers, N., & Gurevych, I. (2019). Sentence-BERT: Sentence Embeddings using Siamese BERT-Networks (arXiv:1908.10084). arXiv. https://doi.org/10.48550/arXiv.1908.10084 Brady, W. J., Crockett, M. J., and van Bavel, J. J. 2020. The MAD Model of Moral Contagion: The Role of Motivation, Attention, and Design in the Spread of Moralized Content Online, Perspectives on Psychological Science 2020, Vol. 15(4) 978-1010. DOI: 10.1177/1745691620917336. Lenhart, A., Ybarra, M. L., Zickuhr, K., and Price-Feeney, M. (2016). Online harassment, digital abuse, and cyberstalking in America. Data & Society Research Institute. Lewis, R. and Alice E. Marwick and William Clyde Partin, “We Dissect Stupidity and Respond to It”: Response Videos and Networked Harassment on YouTube, American Behavioral Scientist, 2020, Volume 65, 735-756. Marwick, A. E. and Caplan, R. (2018). Drinking male tears: language, the manosphere, and networked harassment, Feminist Media Studies, 18:4, 543-559, DOI: 10.1080/14680777.2018.1450568. Marwick, A. and danah boyd. 2014. ‘It’s just drama’: Teen perspectives on conflict and aggression in a networked era. Journal of Youth Studies 17, 9 (Oct. 2014), 1187–1204. https://doi.org/10.1080/13676261.2014.901493. Marwick, A. E. 2021. Morally motivated networked harassment as normative reinforcement, Social Media + Society, April 2021, https://journals.sagepub.com/doi/full/10.1177/20563051211021378. DHLab Yale. (n.d.) Projects, PixPlot. Retrieved July 14th, 2023, from https://dhlab.yale.edu/projects/pixplot/<pre style="word-wrap: break-word; white-space: pre-wrap;">OK: img2.png uploaded</pre>


Edit | Attach | Print version | History: r2 < r1 | Backlinks | View wiki text | Edit wiki text | More topic actions
Topic revision: r2 - 12 Sep 2023, HelenaMovchan
Ideas, requests, problems regarding Foswiki? Send feedback