Data Witnessing: Decoding Amnesty International’s Urgent Actions Archive
Update: More about "data witnessing" can be found in the following open access article which draws on this project: Gray, J. (2019). Data witnessing: attending to injustice with data in Amnesty International’s Decoders project. Information, Communication & Society. 1–21.Team Members
The following research and designs were undertaken as a collaboration between the Digital Methods Initiative, Density Design and Amnesty International at the Digital Methods Summer School 2016. The research team included: Jonathan Gray (facilitator), Olga Boichak, Agata Brilli, Claudia Minchilli, Coral Negrón, Mariasilvia Poltronieri, Chiara Riente, Gülüm Şener and Paola Verhaert. Thanks also to Liliana Bounegru, Ben Fogarty, Milena Marin and Richard Rogers. The slides for the final presentation are available here.Introduction
The Urgent Actions Database as Witnessing Device

Amnesty International grew out of from a “world campaign” called “Appeal for Amnesty” which was launched in 1961 by British lawyer Peter Benenson (Buchanan, 2002). A full page newspaper article about the campaign described the motivation behind the campaign as follows:
Noting the dearth of official statistics about these abuses, collecting information became a central part of the campaign which included establishing an office in London “to collect and publish information about Prisoners of Conscience all over the world” (Benenson, 1961).
These practices of collecting information about abuses may be understood both as a form of “witnessing” (Peters, 2001), as well as a form of “statactivism” (Bruno, Didier, & Vitale, 2014) which prefigures contemporary forms of “proactive” data activism – including projects to collect data as a means to render institutions sensitive to different issues and concerns in society (Gray, Lämmerhirt, & Bounegru, 2016). In March 1973, Amnesty International launched their Urgent Actions in order to mobilise a rapid response from their networks of volunteers by writing appeals to authorities in situations where there is a risk of abuse. Initially focusing on sending letters and faxes, these Urgent Actions were also undertaken online from 1987 (Willetts, 2010). In June 2016 Amnesty launched their Amnesty Decoders project, dedicated to creating a network of “hundreds of digital volunteers helping us expose human rights violations, one click at a time” (Amnesty International, 2016). Their first project was a crowdsourcing project to analyse a digitised collection of tens of thousands of Urgent Action documents in order to “understand when and where [Amnesty’s] campaigning has been most effective”.Decoding and Recoding the Urgent Actions Database
The Amnesty Decoders crowdsourcing project was developed as a collaboration between the Amnesty International; two NGOs: Open Data Kosovo and the Engine Room; the startup incubator Focal Labs; with funding from the Swedish Postcode Lottery. It grew out of an interest in harnessing the “collective wisdom of crowds to shed light on and respond to human rights abuses” (Marin, 2015).
The project presented users with a digital copy of an Urgent Action document and asked users to answer questions about them, including how many people were subjected to abuse, the names and genders of those affected, and whether the outcome of the action was “positive”, “negative”, “mixed” or “not clear”.
There have been tens of thousands of Urgent Actions issued by Amnesty International. The Urgent Action documents selected were from a collection of 2,800 “stop actions”, which are the final action documents sent out - usually giving the outcome of the campaign (such as whether the prisoner was released or executed). These documents were loaded into a website created using the open source Pybossa framework.
We analysed databases from the Amnesty Decoders project in order to understand how digital volunteers engaged with the crowdsourcing project over a twenty four day period (from the “soft launch” on 7th June to 30th June 2016), as well as looking at trends in the stop actions data from 1980 to 2016.
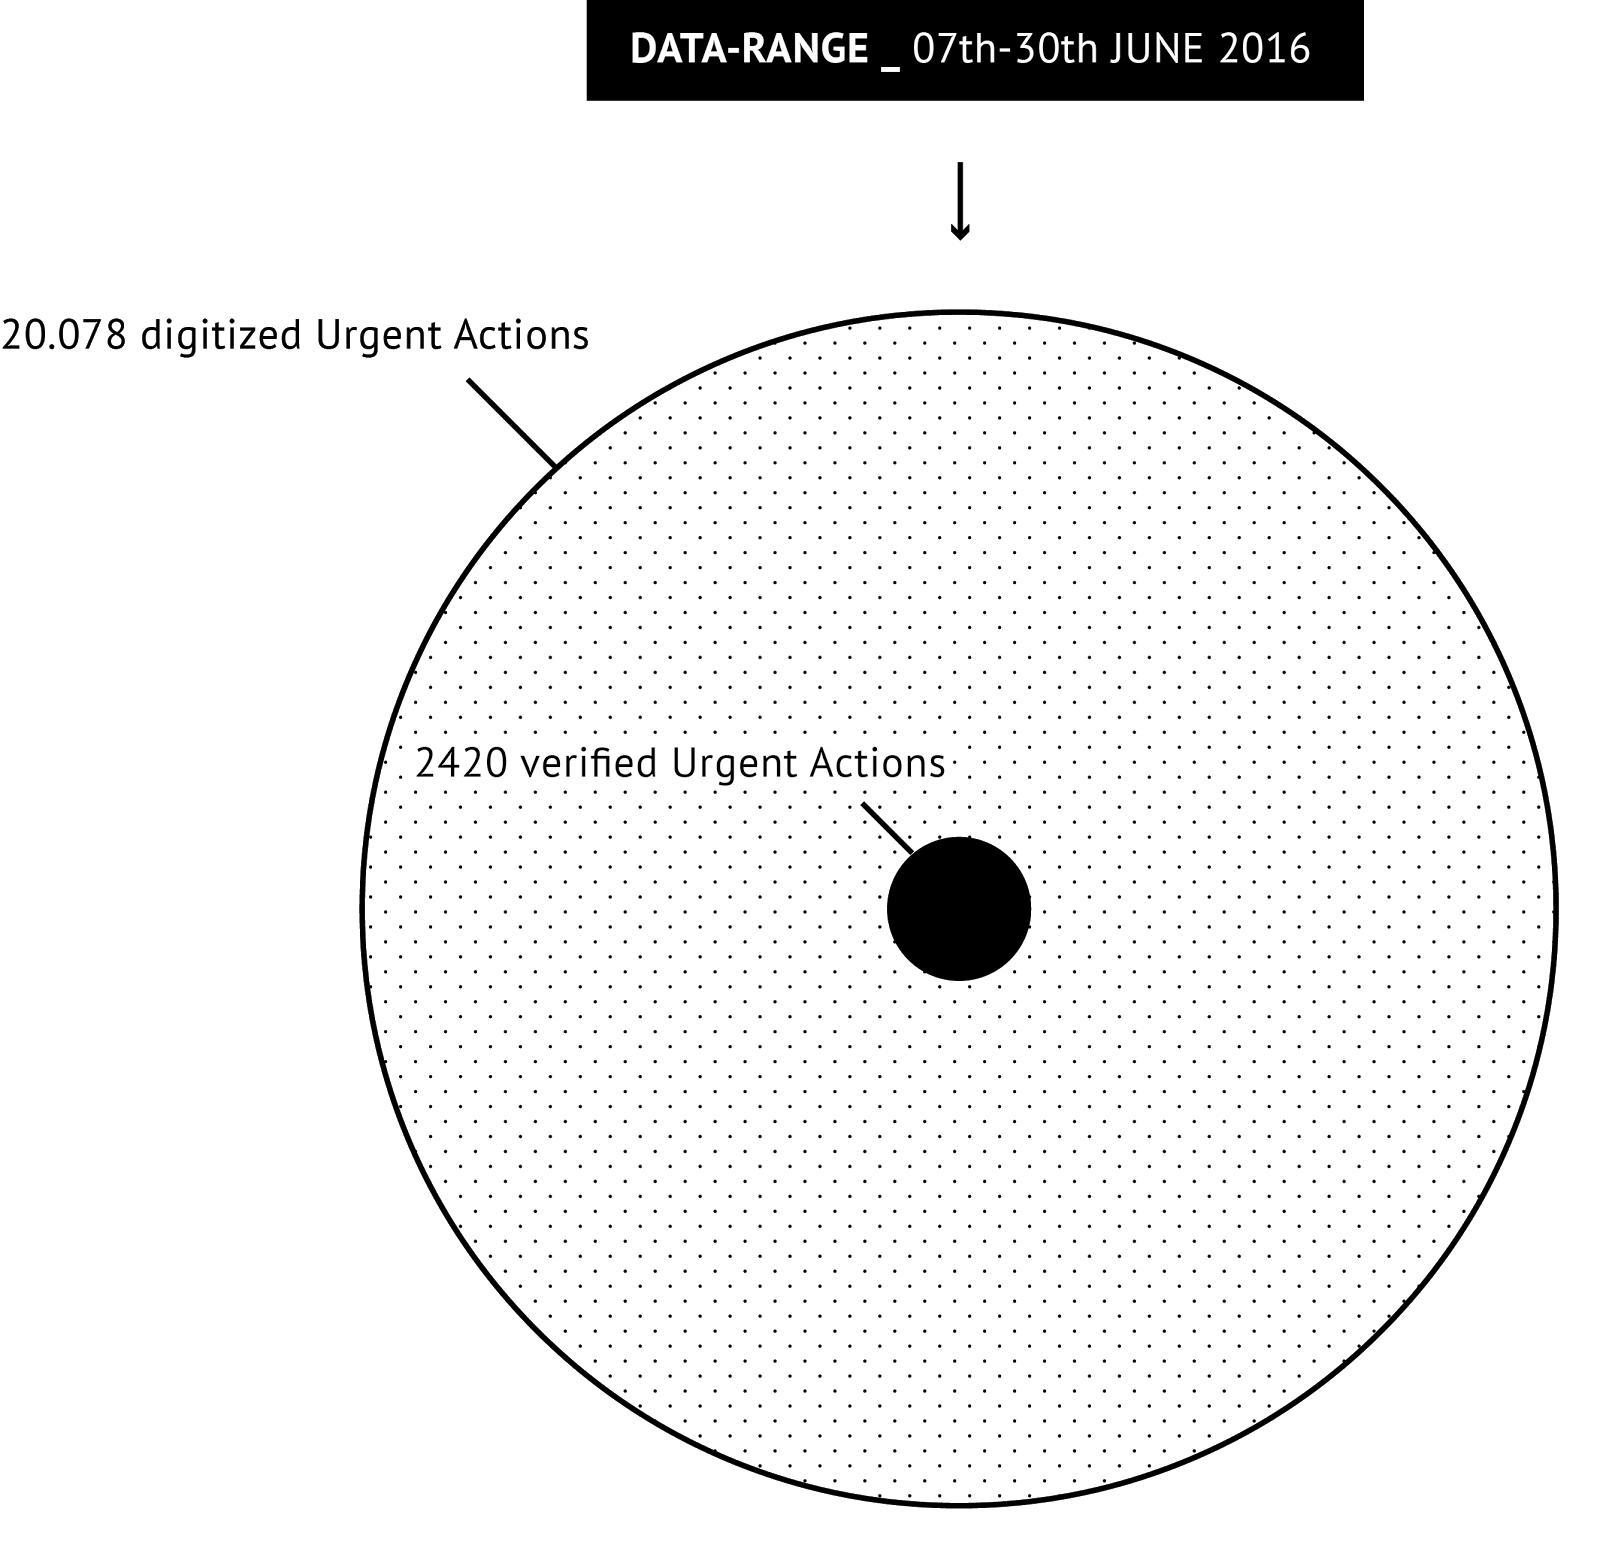
What proportion of the digitised Urgent Actions were verified?
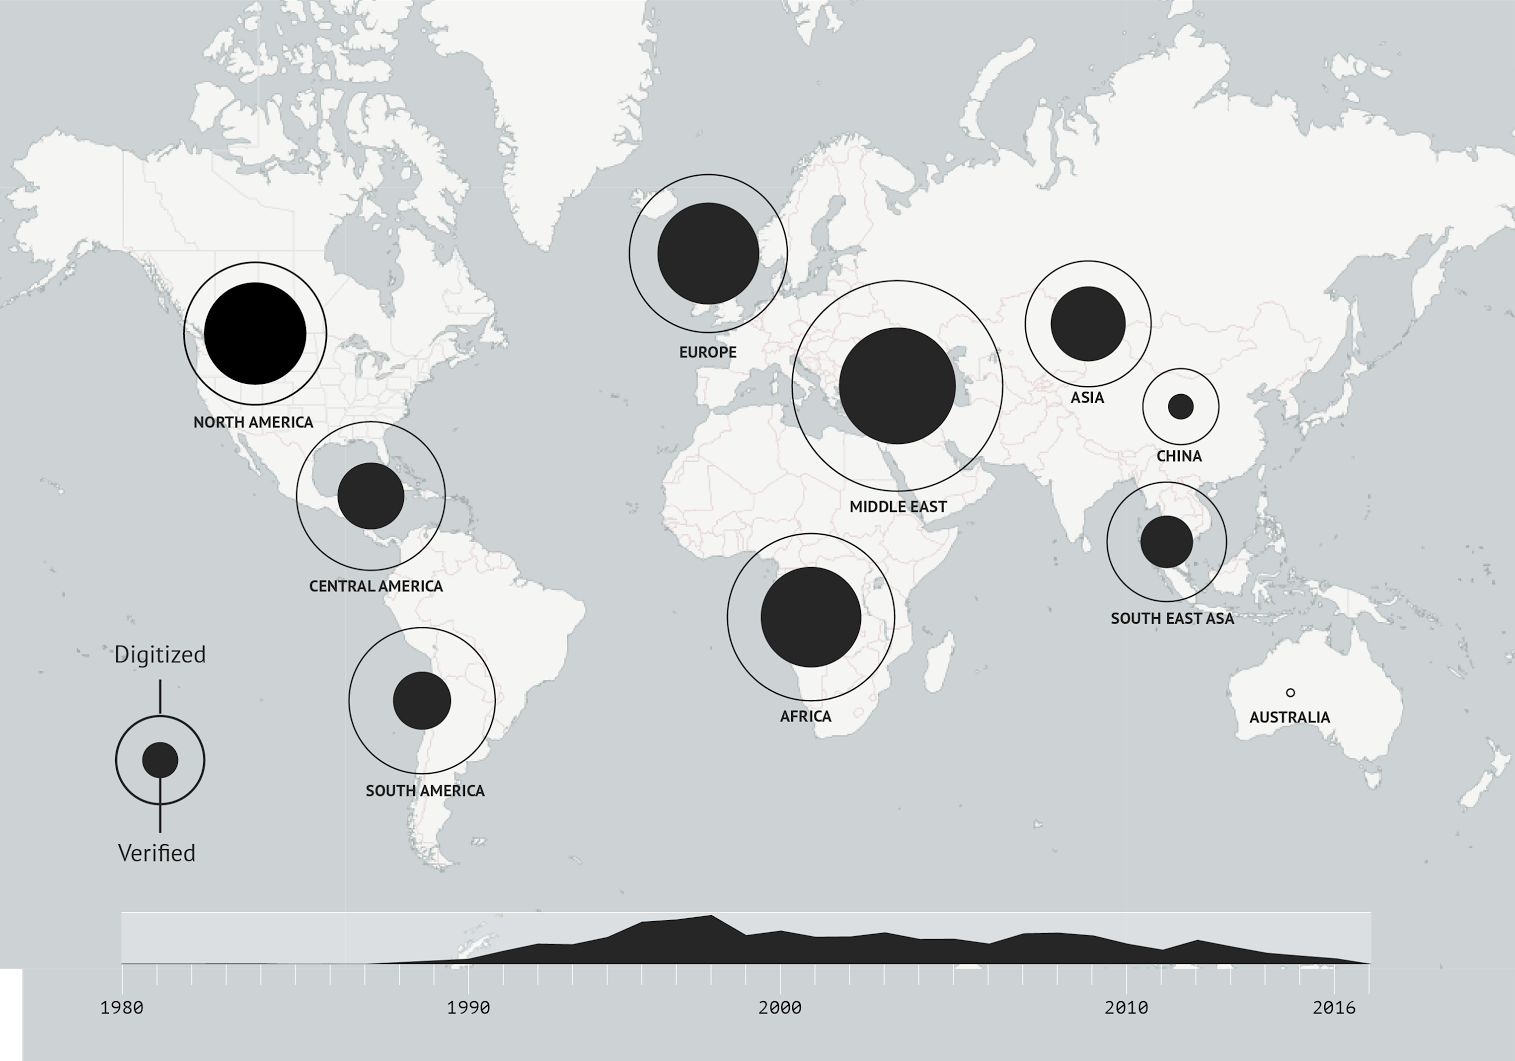
In order to better understand the data that we had from Amnesty International, we first checked how the total number of verified Urgent Actions that we had compared to the total number of digitised Urgent Actions. We had verified data for 2,420 Urgent Actions out of 20,078 digitised Urgent Actions, as shown in the following chart: We then examined the total number of verified documents as a proportion of the total number of digitised documents by country, and over time:
 Overall, the verified actions represent a comparatively small subsection of all of the Urgent Actions that have been digitised by Amnesty International which was important to bear in mind when analysing the database.
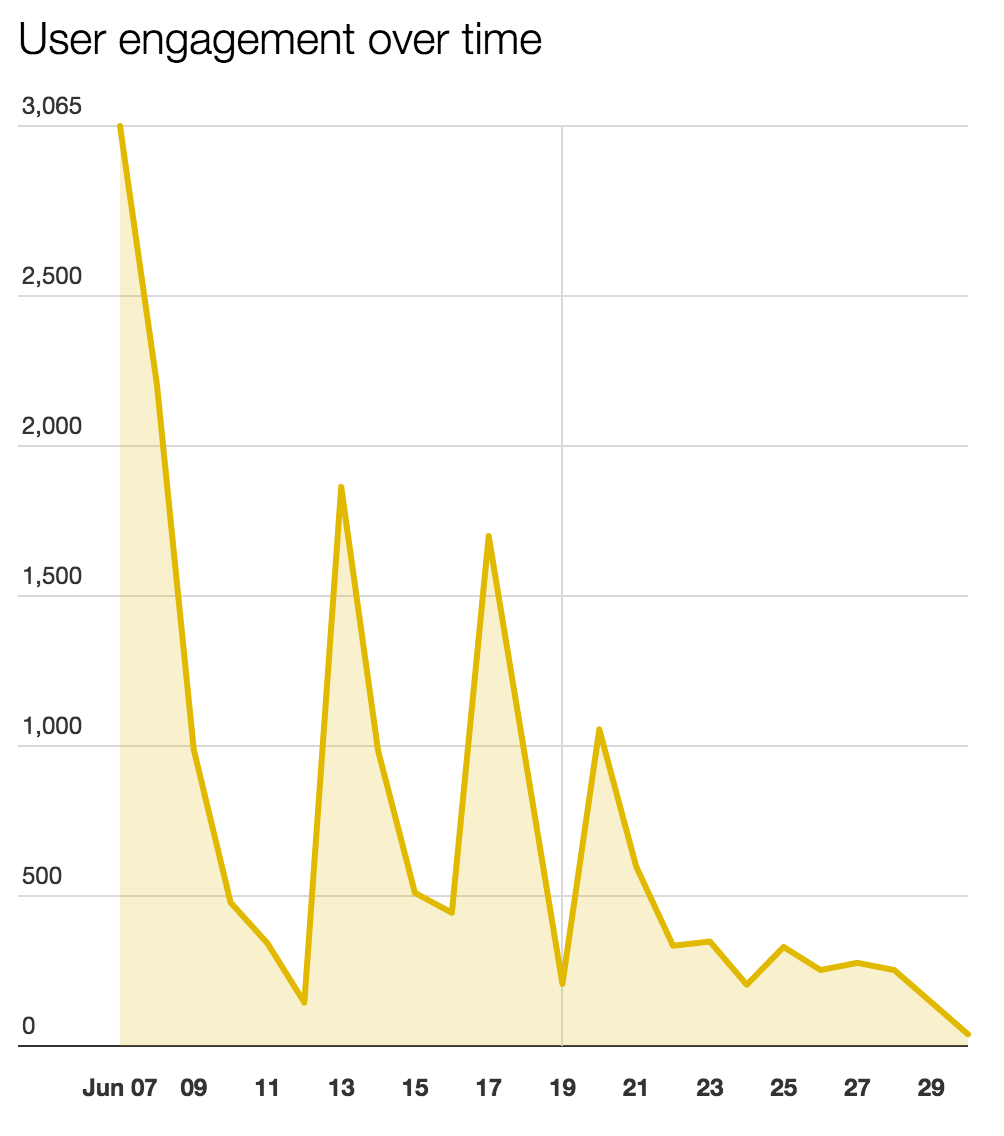
How did users engage with the crowdsourcing project?
In order to understand user engagement around the Amnesty Decoders project, we looked at analytics data provided by Amnesty International and found that there were four clear engagement peaks, which we found corresponded with the following events:- On the 7th June 2016 the project was launched, and this corresponded with the highest volume of visits. Messages were sent to all Amnesty volunteers including instructions on how to participate.
- On the 13th June 2016 an online bulletin was sent to the youth activist network announcing the recently launched project and encouraged participation.
- On the 17th June 2016 Amnesty sent a reminder email to international supporters who didn't open it the first time.
- On the 20th June 2016 Amnesty sent a reminder to supporters who already took action, expressing thanks, giving an overview of how many people had already contributed and how many hours in total were spent analysing the data.
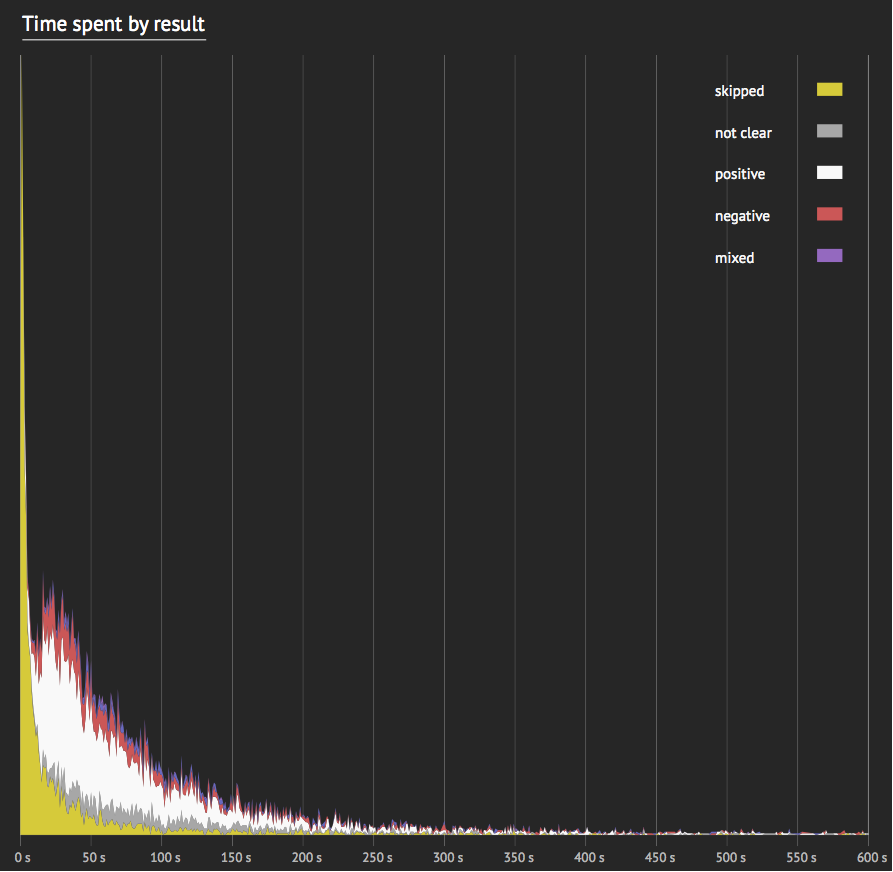
 Analysing amount of time spent by users on the site, we found that a significant proportion of people who spent less than 10 seconds on the site skipped to the next result, perhaps to explore and read the entries, rather than immediately participating in the crowdsourcing activity. After 20 seconds, the proportion of skipped actions dropped off sharply, as can be seen in the following graph:
 From user data we also found that around 26% of transactions were from users who had registered and logged in (4626 out of 17732 transactions). Of those users who were logged in, we found that:
 - There was 1 logged in user who had made 500 contributions;
- There were 12 logged in users who had made more than 100 contributions;
- There were 23 logged in users who had made more than 50 contributions;
- There were 55 logged in users who had made more than 20 contributions;
- There were 98 logged in users who had made more than 10 contributions;
- There were 166 logged in users who had made more than 5 contributions;
- There were 140 logged in users who had made less than 5 contributions.
Geography of Urgent Actions
Since the creation of Amnesty International, the organisation has kept its central focus on the rights of the detained across the continents; even the first cases to draw the attention of the founding members were not confined to one continent (Buchanan, 2002). Ever since, Amnesty International has been organising campaigns, and from 1973 on, Urgent Actions, without taking into account the nationality of victims. The methods of action Amnesty International adopted from its creation on, allowed the organisation to adopt a pioneering role in the seizing of sovereignty by the international human rights network (Keck and Sikkink, 1998), and the creation of transnationally organised interest groups in civil society who sought to redefine what is essentially within the domestic jurisdiction of states through the propelling of the international human rights issue (Sikkink, 1993). Using the data sample from the Urgent Actions, we were able to map out the Urgent Action cases geographically, and analyse regional trends. We started with some exploratory data visualisations in Carto DB looking at:- Violations by country over time.
- Categories of violations per country.
- Proportion of positive and negative outcomes per country.

We found that the region with most cases in the data sample is the Middle East with 1,409 cases, followed by Africa (1046 cases) and Europe (977 cases).
Regions with most cases in the verified Urgent Actions database
- Middle East (1409 cases)
- Africa (1046 cases)
- Europe (977 cases)
- U.S. (955 cases)
- Asia (486 cases)
The United States is counted as a continent, because of the large amount of cases (955). As with Turkey, the country is analysed further below.
Asia is the continent with the fifth largest amount of Urgent Actions, but has almost half of the amount of cases than the U.S. with only 486 cases. The country with most cases in Asia is by far Nepal (159 cases). Generally, the countries with most cases in the data sample are the U.S., Turkey, Iran, Sudan, and Mexico. The United States, as well as Turkey, are analysed in detail below in their respective country profiles. Iran and Mexico, are further analysed below.Countries with most cases in the verified Urgent Actions database
- United States (955 cases)
- Turkey (486 cases)
- Iran (322 cases)
- Sudan (224 cases)
- Mexico (200 cases)

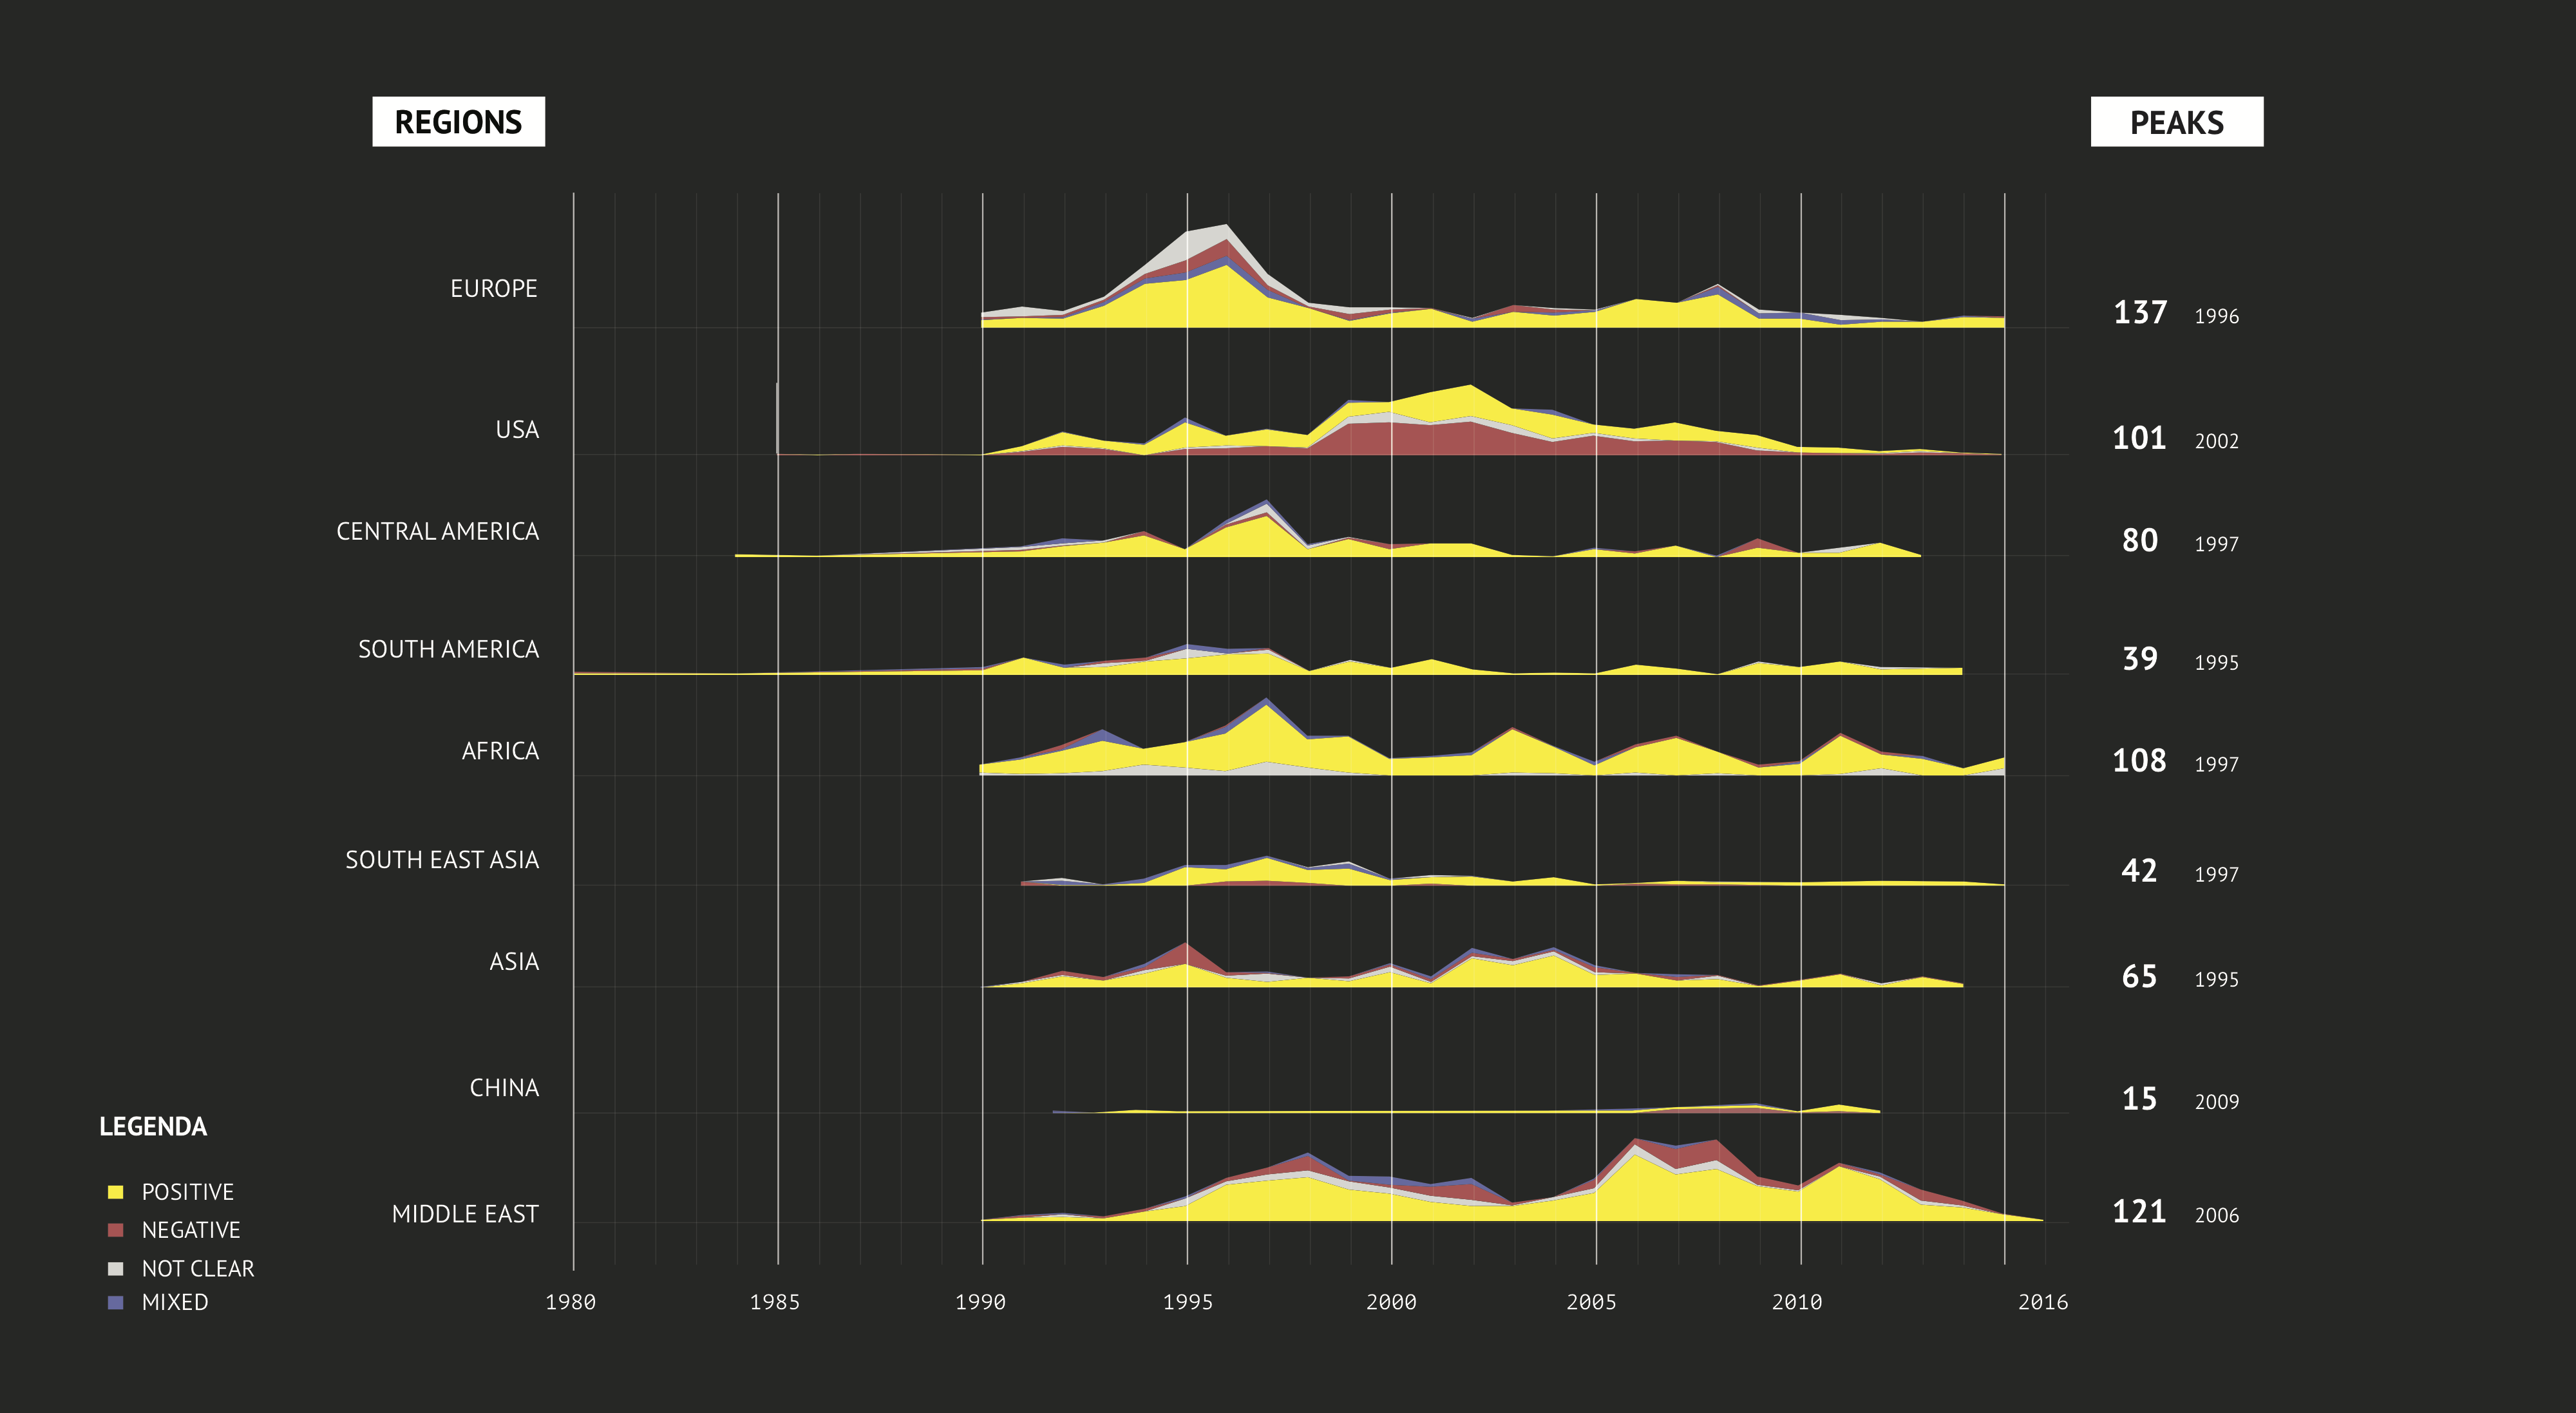
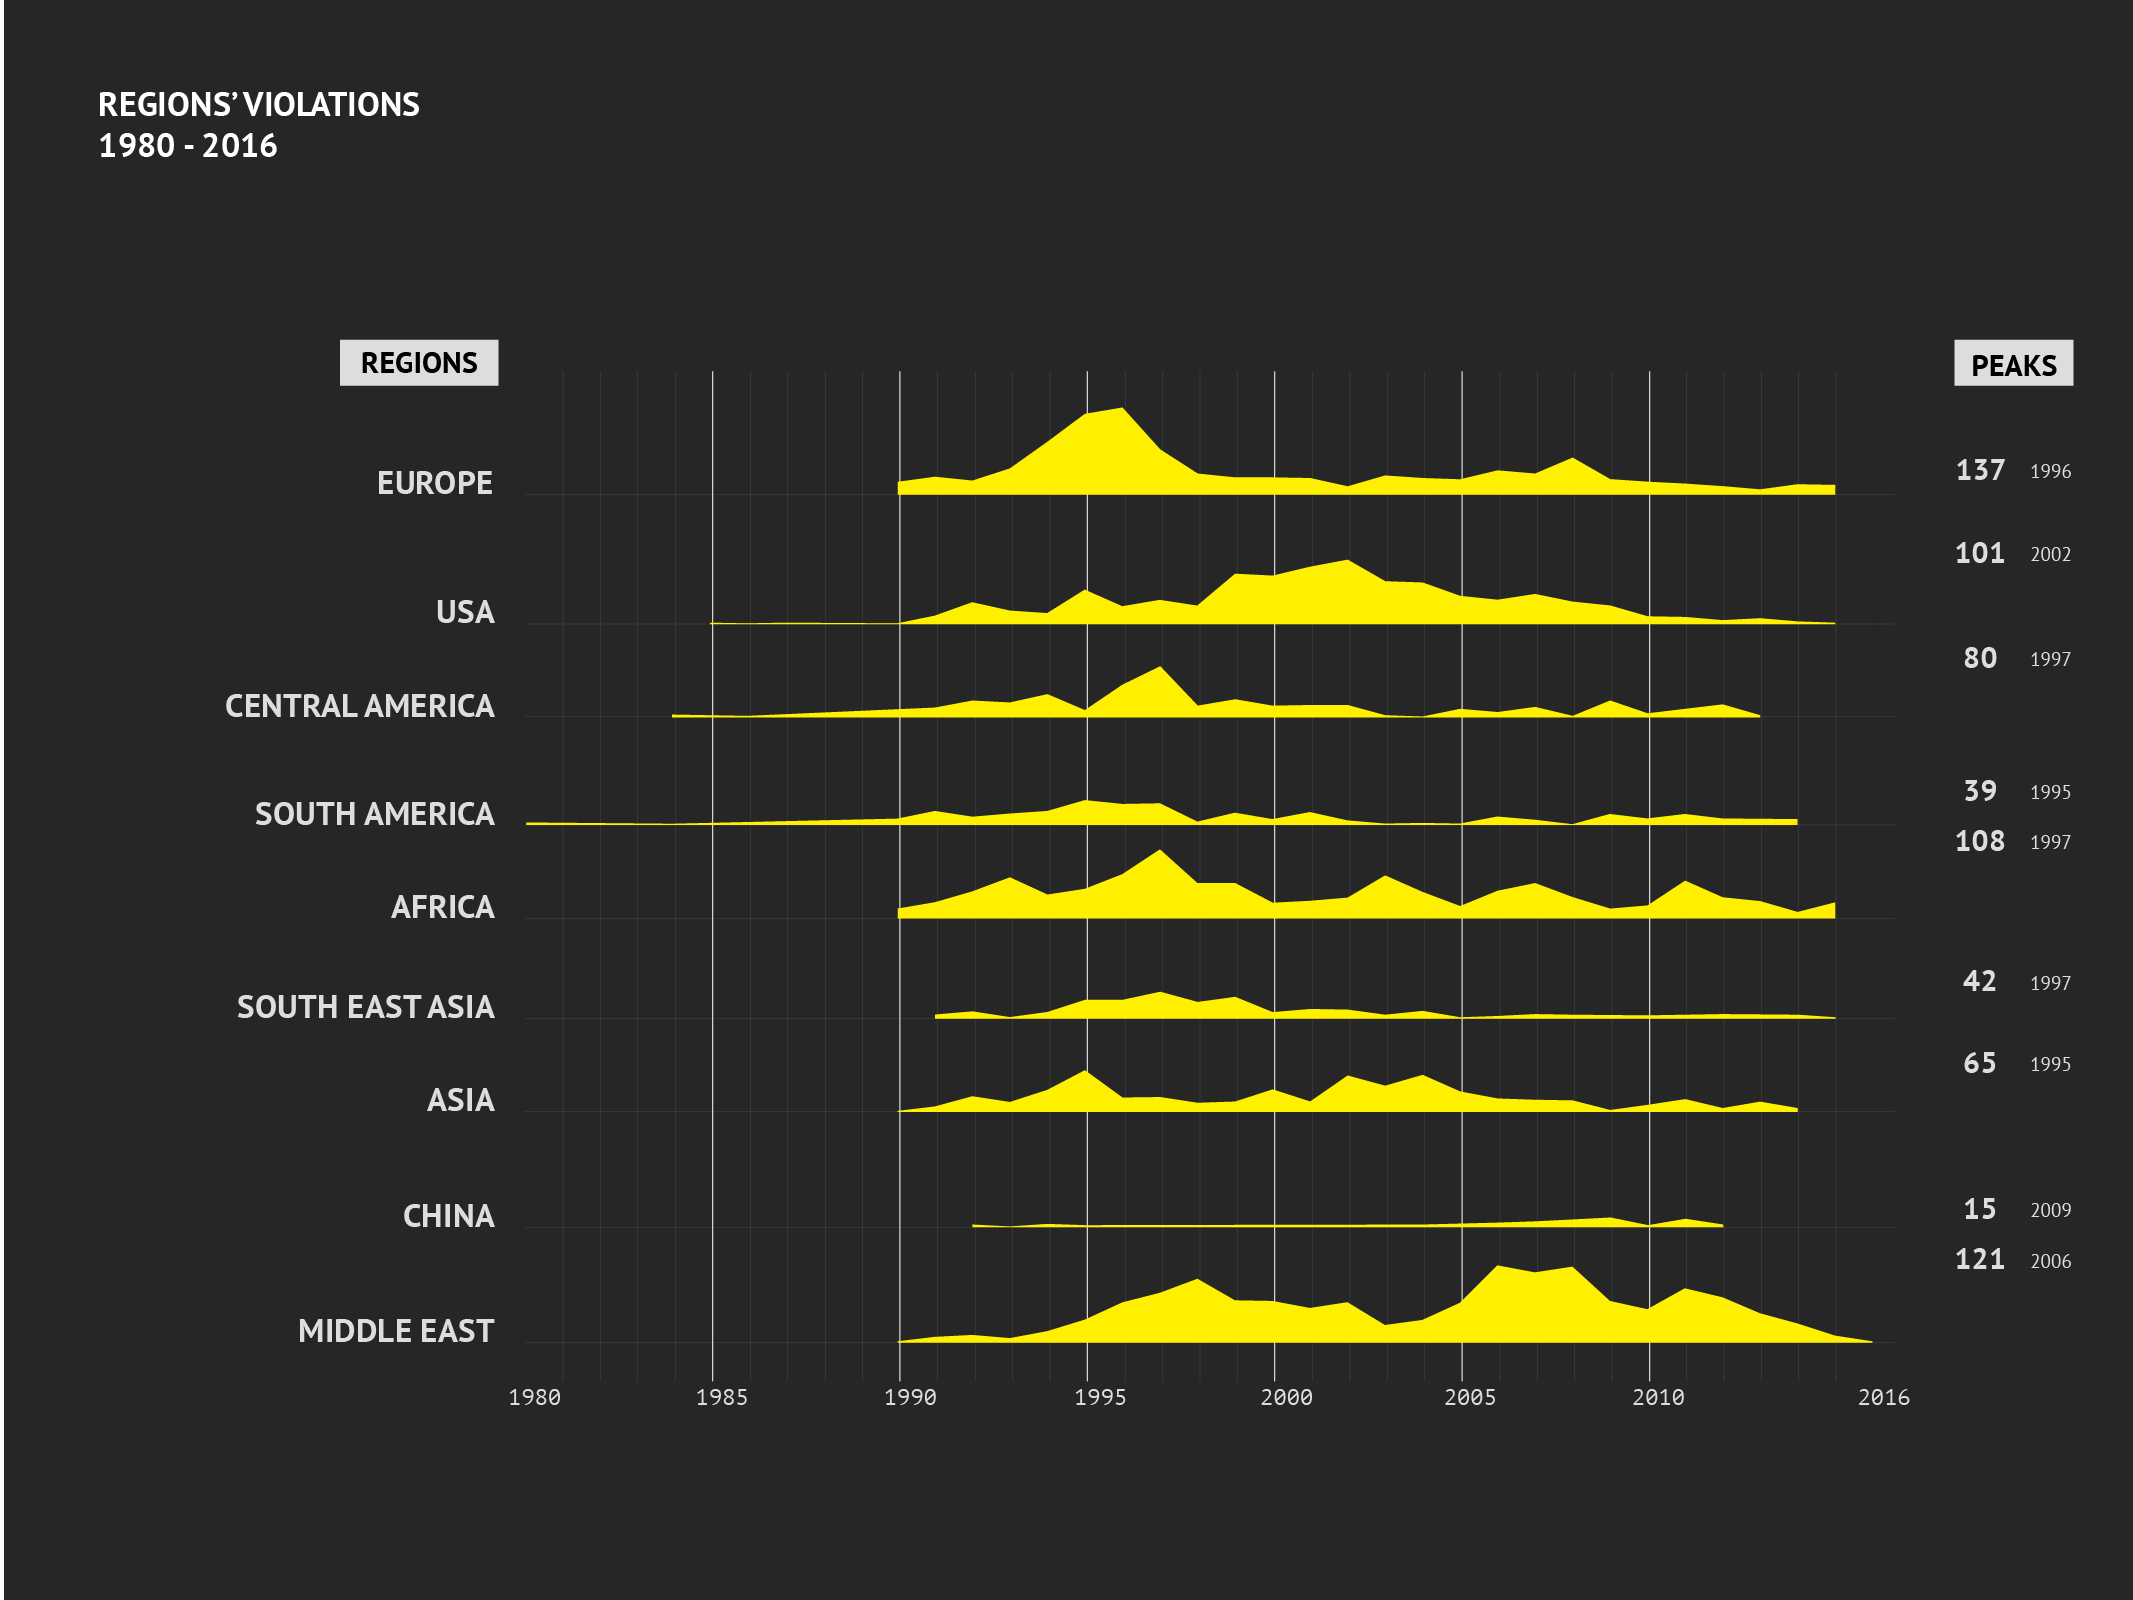
The spikes vary by region. South America spikes in 1995, with 39 cases. During this year, Amnesty International mostly organised Urgent Actions in South America in Colombia, Peru, and Venezuela. For both Colombia and Peru, 1995 was a year with an increase in terrorism, violence and disappearances in the country. In Venezuela, strikes and social unrest lead to a number of cases of disappearances during this period.
Asia sees a spike in Urgent Action cases in the same year, and counts 65 cases. The main reason for this spike is the occurrence of Singapore in the data sample; in 1995, Amnesty International organised 26 cases against Singapore, and most of them are related to death penalty. In the history of Singapore, 1994 and 1995 were the years during which the government executed most prisoners (respectively 76 and 73 people).
Europe sees a spike of cases in 1996 with 137 cases, which is due to the Civil War in Turkey. In 1996 alone, Amnesty International organised 108 Urgent Actions in Turkey. A more detailed analysis of Turkey is included below.
In 1997, there is a spike in Urgent Actions in Central America, with 80 cases. 61 of these cases were related to Mexico, where the War on Drugs was in full swing, and caused many disappearances (Dillon, 1997).In the same year, South East Asia knows its peak year with regard to the number of Urgent Actions (42 cases). More than half of these were aimed at Indonesia (28 cases), where president Suharto’s three-decade long presidency was slowly crumbling toward an end, mostly due to the Asian financial crisis, and Suharto targeted the growing number of opposition members.
Also in the same year, Africa counted its largest amount of Urgent Actions, with 108 cases. The larger bulk of cases are distributed amongst Burundi, Kenya, and Nigeria. Burundi found itself amid a civil war, in Nigeria, Amnesty International campaigned to free several “prisoners of conscience”, among whom was Kenyan writer Ladi Olorunyomi, and finally, in Kenya, general elections took place, of which the aftermath lead to an increase of arrests and detainments.
The next regional spike occurred in 2002, in the U.S. The country profile can be found below.The Middle East sees a spike in 2006, with most cases in Iran, Syria, and Yemen. 2006 proved to be a particularly tumultuous year for Iran, after Mahmoud Ahmadinejad won the presidential elections in 2005, the United Nations imposed several sanctions against Iran’s nuclear program, and the United States were rumoured to plan an attack on Iran. In Syria, the opposition spiked against the administration of Bashar al-Assad. Finally, in Yemen, general elections were organised in 2006, which Ali Abdallah Saleh won, and opposition members were subject to detention and execution.
Finally, 15 Urgent Actions were organised in China in 2009. An estimated 5,000 prisoners were executed in this year, according to the Dui Ha Foundation (Dui Ha, n.d.).

What kinds of worlds are articulated through Amnesty’s classificatory practices?
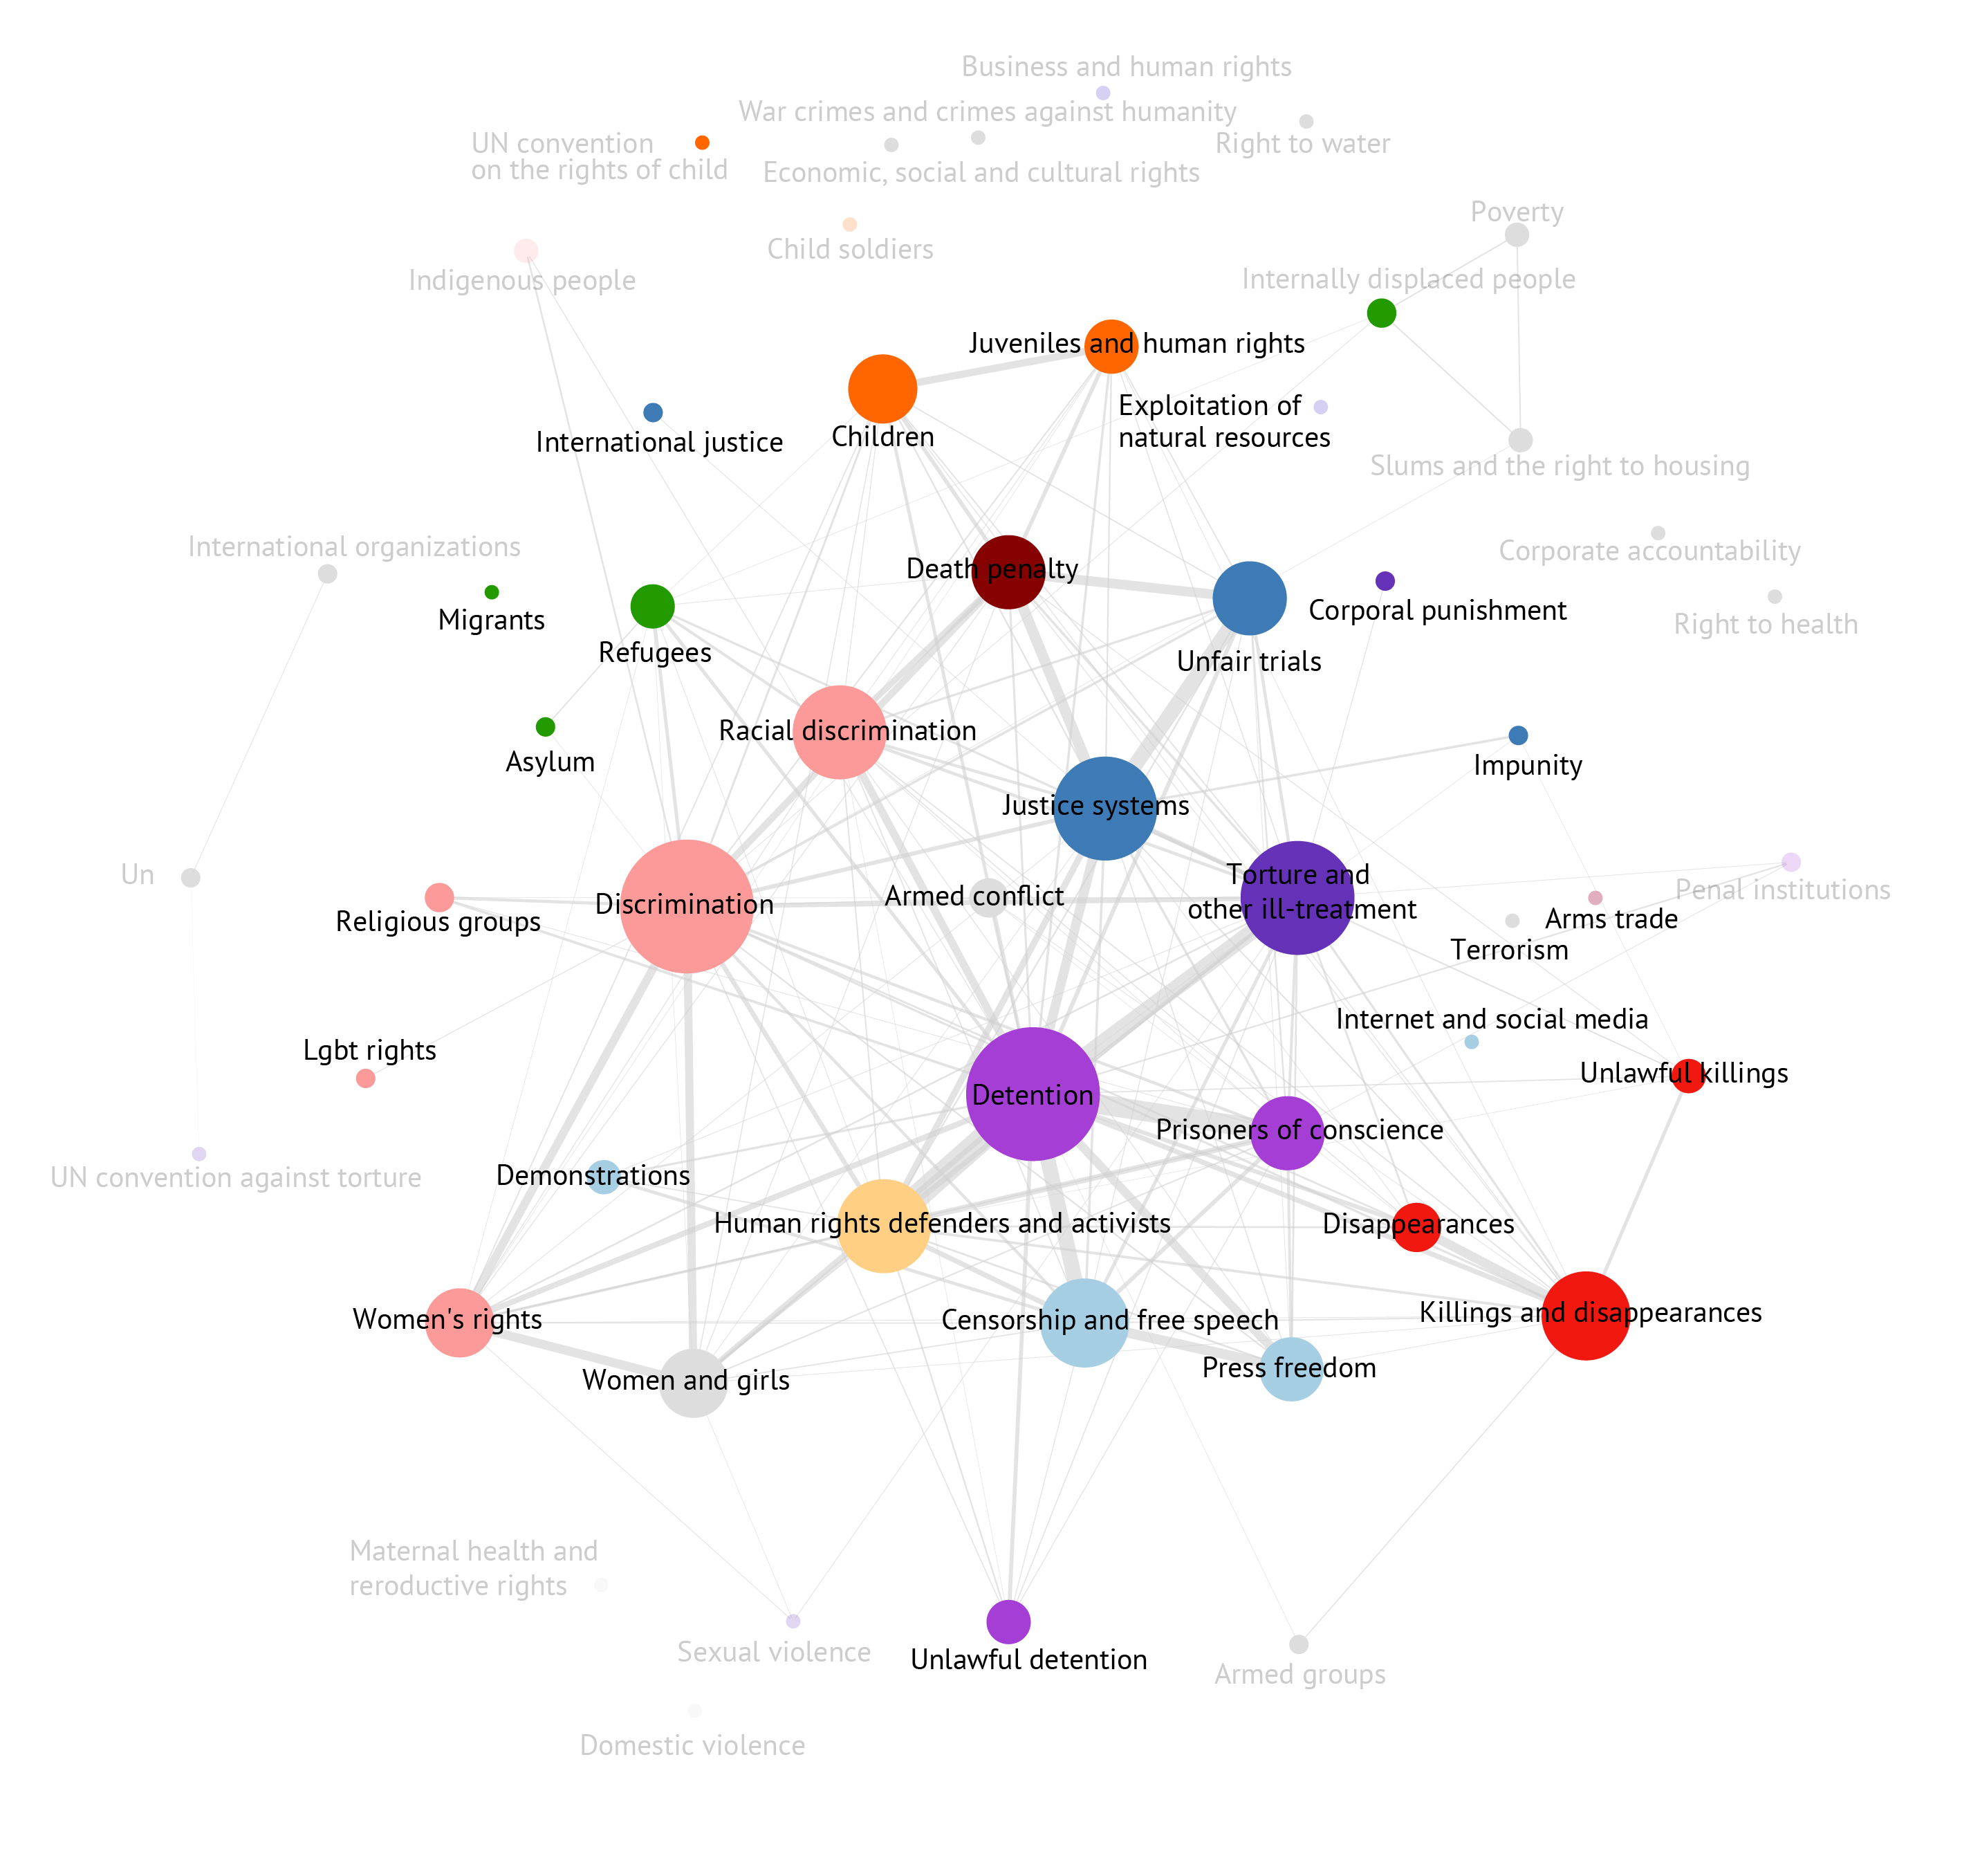
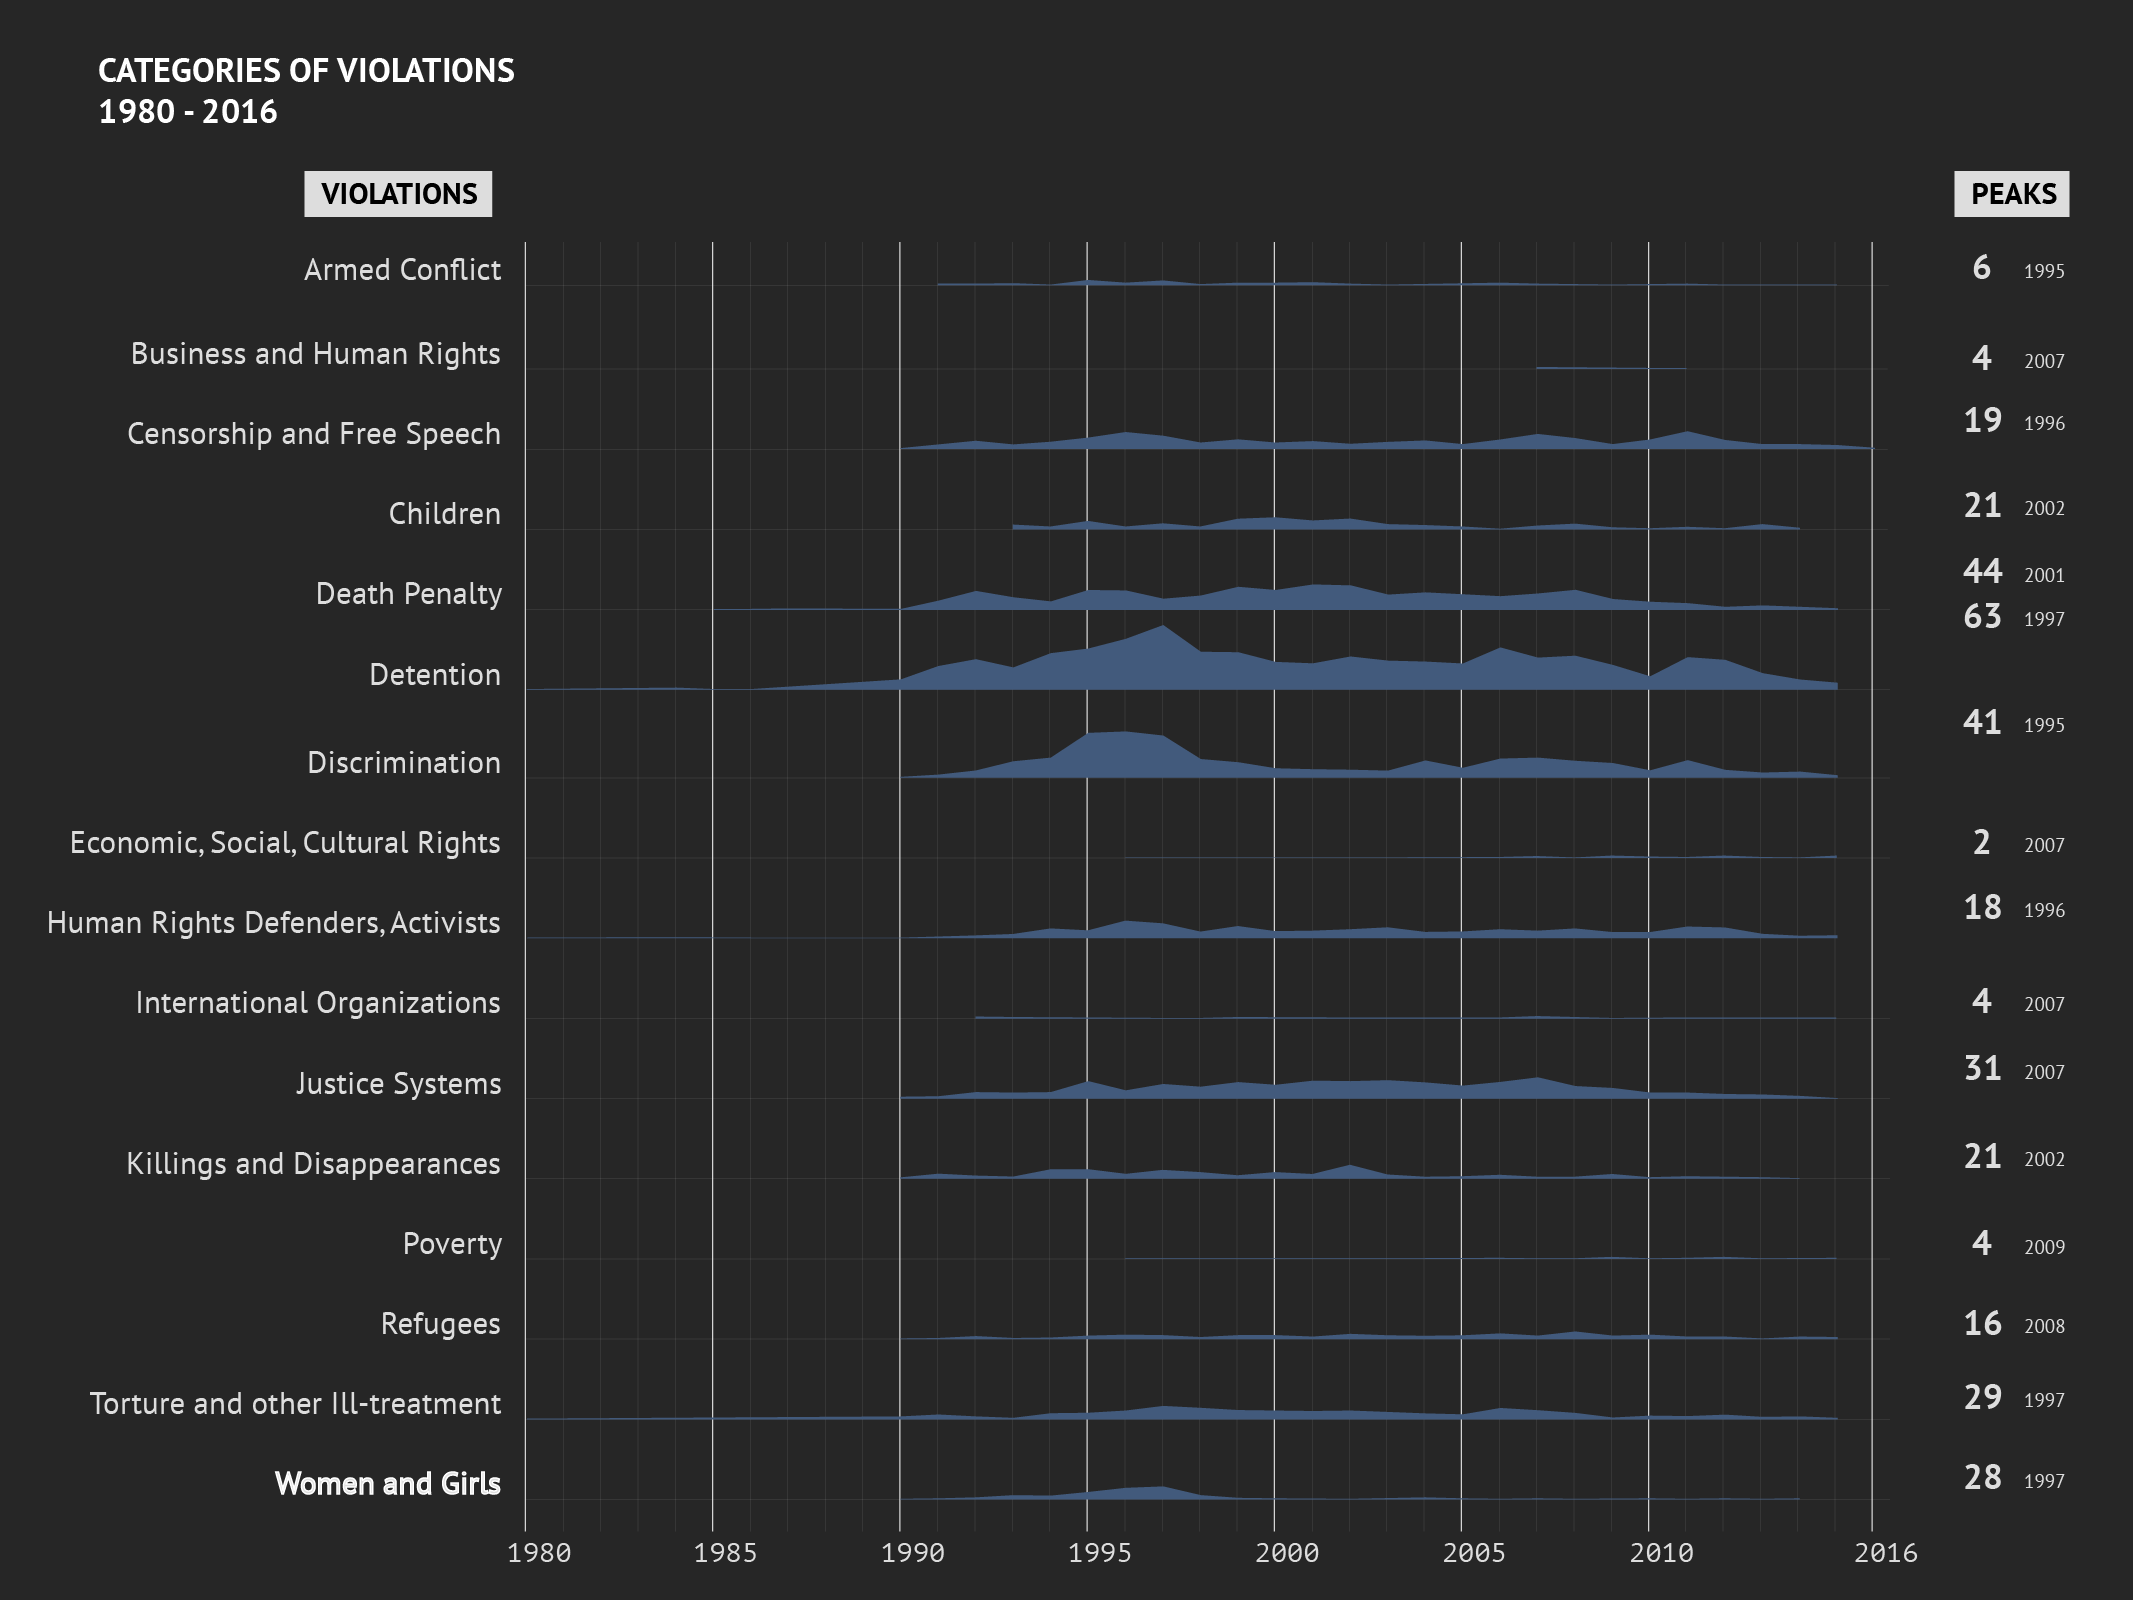
Analysing the co-occurrence of different categories of violations in the Urgent Actions tells us about the constellation of human rights in which Amnesty operates. We used Gephi's Force Atlas 2 algorithm to explore these co-occurences:

In the centre we can see Amnesty’s founding concerns of “detention”, “discrimination” and “censorship”. In the peripheries we find other comparatively marginal topics such as “right to water”, “right to health” and “internet and social media”.
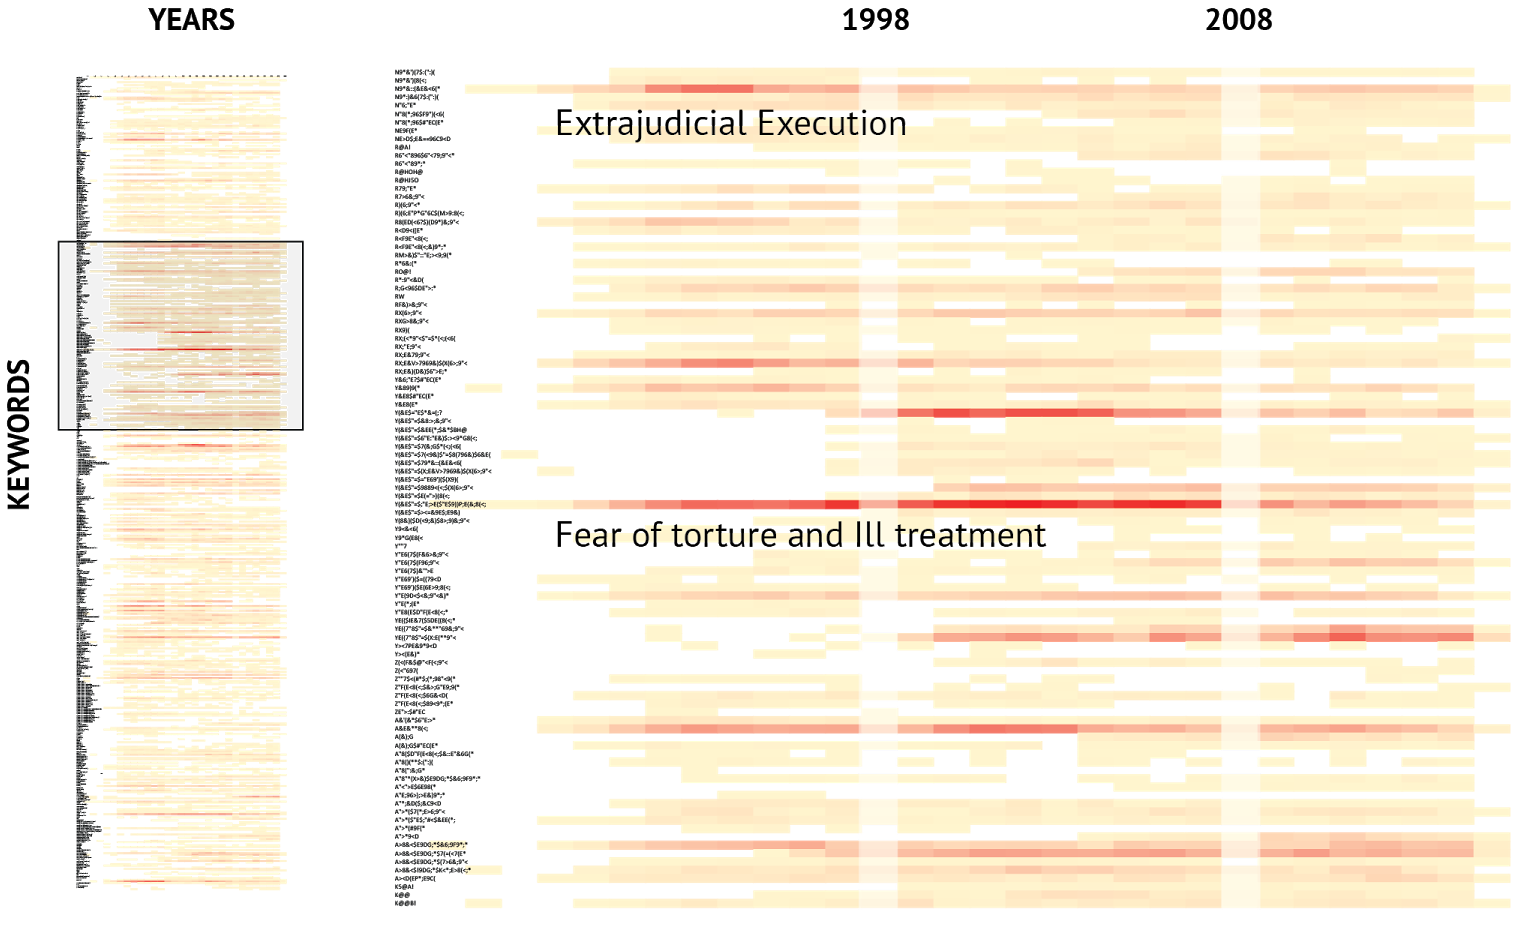
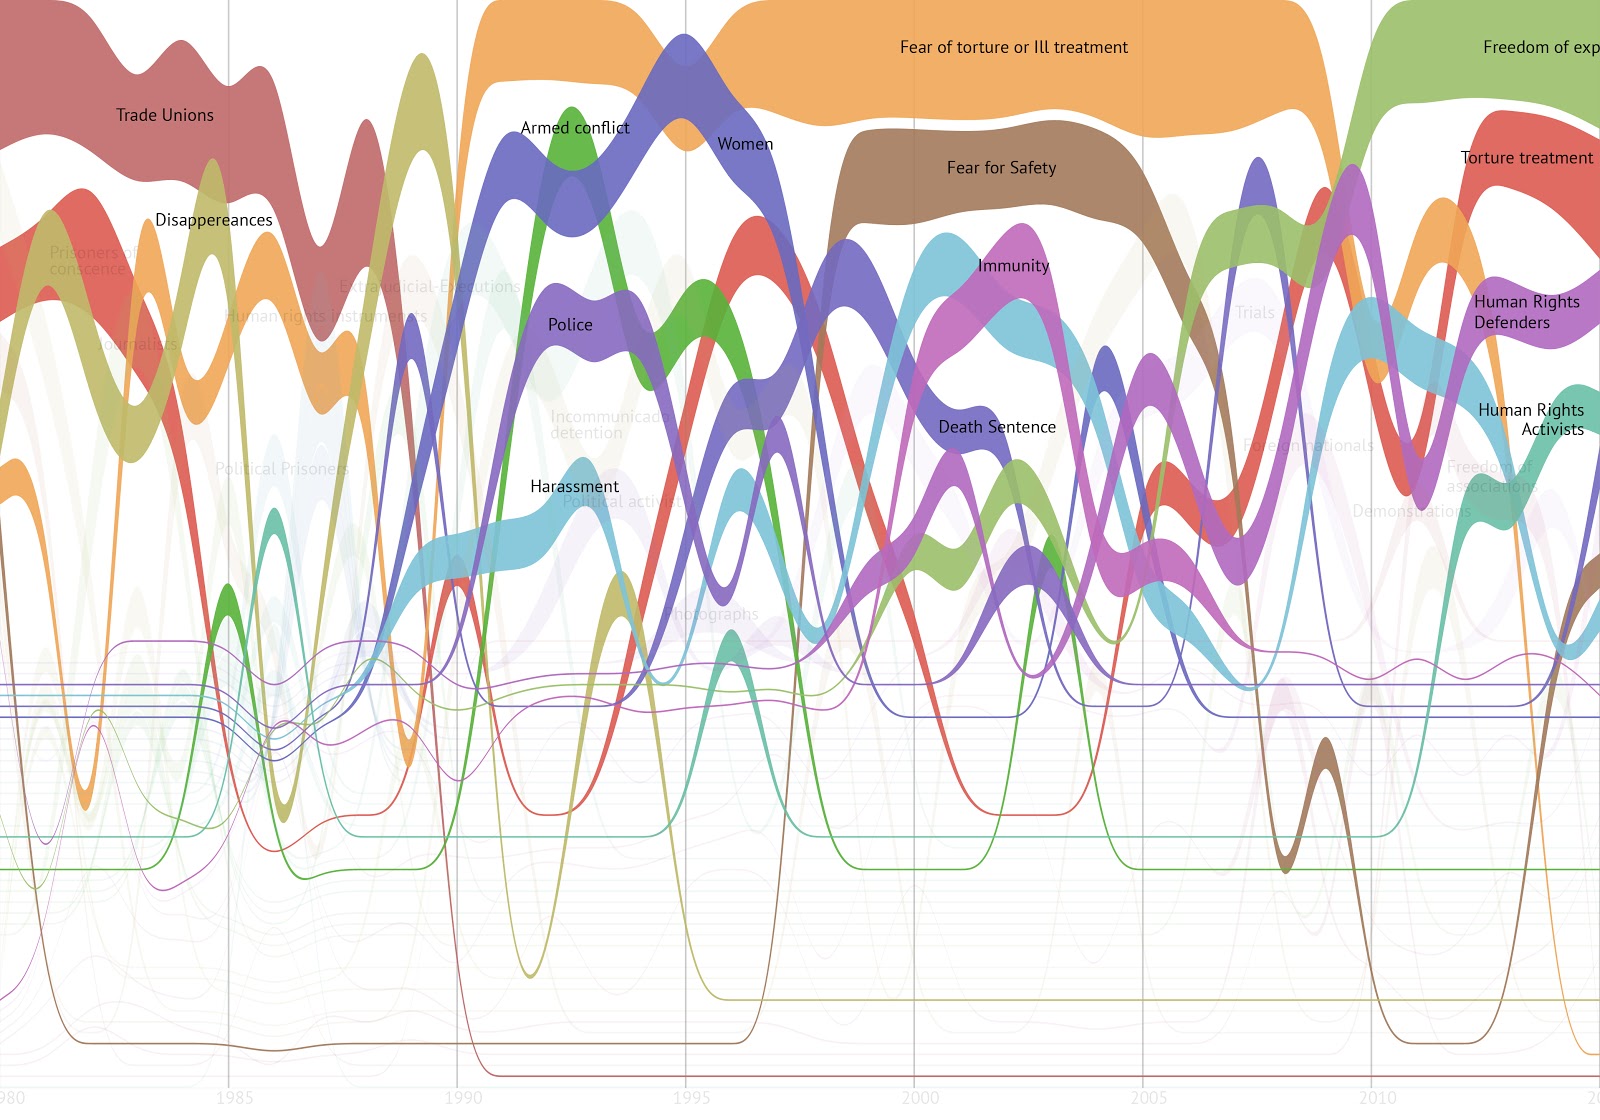
One could make the case that this echoes Isaiah Berlin’s classic distinction between positive and negative conceptions of liberty – a pattern which is also echoed by recent historical work looking at how human rights advocacy has evolved from the post-war period to the present.We also did an exploratory visualisation to look at the use of over 525 keywords that were used by Amnesty’s different offices to describe their work. These keywords were retrospectively reclassified in terms of 17 top level categories and 44 sub categories. This can be used to explore the rise and fall of different kinds of “rights talk” over time.

For example, we see the dominance of trade unions in the 1980s, which then levels off in the early 1990s. The category of women rises in the early 1990s and peaks in the mid 1990s. With the exception of this peak, the top category from 1990 to around 2010 is fear of torture and ill treatment. After 2010 it becomes freedom of expression.

What makes an Urgent Action successful?
Overview
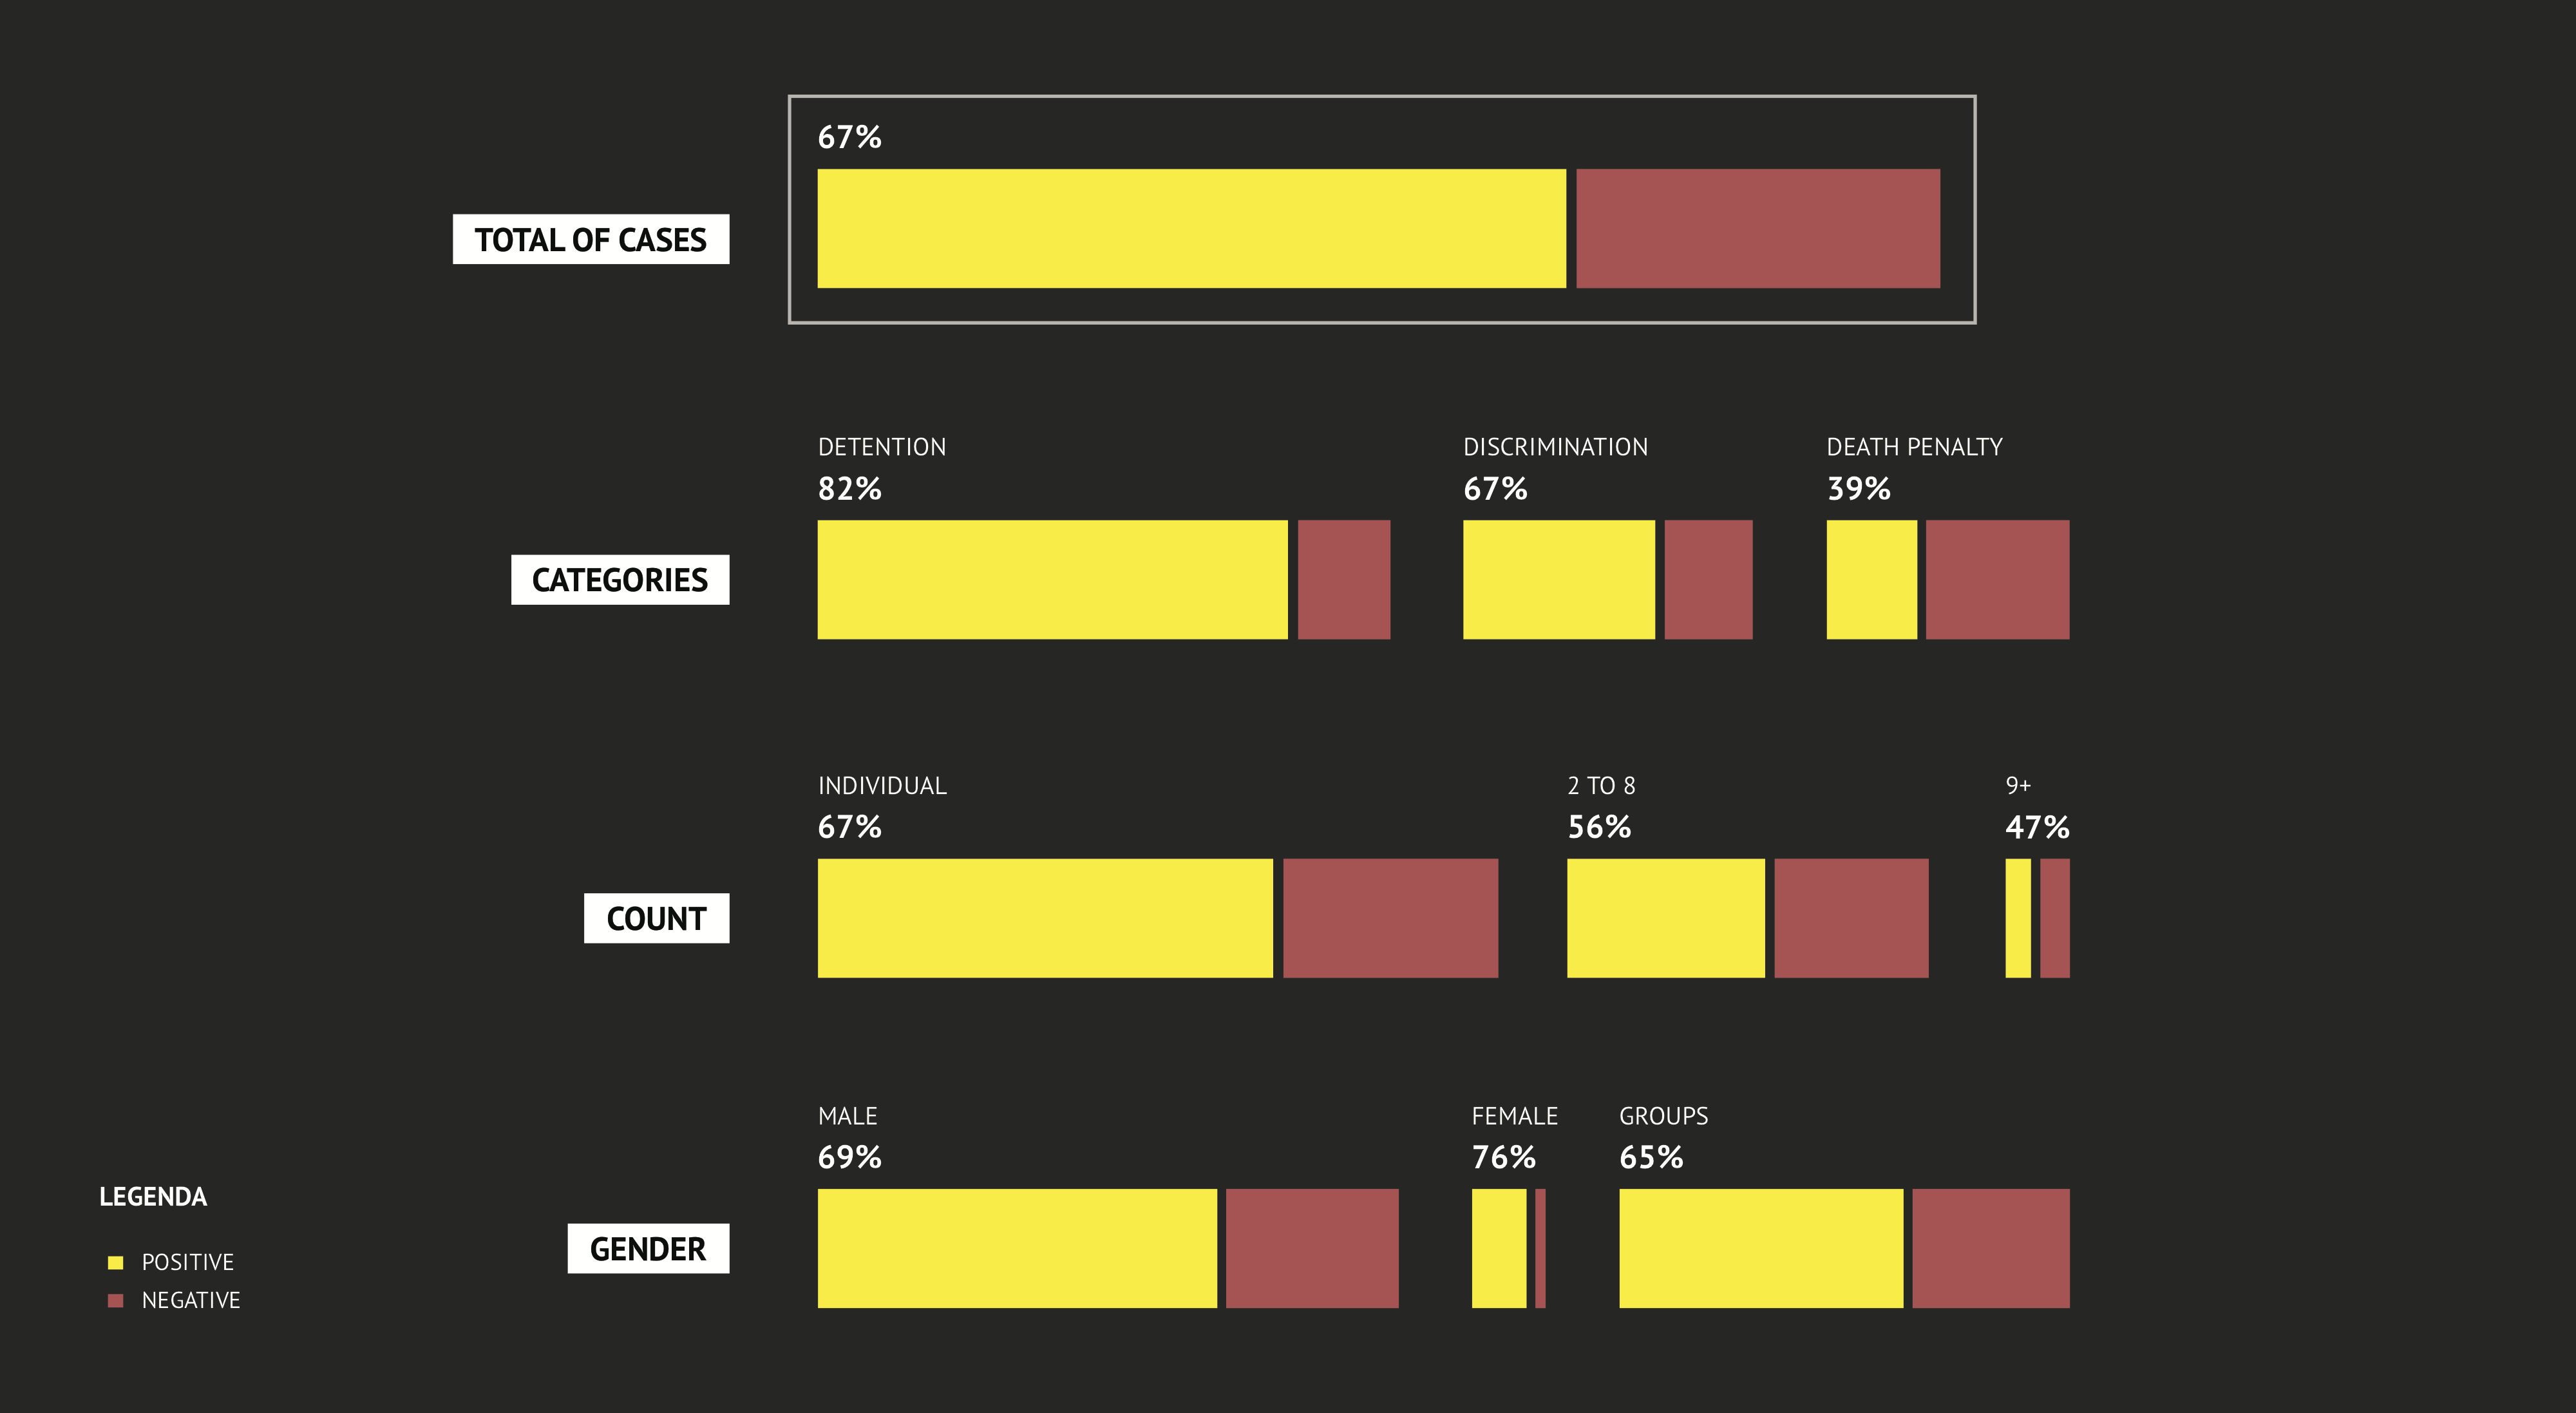
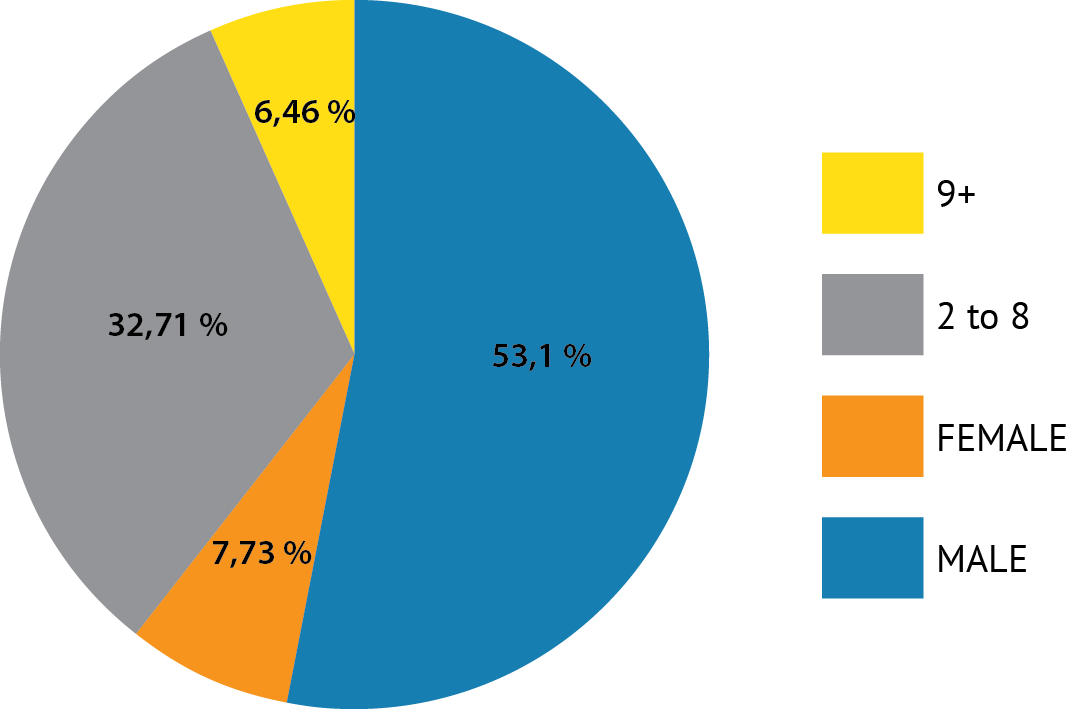
Statistical analysis of the verified dataset (using STATA software) shows that, over time:- Urgent Actions have been successful in 67.5% of cases represented in the sample;
- 70.4% of individual cases have been successful - specifically 69.8% of cases where the victim was male , compared to 74% of cases where the victim was female (although, the difference between male and female victims is statistically insignificant due to a low number of female cases in the sample);
- In relation to groups of 2 to 8 persons , the average rate of success drops to 66.4% , and for larger groups of 9 persons and more the success rate is even lower at 63.6% .

Outcomes by victim type
Following is a breakdown of the cases present in the verified dataset by gender:
 As we see from the chart, over half of the Urgent Actions in the verified dataset pertain to male individuals.
Controlling for variation across geographical regions and across categories of violations, the average statistical likelihood of a positive Urgent Action outcome for both males and females is at 67.3%. However, the likelihood of a positive outcome for a group of 2 to 8 drops to 56.1%, and for groups of 9+ it is 46.6%. The results are statistically significant at a 99% level.
As we see from the chart, over half of the Urgent Actions in the verified dataset pertain to male individuals.
Controlling for variation across geographical regions and across categories of violations, the average statistical likelihood of a positive Urgent Action outcome for both males and females is at 67.3%. However, the likelihood of a positive outcome for a group of 2 to 8 drops to 56.1%, and for groups of 9+ it is 46.6%. The results are statistically significant at a 99% level.
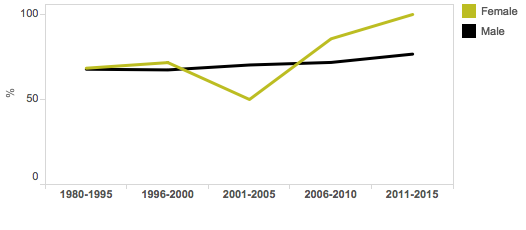
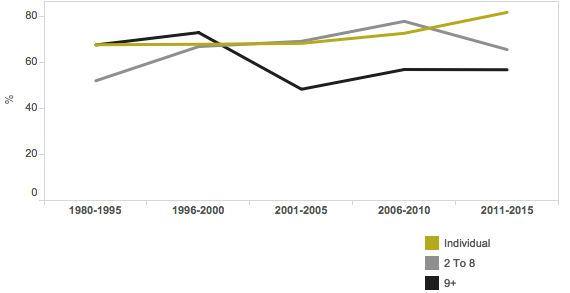
We found that the proportion of successful outcomes of Urgent Actions for individuals has grown over the years, whereas the proportion of successful outcomes for groups is on the decline, as per the following graph:

If we delve deeper into the temporal dynamics of individuals depending on gender, we see a twofold increase in the positive outcomes among females, from 50% in 2001-2005, to a 100% in the past five years.
However, it is important to note that, due to a small proportion of female cases in the sample, the difference between Urgent Action cases where the victim was male or female is statistically insignificant. Therefore, we can assume the projected likelihood of a positive outcome to be the same for both genders at 67.3%, as explained above.
The following table contains average likelihood of a positive outcome of Urgent Action in the verified database for individuals vs. groups:
| # cases | Individual | 2 to 8 | 9+ | |
| 1980-1995 | 494 | 67.9 | 52.2 | 67.8 |
| 1996-2000 | 694 | 68.1 | 67.1 | 73.2 |
| 2001-2005 | 453 | 68.5 | 69.4 | 48.5 |
| 2006-2010 | 436 | 72.9 | 78.1 | 57.1 |
| 2011-2015 | 213 | 82 | 65.8 | 57 |
| # cases | Male | Female | |
| 1980-1995 | 494 | 67.8 | 68.4 |
| 1996-2000 | 694 | 67.4 | 71.7 |
| 2001-2005 | 453 | 70.3 | 50 |
| 2006-2010 | 436 | 71.8 | 85.7 |
| 2011-2015 | 213 | 76.7 | 100 |

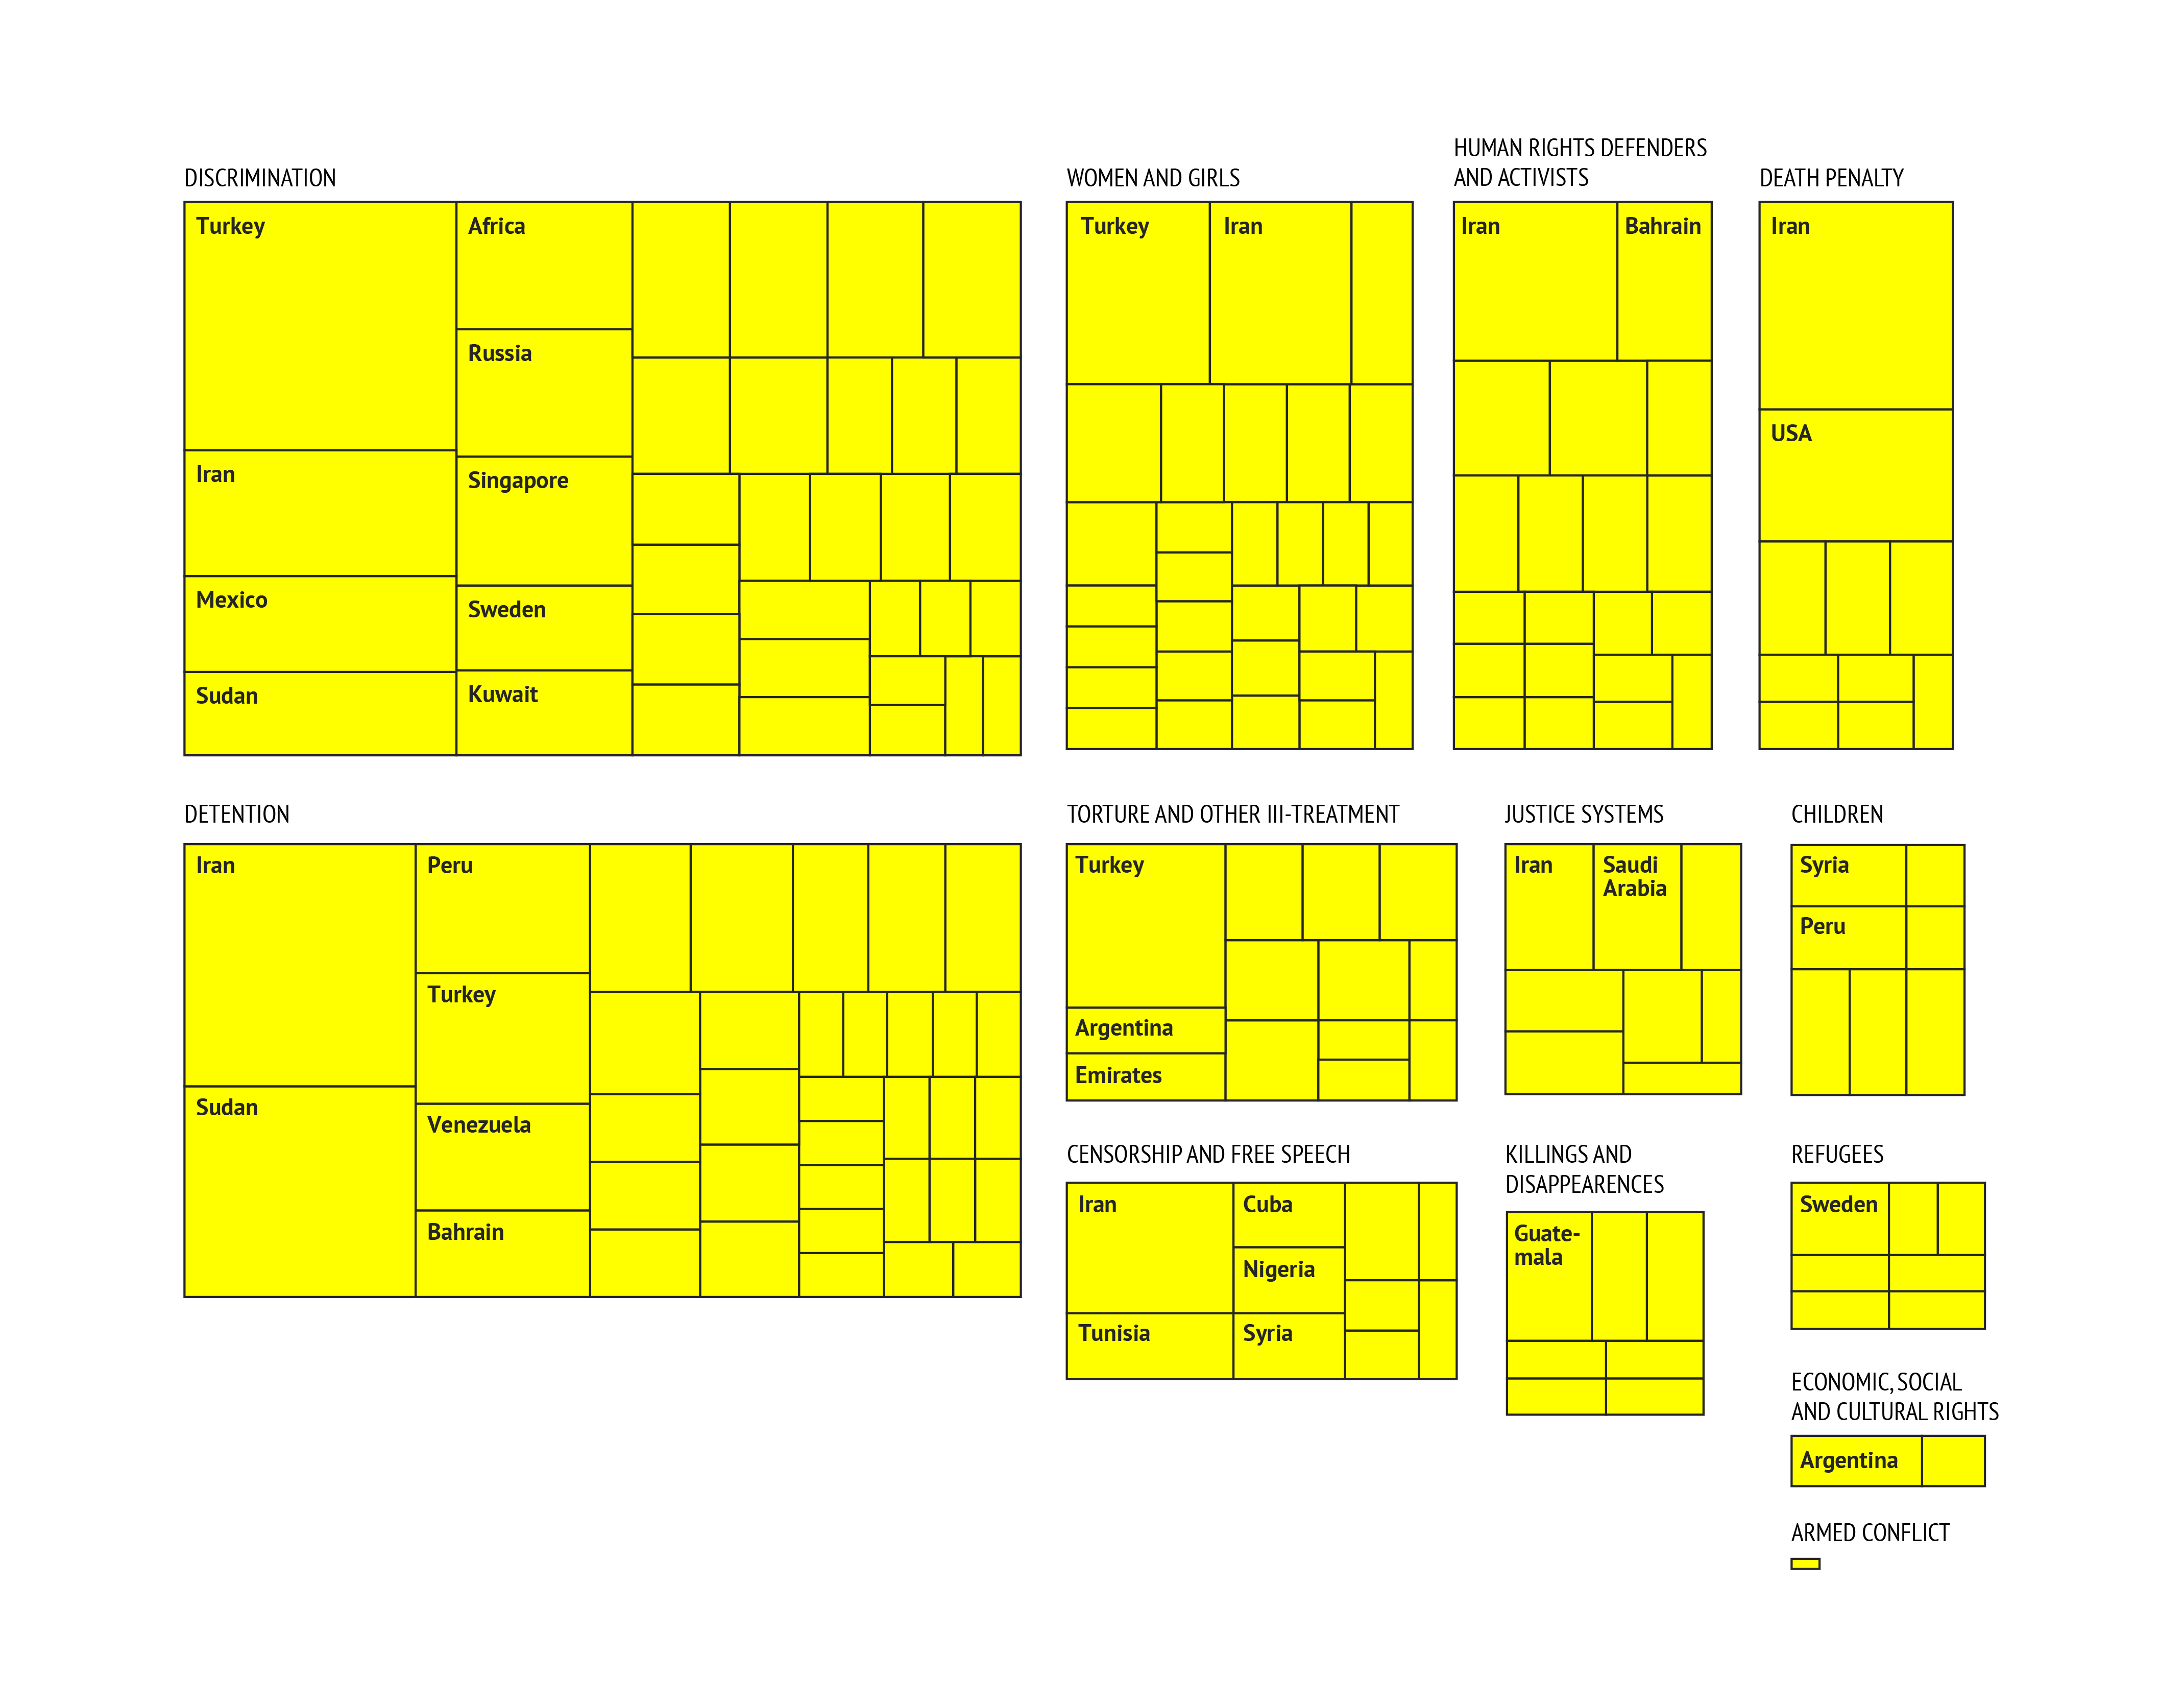
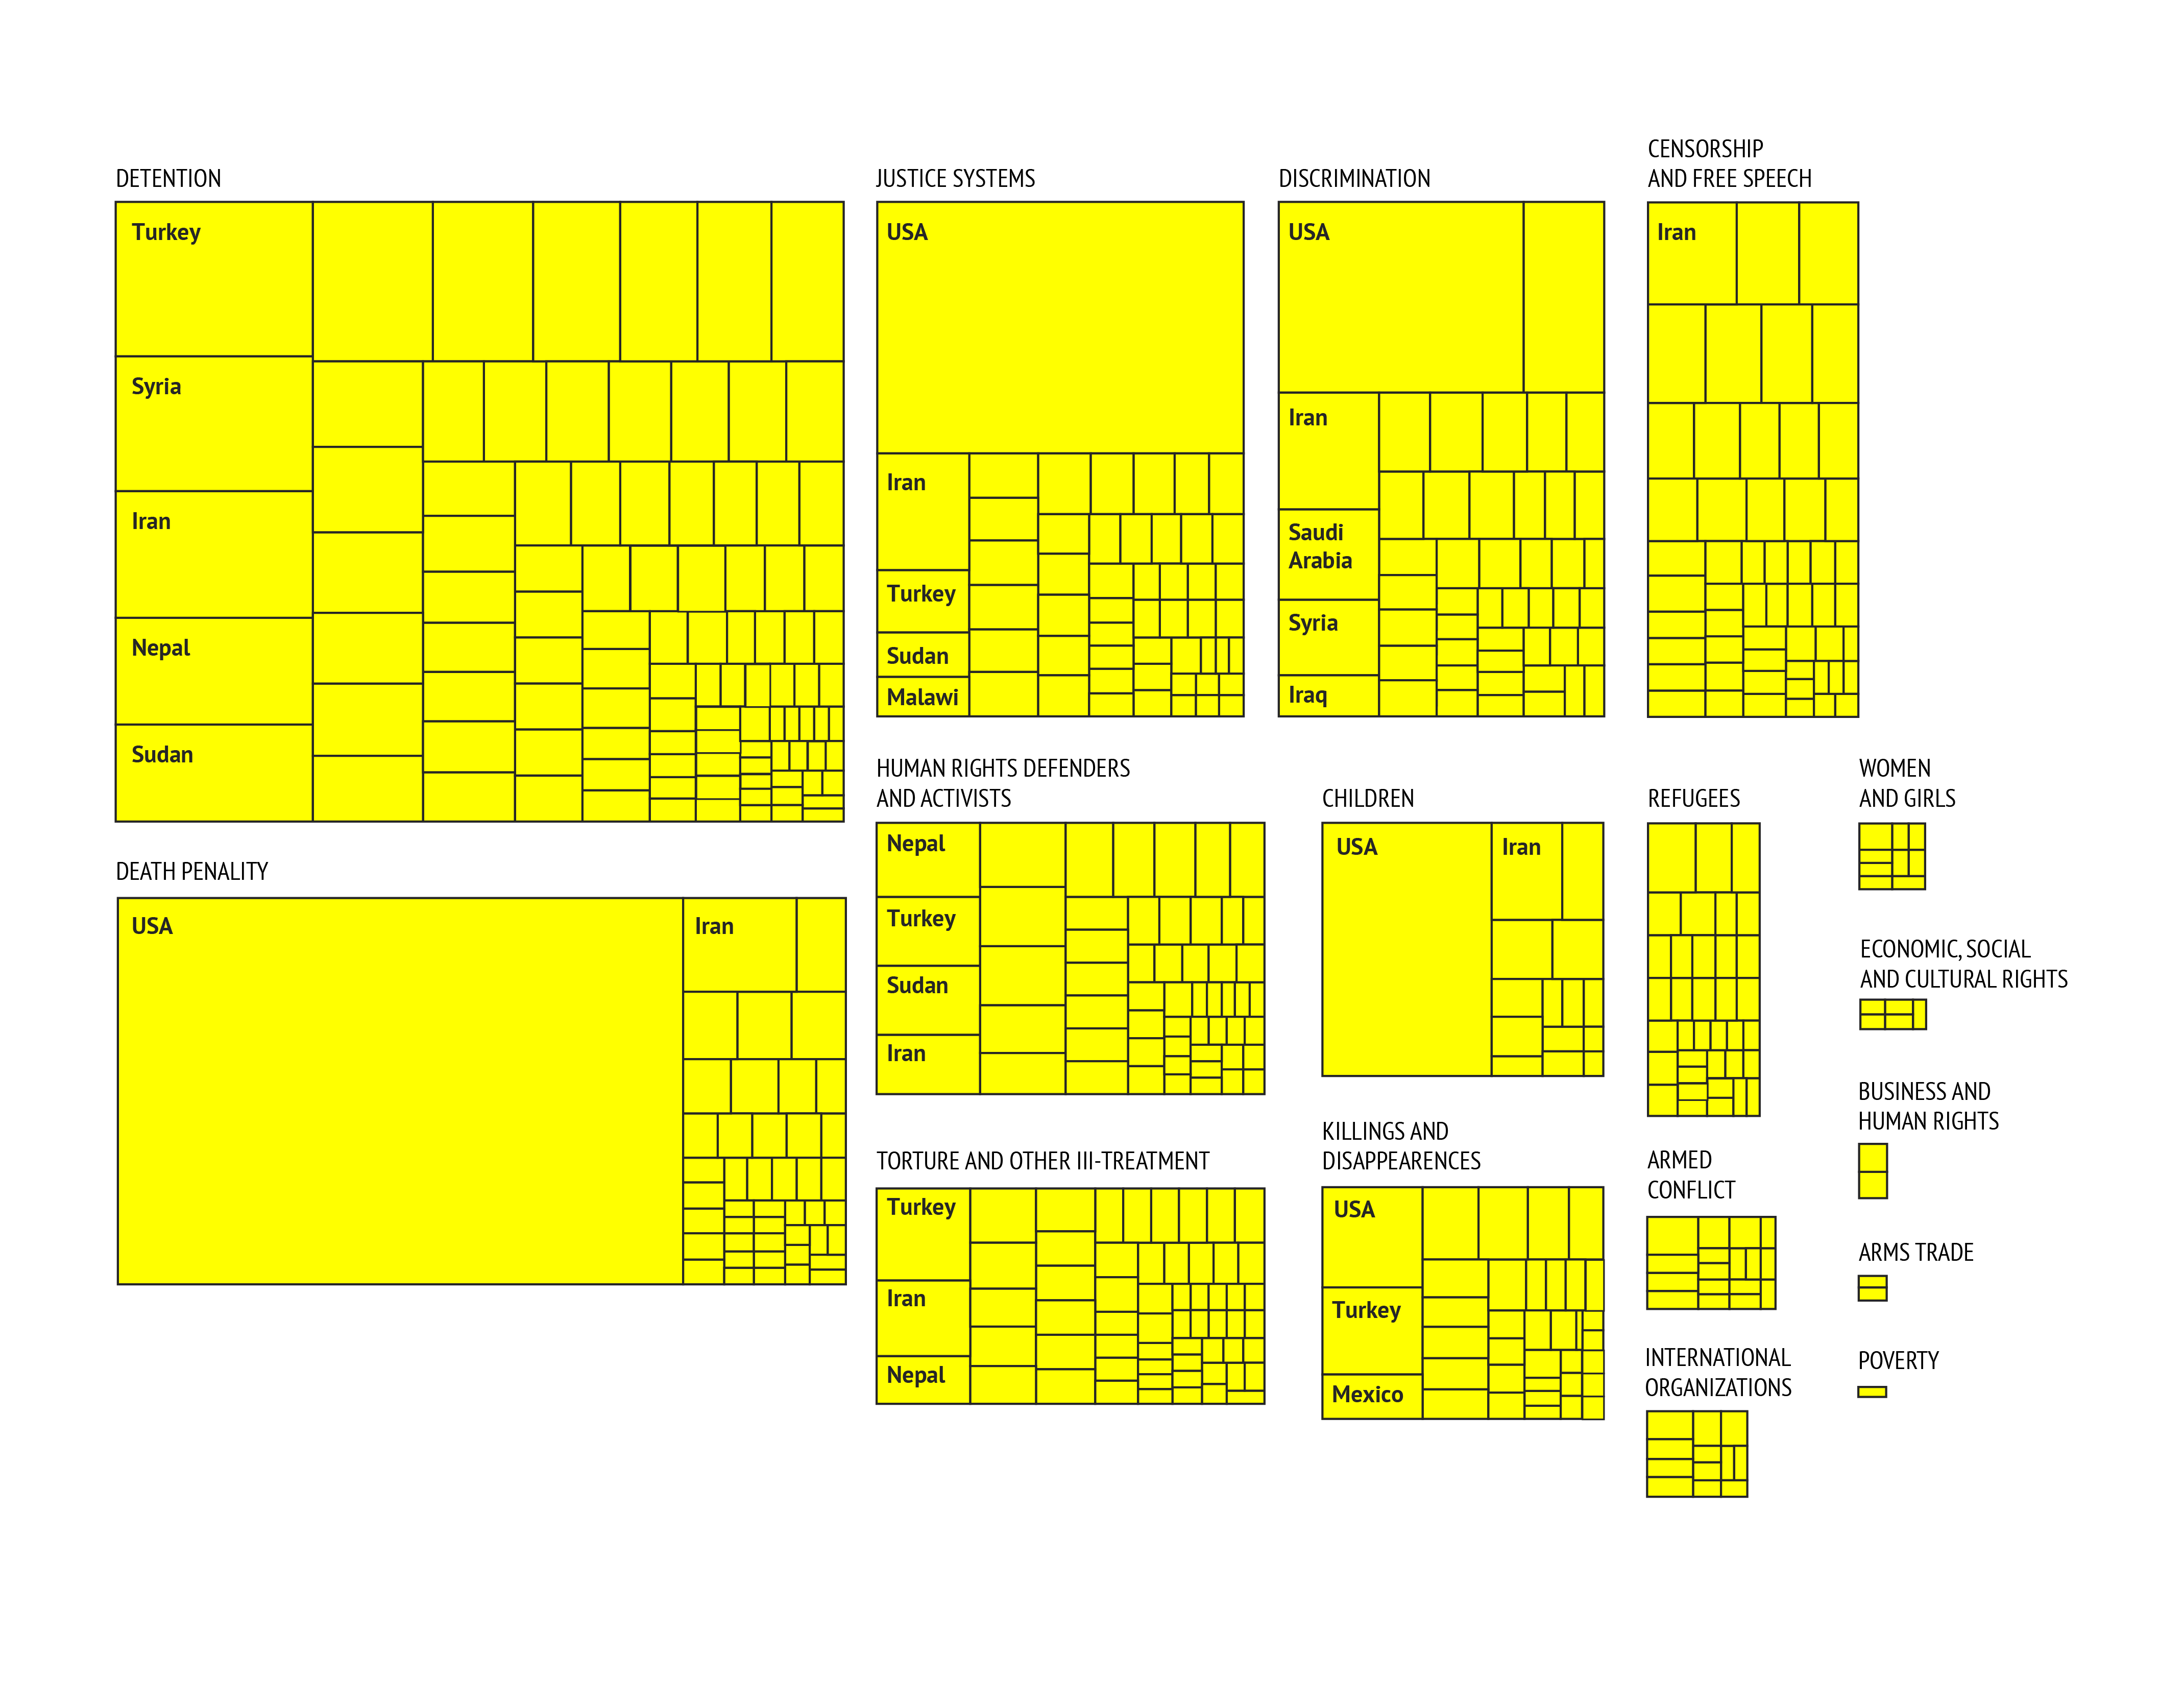
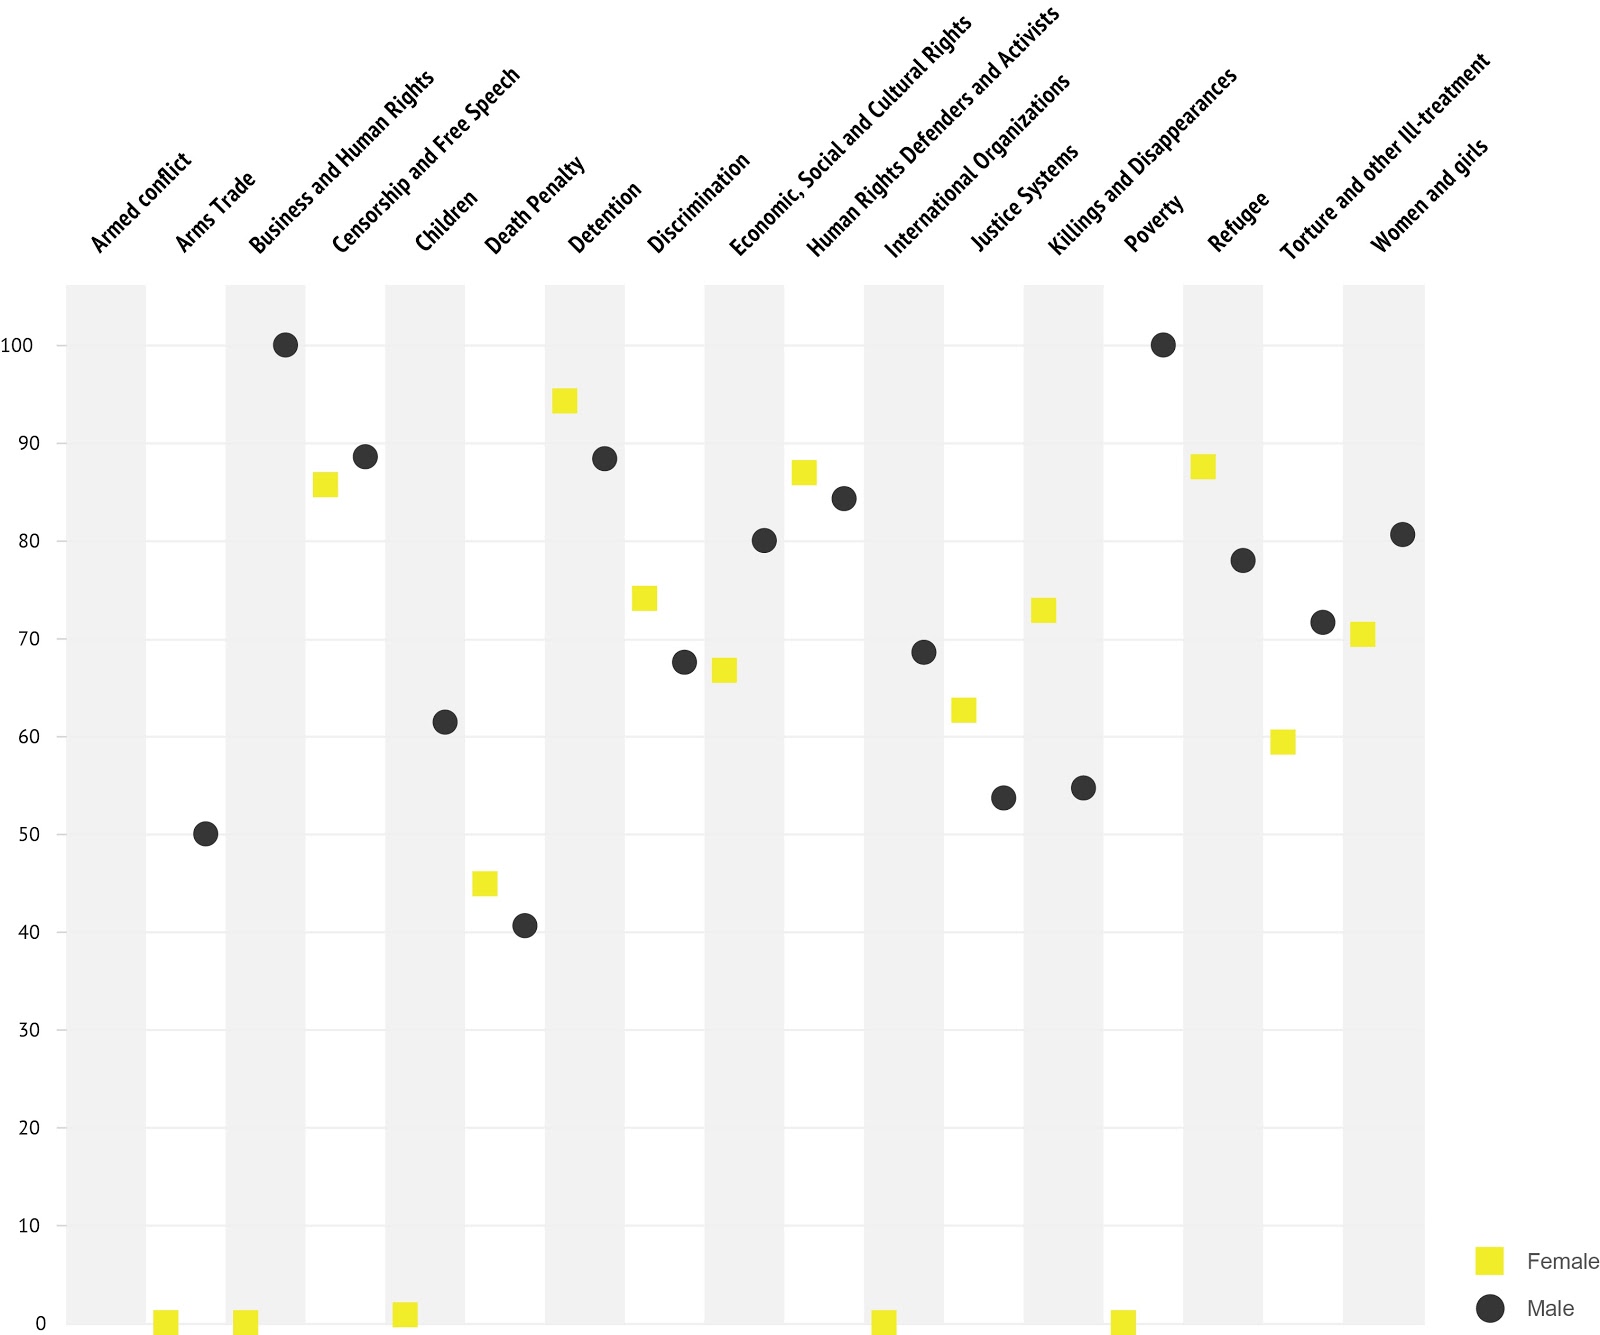
We also explored the proportion of different categories of violations by gender, in order to understand how recurrent are certain kinds of categories of violations and the main countries where these violations were perpetrated. From our analysis, we saw that there is a modest but recurrent correlation between male and female individuals in regard of categories of violation, and countries involved. For female cases, we can see from this visualisation that Urgent Actions have been called out particularly for cases of Discrimination, Detention, and violation of Women and Girls' Human Rights which have been recurrent particularly in Turkey, Iran and Sudan, from 1980 until the present.

For Urgent Actions on human rights violations pertaining to male individuals we can see that Detention is the major category, with Turkey, Syria Iran, Nepal and Sudan at the top in terms of number of cases. Interestingly, in the categories that follow Detention in terms of number, which are Death Penalty and Justice Systems, the United States is at the top with a huge number of cases, especially if compared with Iran and Turkey’s ones which appear as following countries in those categories. More generally, what is striking is, over time, the predominance of the United States in all the major categories that required Urgent Actions for male individuals, when, on the contrary, US presence is comparatively small for female cases.
 Following is the breakdown of successful cases by victim identity (male/female/group/group 9+) and categories of violations:
| # cases | Male | Female | 2 to 8 | 9+ | |
| Armed Conflict | 76 | 60 | 0 | 67.5 | 60 |
| Arms Trade | 3 | 50 | 0 | 100 | 0 |
| Business and Human Rights | 8 | 100 | 0 | 100 | 0 |
| Censorship and Free Speech | 449 | 88.4 | 85.7 | 71.3 | 68.6 |
| Children | 224 | 61.3 | 0.75 | 54.1 | 0.22 |
| Death Penalty | 722 | 40.5 | 44.8 | 30.8 | 50 |
| Detention | 1662 | 88.3 | 94.1 | 76.2 | 62.3 |
| Disappearances | 124 | 64.3 | 62.5 | 63.6 | 0 |
| Discrimination | 852 | 67.5 | 74 | 64.9 | 62.5 |
| Economic, Social and Cultural Rights | 33 | 80 | 66.7 | 88.2 | 87.5 |
| Human Rights Defenders and Activists | 414 | 84.1 | 86.8 | 75.9 | 85.7 |
| International Organizations | 30 | 68.4 | 0 | 33.4 | 0 |
| Justice Systems | 593 | 53.5 | 62.5 | 54.2 | 43.8 |
| Killings and Disappearances | 227 | 54.61 | 72.7 | 58.8 | 50 |
| Poverty | 21 | 100 | 0 | 86.7 | 80 |
| Refugees | 167 | 77.9 | 87.5 | 75.4 | 61.5 |
| Torture and other Ill-treatment | 344 | 71.5 | 59.3 | 59 | 33.4 |
| Women and Girls | 174 | 80.6 | 70.4 | 75.6 | 66.7 |

Outcomes by country
Next we looked at outcomes by country, starting with which countries have the most negative outcomes - as per the following list:- USA
- Iran
- Turkey
- Syria
- Saudi Arabia
- Yemen
- Palestinian Authority
- Singapore
- China
- Malaysia
We decided to profile two countries with most cases in the sample dataset; the United States, which has a total of 955 cases, and Turkey, which has a total of 486 cases. We sought to create more detailed profiles for the U.S. and Turkey in order to contextualise the Urgent Actions in the verified database. The profiles were created based on the categories of the cases, where we focused on occurrence and temporality of the types of categories, and on the outcome of the cases.
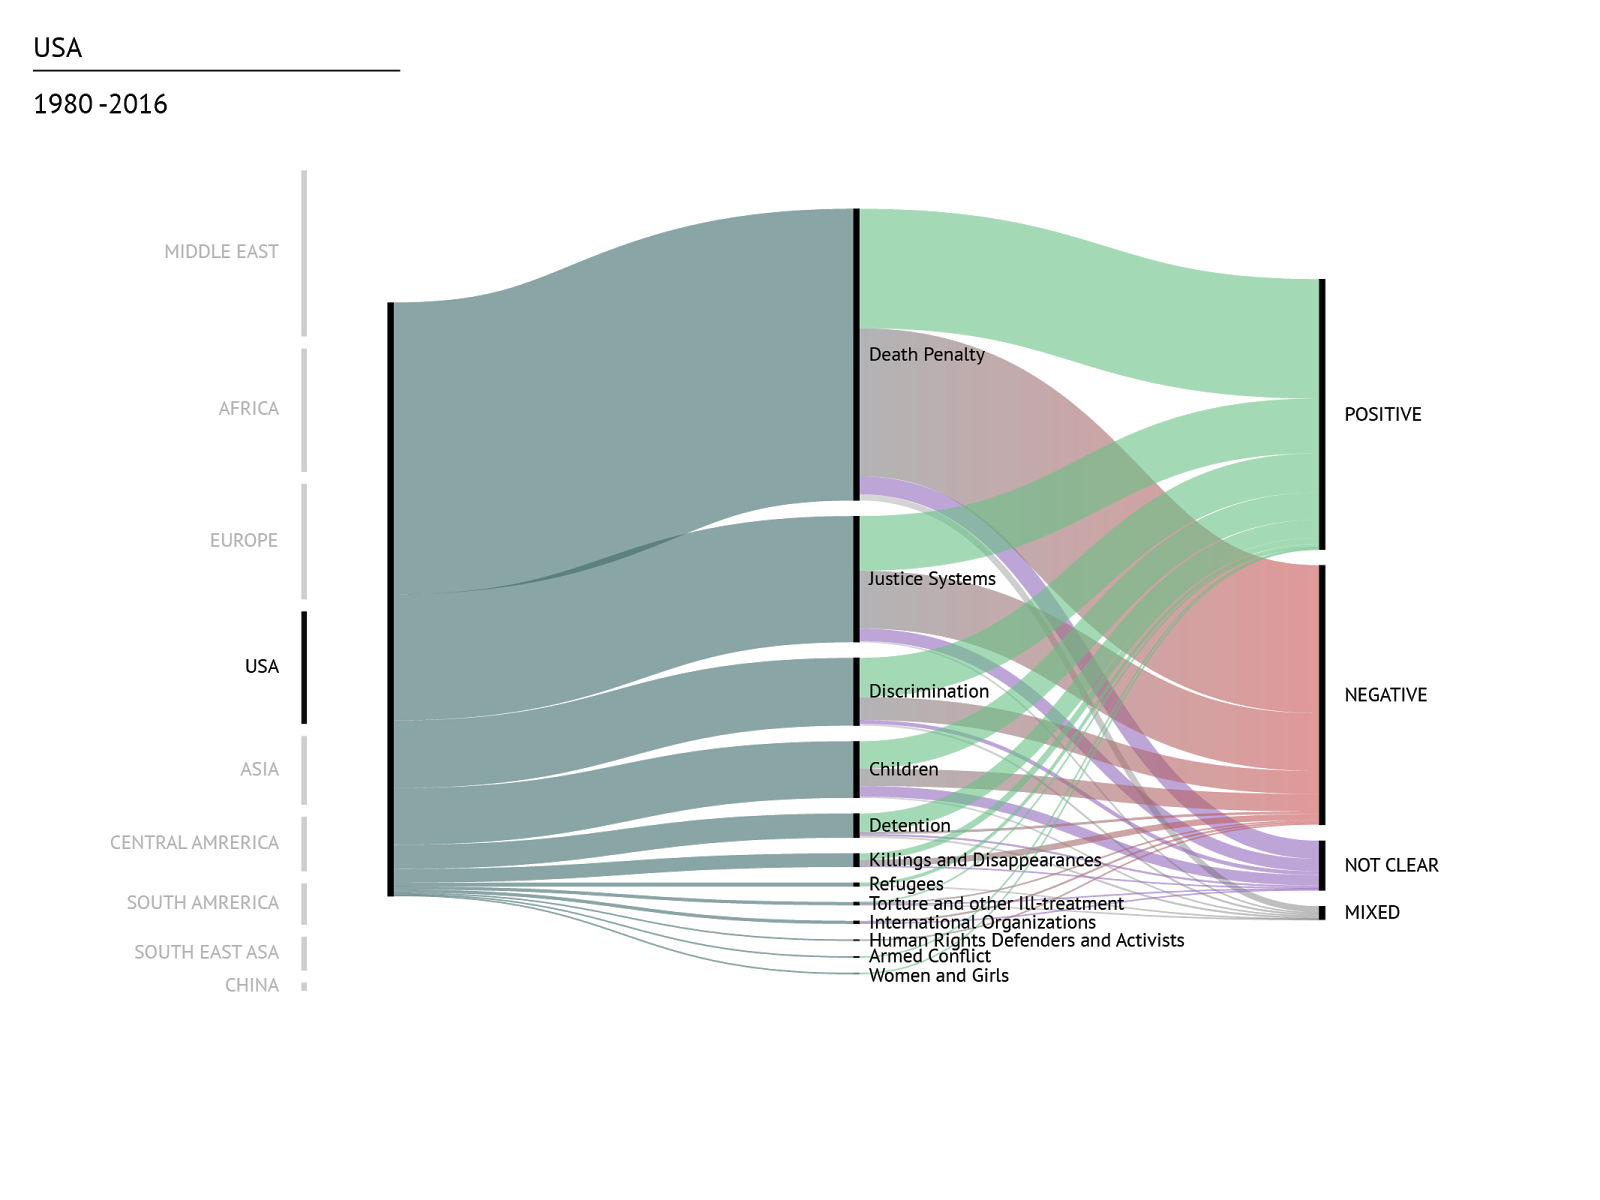
United States

The United States tops the list of countries with the largest amount of Urgent Actions (955 cases). We define a spike in number of cases as a year with 50 or more cases. In this case, there are 7 spikes in the dataset (1995, 1999, 2000, 2001, 2002, 2003, 2004). The year with the most cases is 2002 (101 cases).
The following are the most prevalent categories of cases against the US (with a minimum of 50 cases each):
- Death penalty (469 cases)
- Justice systems (203 cases)
- Discrimination (109 cases)
- Children (91 cases)
Turkey
With a total of 486 cases, Turkey is the second largest country represented in the dataset. The years with most cases in Turkey are 1994 (78 cases), 1995 (95) and 1996 (108). This period coincides with the most violent period of the civil war, when Turkish Military Forces launched several operations against the PKK (Kurdistan Workers’ Party) and the Kurdish people. This war culminated into thousands of deaths on both sides, and a massive increase of human rights violations by the Turkish Military Forces.The most prevalent categories in the dataset for Turkey, with at least 50 cases, are:
- Detention (136 cases)
- Discrimination (103 cases)
- Torture and other ill-treatment (57 cases)

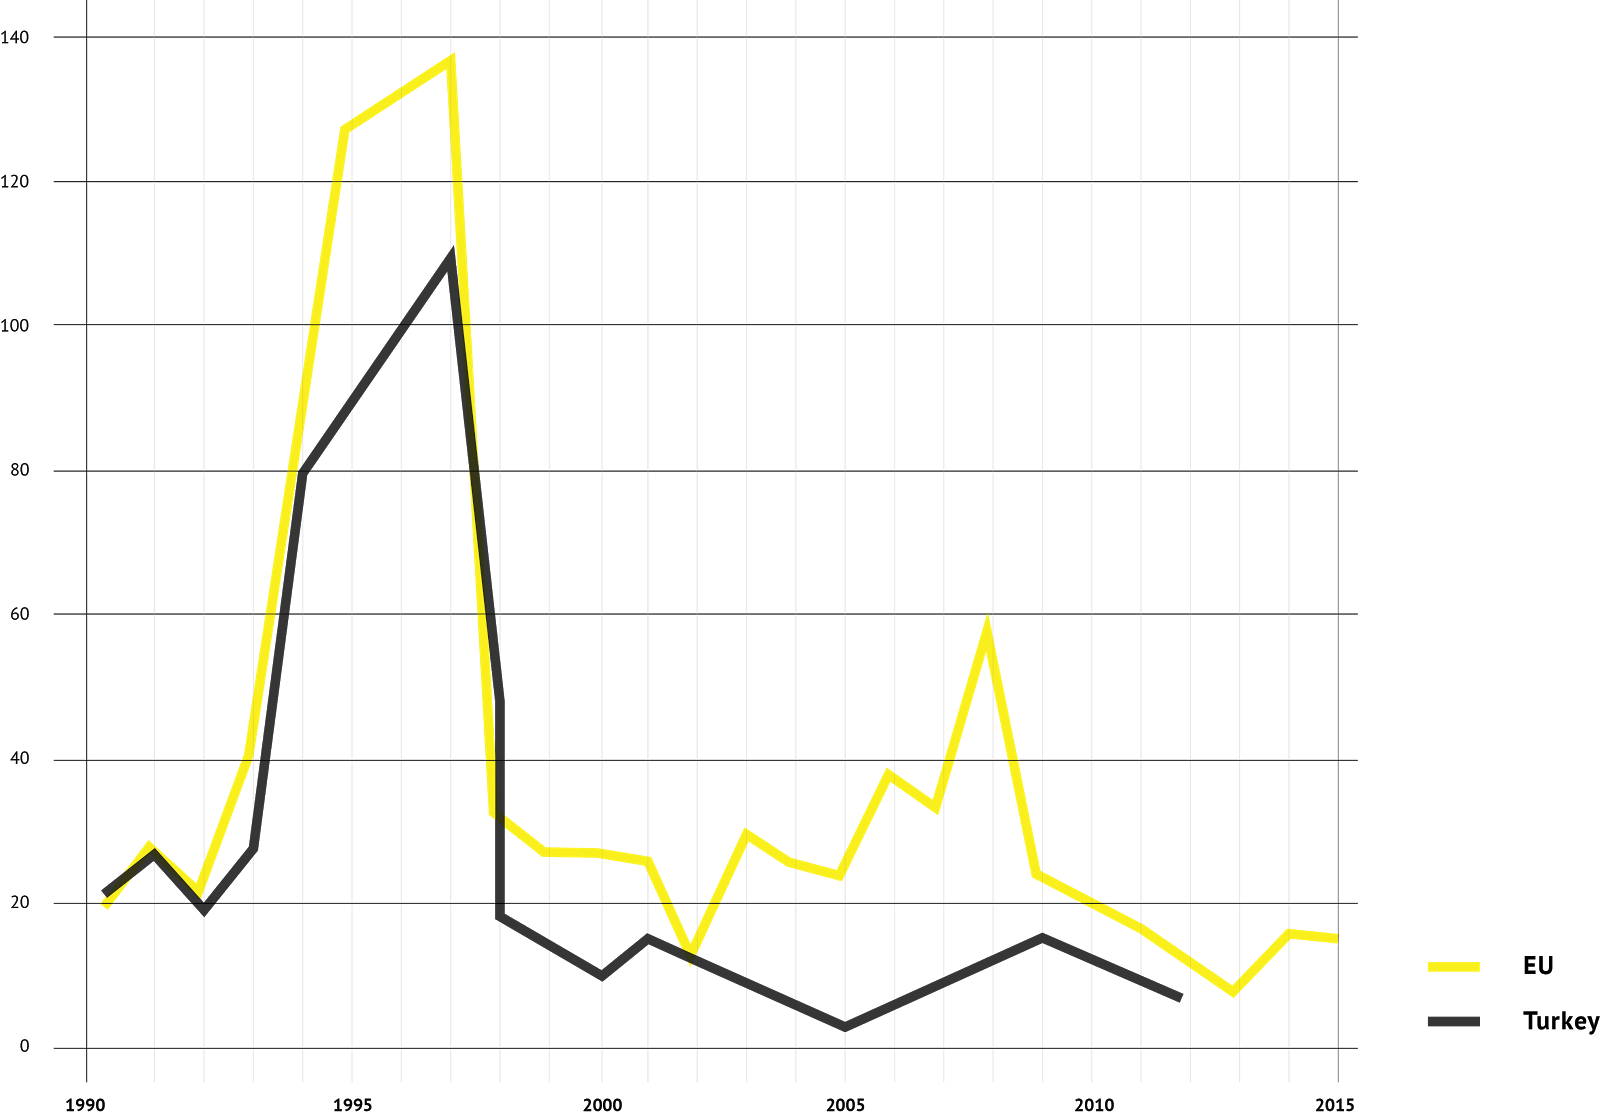
Chart comparing EU and Turkey cases
Spikes in cases concerning detention correlate with the major spikes in the full dataset; from 1994 until 1997 there are more than 10 cases against detention in Turkey per year. The same pattern emerges when we look at the category of discrimination; only from 1994 until 1996 there are more than 10 cases against discrimination in Turkey per year. The category of torture and other ill-treatment follows a similar pattern, albeit with a smaller amount of cases. Only during the period of 1994 until 1997, are there 5 or more cases against torture and ill-treatment in Turkey.
The cases against Turkey know significantly more positive outcomes than negative outcomes (10:1). In the entire dataset, there are 271 positive outcomes of cases, 27 negative outcomes, and 71 mixed outcomes.
The outcomes of the cases follow a similar temporal pattern to the entire dataset; general spikes of the outcomes coincide with general spikes of cases against Turkey. 1994 was the year with relatively most positive outcomes, when 58 cases knew a positive outcome, and 7 cases knew a negative outcome. The year with relatively most negative outcomes was 1999, when there were 4 negative cases and only 1 positive case. This was the only year in the dataset for Turkey with more negative outcomes for cases than positive outcomes.
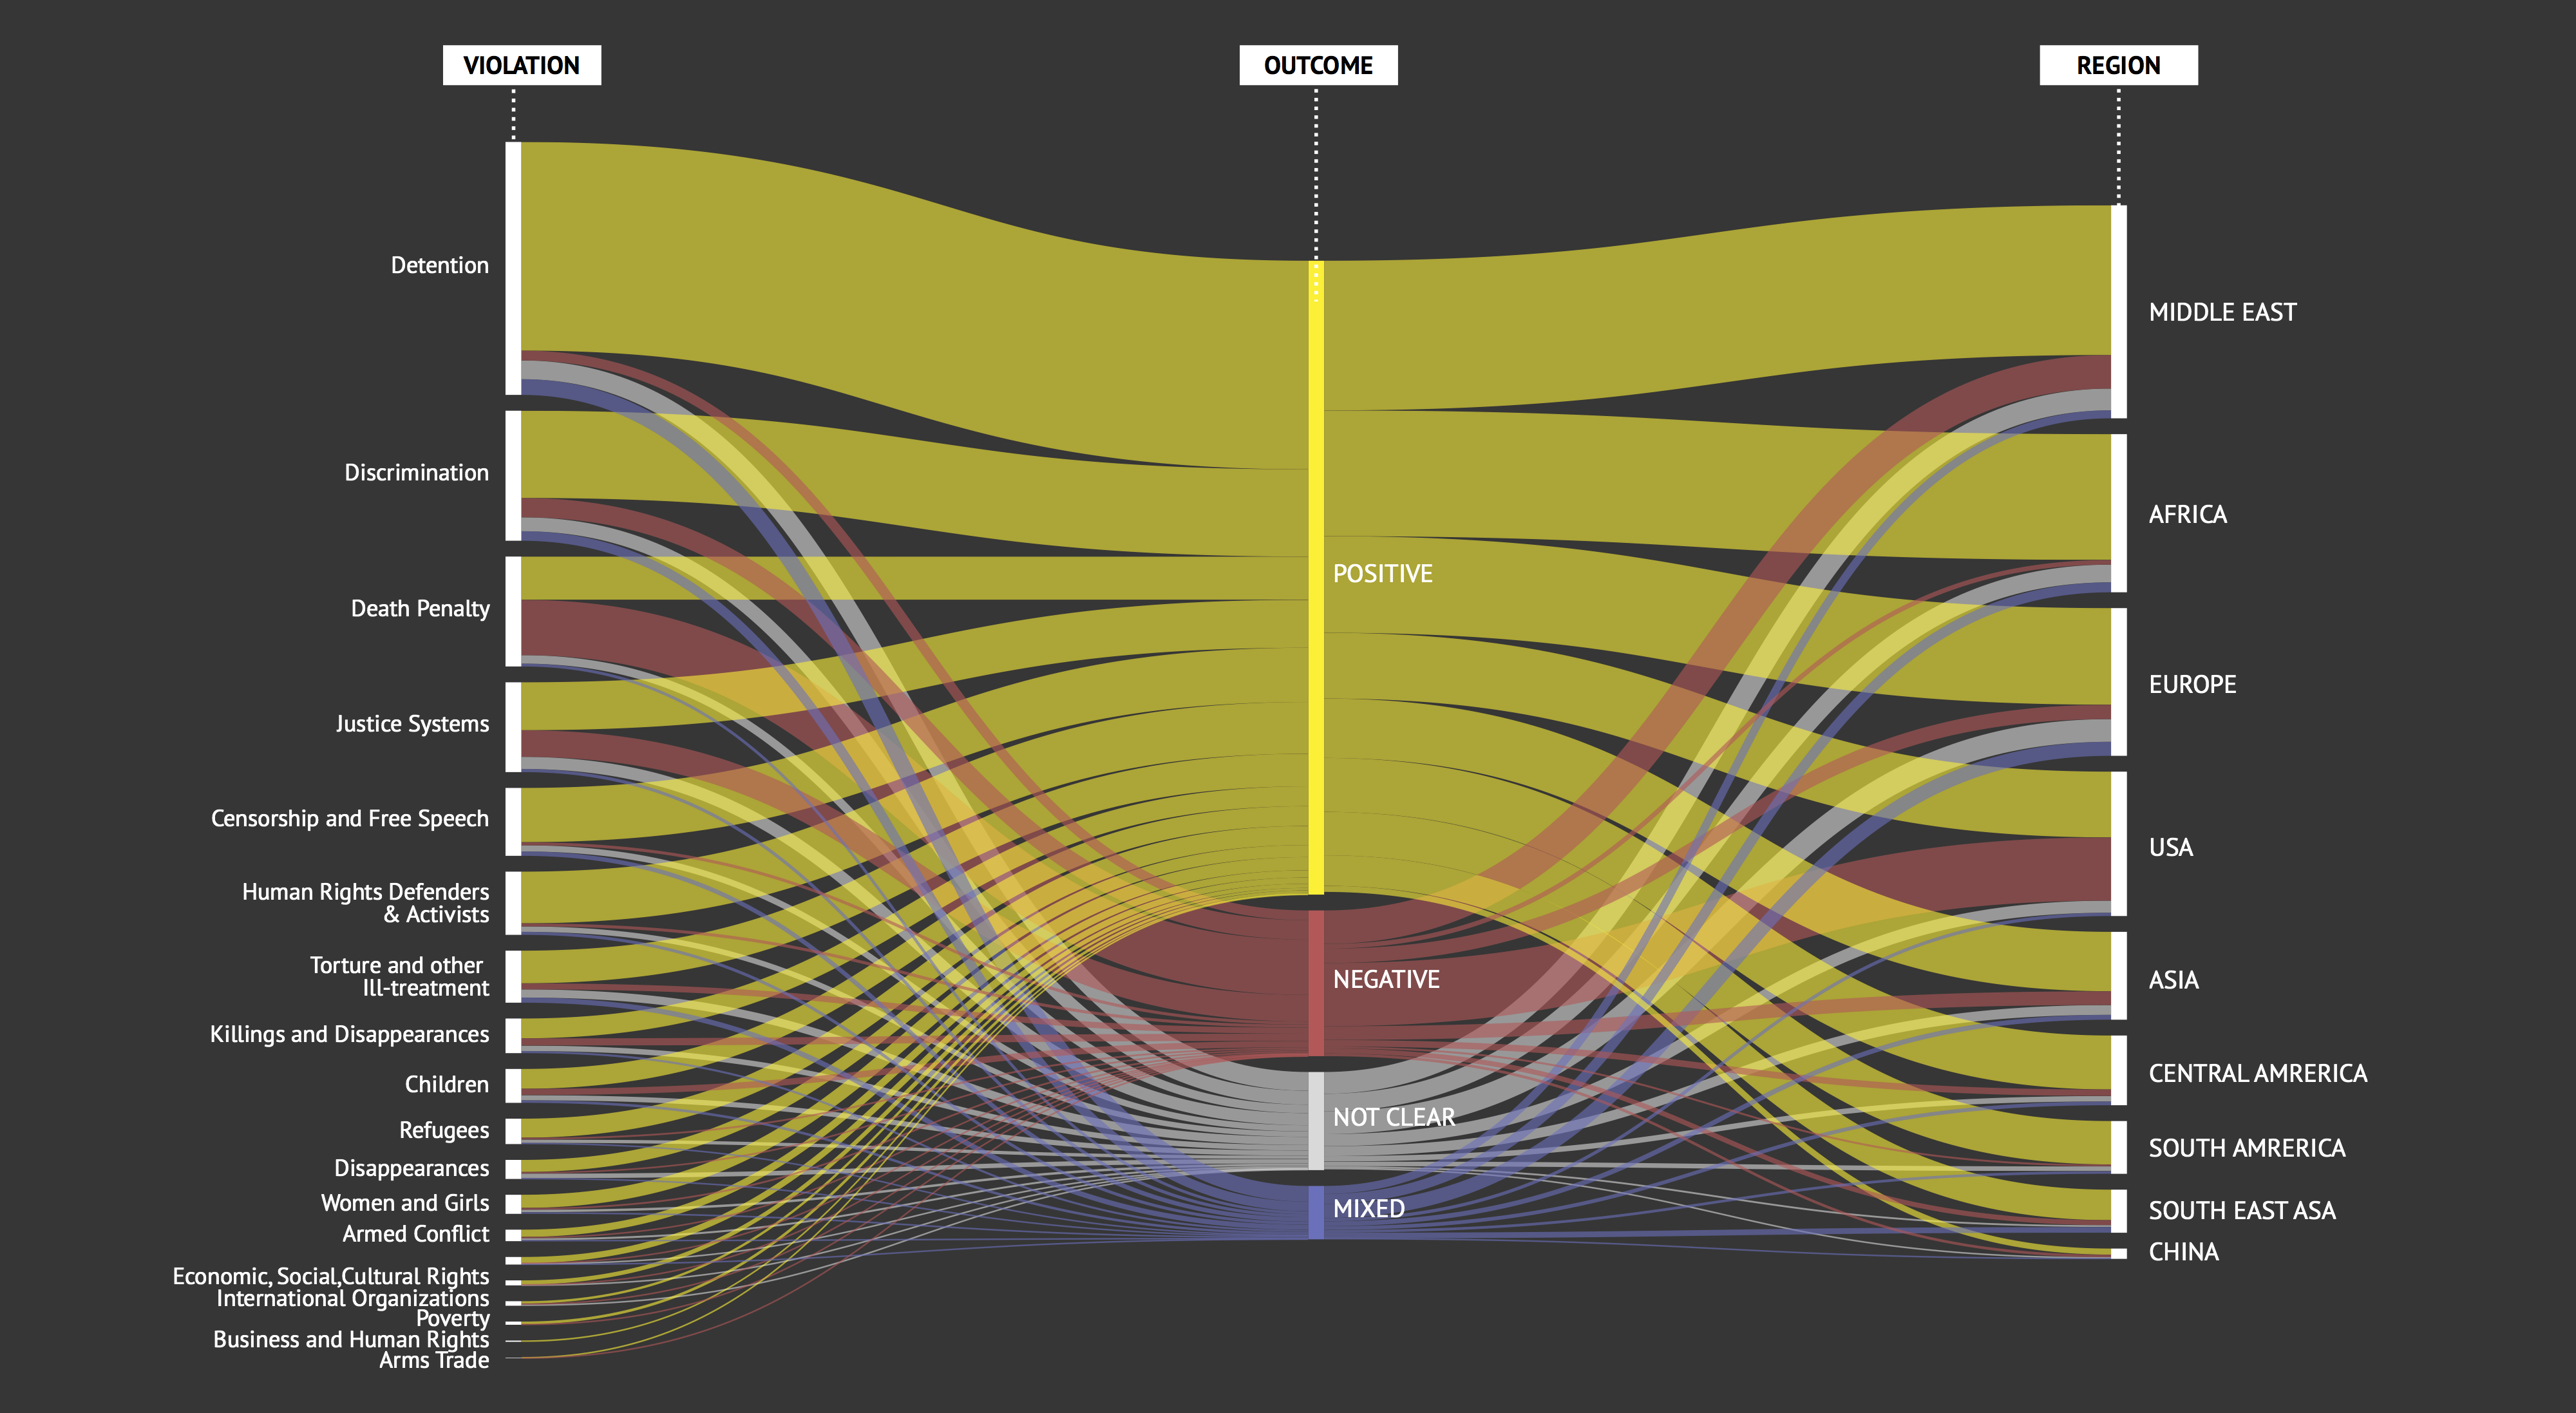
Profiling Positive Outcomes in the Verified Urgent Actions Database

Drawing on the analysis from the different parts of project, we identified three characteristics of Urgent Actions in the verified database which had positive outcomes.
1. Victim Identity: Female Individual
We ran statistical analysis of the verified dataset (using STATA software) to analyze the distribution of positive outcomes of Urgent Actions. Findings indicate that, on average, Urgent Actions’ calls for female individuals have been more successful than ones for male individuals; they also outline that, overall, Urgent Actions’ calls for individuals (so both men and women) are more successful than the ones for groups of victims. Controlling for variation across geographical regions and across categories of violations, the average statistical likelihood of a positive Urgent Action outcome for all individuals is at 67.3%. However, the likelihood of a positive outcome for a group of 2 to 8 drops to 56.1%, and for groups of 9+ it is 46.6%.
2. Category of Violation: Detention
Findings suggest that Detention and Discrimination are prevalent across individuals and groups in the dataset. Traditionally, Detention has been a prominent focus area of Amnesty International - for which reason, a vast majority of Urgent Actions were issued regarding detained individuals and groups. At the same time, Detention cases were seen to have the highest success rates across groups.
3. Geography of Urgent Action: Sudan.
As discussed above, the highest proportion of successful Urgent Actions took place on the African continent - specifically, positive outcomes were higher in Sudan.
Bibliography
Amnesty International. (2016, June). Amnesty Decoders. Retrieved from https://decoders.amnesty.org/
Benenson, P. (1961, May 28). The Forgotten Prisoners. The Observer Weekend Review. London. Retrieved from https://www.amnestyusa.org/about-us/amnesty-50-years/peter-benenson-remembered/the-forgotten-prisoners-by-peter-benenson
Bowker, G. C., & Star, S. L. (2000). Sorting Things Out: Classification and Its Consequences. Cambridge, MA: MIT Press.
Bruno, I., Didier, E., & Vitale, T. (2014). Statactivism: Forms of Action between Disclosure and Affirmation. Partecipazione E Conflitto, 7(2). Retrieved from http://siba-ese.unisalento.it/index.php/paco/article/view/14150
Buchanan, T. (2002). “The Truth Will Set You Free”: The Making of Amnesty International. Journal of Contemporary History, 37(4), 575–597. http://doi.org/10.1177/00220094020370040501
Dillon, S. (1997, October 7). A Toll of ‘Disappearances’ In Mexico’s War on Drugs. New York Times. New York. Retrieved from http://www.nytimes.com/1997/10/07/world/a-toll-of-disappearances-in-mexico-s-war-on-drugs.html?pagewanted=all Dui Ha (n.d.). Criminal Justice. Retrieved from http://duihua.org/wp/?page_id=136Gray, J., Lämmerhirt, D., & Bounegru, L. (2016). Changing What Counts: How Can Citizen-Generated and Civil Society Data Be Used as an Advocacy Tool to Change Official Data Collection? CIVICUS and Open Knowledge. Retrieved from http://dx.doi.org/10.2139/ssrn.2742871
Keck, M.E., & Sikkink, K. (1998). Activists Beyond Borders: Advocacy Networks in International Politics. Ithaca, NY: Cornell University Press.
Marin, M. (2015, October 16). How the Wisdom of Crowds Can Help Defend Human Rights. Retrieved from https://www.amnesty.org/en/latest/campaigns/2015/10/wisdom-of-crowds-defend-human-rights/
Peters, J. D. (2001). Witnessing. Media, Culture & Society, 23(6), 707–723. http://doi.org/10.1177/016344301023006002
Sikkink, K. (1993). “Human rights, principled issue-networks, and sovereignty in Latin America.” International Organization, 47(3), 411-441.
Willetts, P. (2010). Non-Governmental Organizations in World Politics: The Construction of Global Governance. London: Routledge.

Ideas, requests, problems regarding Foswiki? Send feedback