Is this Open Data Portal accessible?
Assessing the accessibility of Open Data portals around the globe: developing a methodology.Team Members
Umberto Boschi, Tommaso Elli, Phillip Morris, Oriane Piquer-Louis, Guillén Torres, Jeroen de VosContents
Summary of Key Findings
- A combination of Digital Methods allows for a comprehensive assessment of an Open Data Portal’s accessibility.
- Although Portals comply with international Standards, their accessibility varies greatly
- Although the most important element of the portals should be Data, news seems to be the category most portals emphasize.
- The organisation of some portals allows for a differentiated treatment of certain categories of datasets.
- Navigating government datasets by categories will not connect a user's to the majority of datasets available
1. Introduction
Open Data Portals are one of the main ways in which data users and data providers interact. The goal of this project was to identify mechanisms to assess the accessibility of Data Portals using Digital Methods. The project was particularly focused on tracing alternative voices to the ubiquitous celebration of Open Data, for two reasons: on the one hand, searching for contestation by both users and developers was considered as a good starting point to locate the shortcomings of Data Portals, and on the other, we were interested in identifying what elements of the critical discourse about the Open Data phenomenon (such as that built by Jo Bates) could be specifically connected to Data Portals.2. Initial Data Sets
- A collection of 1.600.000 tweets containing the hashtag #opendata, collected from 22 October 2014 to the 6th of July 2017.
- A CSV containing a list of 52,000 timestamped issues on Github, including the comments on those. Scraped with a tool developed by Tommaso Elli (user iosonosempreio on Github).
- The HTML content of 524 open data portals from dataportals.org.
3. Research Questions
How can we assess the accessibility of Open Data Portals (using Digital Methods)? Subquestion: How is contestation (from the user and developer perspectives) of Open Data Portals reflected online?4. Methodology
The members of the team selected six methodologies to assess the accessibility of Open Data Portals. Four focused on the frontend, one focused on the discussion about Open Data in Twitter, and one focused on the source code:
-
“The frontend”
-
Semantic analysis: what are portals focused on?
-
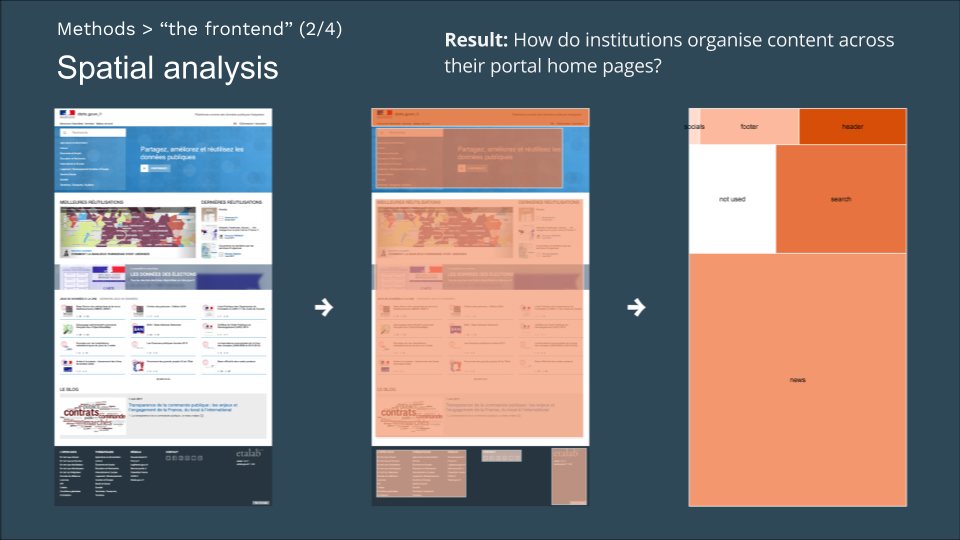
Spatial analysis: relative relevance of the different sections in the portals
-
Code intricateness: is it correlated with visual intricateness?
-
Usability.gov-style information architecture analysis.
-
-
Online talk?
-
Is the Open Data community voicing satisfaction/dissatisfaction online?
-
-
Infrastructure
-
Programming Issues: how messy is the Portal’s infrastructure?
-
The Object of Study were the following sites:
-
Data.gov.uk (United Kingdom)
-
Data.gouv.fr (France)
-
Data.gov.au (Australia)
-
Dati.gov.it (Italy)
-
Datos.gob.mx (Mexico)
-
Data.gov (USA)
-
Opencanada.org (Canada)
1. Semantic analysis
The semantic analysis focused on identifying what do the portals promise to their users through their home pages. This was carried out first by performing a quick semiotic analysis of the meaningful elements present on the webpage : content, colors, outline of the page, and the interaction of all these elements together.The goal was to have an idea about what the front pages of the data portals imply regarding their relation to data and to their user. Secondly, a word co-occurrence analysis was performed to test the preliminary conclusions. The co-occurrence analysis is a statistical analysis of the content, which consists of finding the most frequent words and the words close to them, which form semantic communities. This was achieved by scraping all the words on the front page of each portal and processing them with the software Iramuteq, which produces the following graphs:
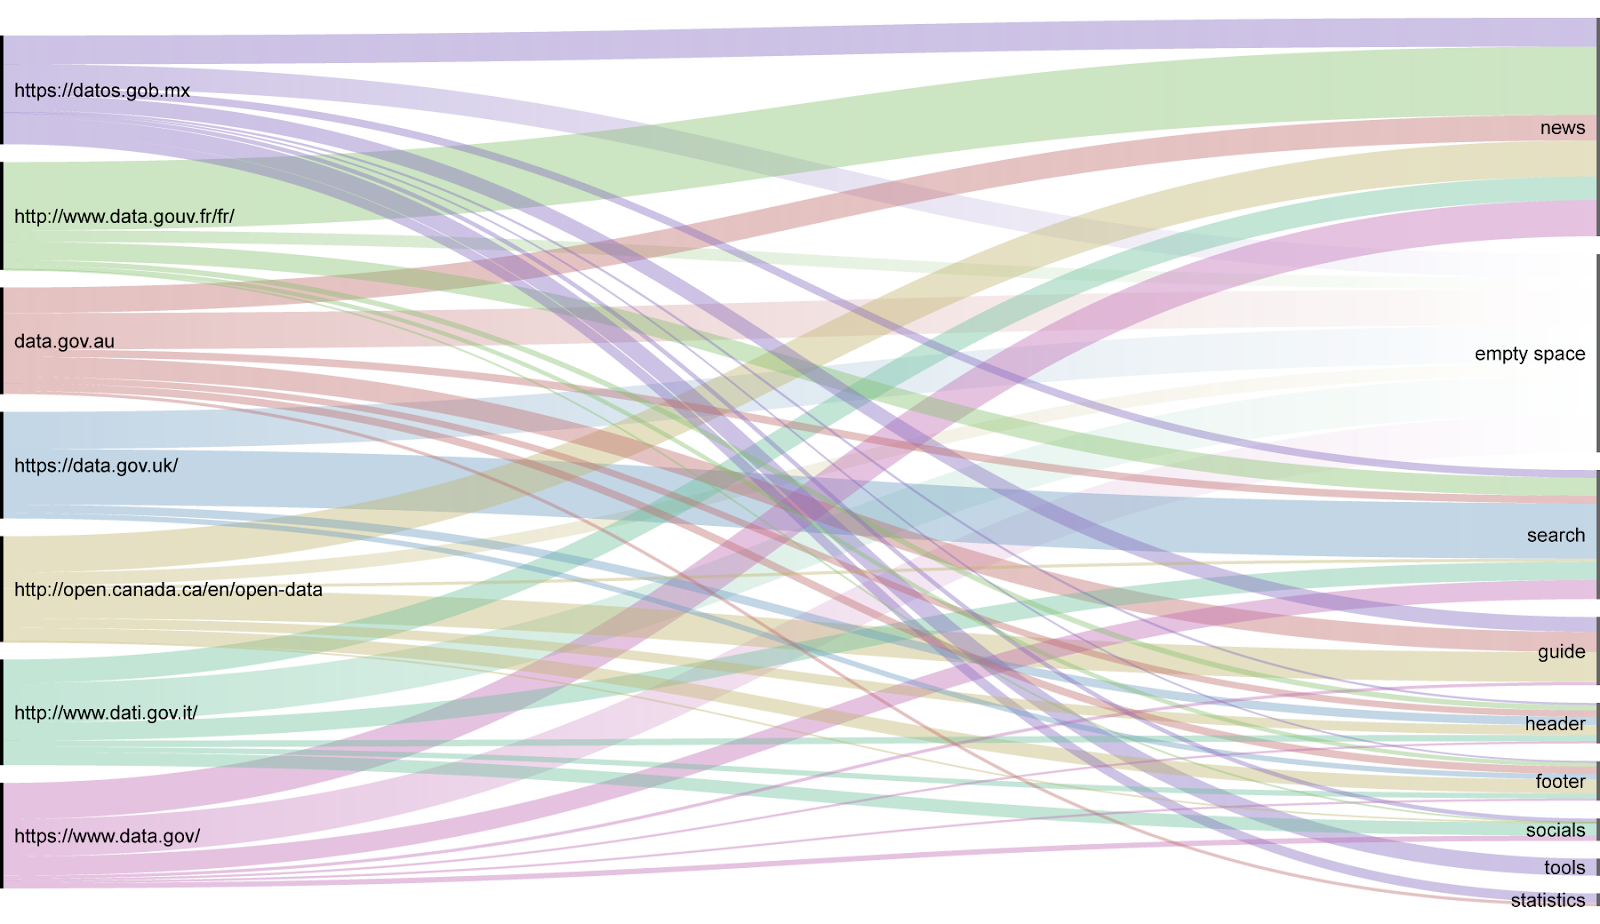
2. Spatial Analysis
This analysis consists in identifying the amount of space dedicated to specific sections of the Open Data Portals, in order to detect what relative importance is assigned to them. This was carried out by taking a snapshot of the front page and then measuring the number of pixels dedicated to each section with Photoshop.
3. Searching source-code
To embed our case studies into a larger context, we developed a method to look for front end elements in a larger set of data-portals. The ‘meta’ dataportal containing a worldwide list of data portals proved to be a great starting point. This meta portal is an initiative of Open Knowledge International, one of the authorities of evaluating government data accessibility. Their list comprises of 524 portals, which was conveniently available for download. The second step was to decide what HTML elements would be a proper unit of analyses to be able to tell something about the technical infrastructure that supports user interaction on the frontpage. We chose for the following HTML components to be queried:
-
[<img], this element is used to include any image into a webpage
-
[<nav], this snippet is an indicator of navigational elements
-
Navigation, idem.
-
[<input], this code portrays an HTML element with which users can interact
-
[<button], idem.
We put these HTML snippets into the Source Code Search Tool made available by the Digital Methods Initiative. It allowed us to query the series of 524 open data portals for these particular elements.
4. Information Architecture
The following analysis was run on the national open data portals of Australia, Canada, France, Italy, Mexico, the US. the UK. The methods for analysis, organizational scheme and organization structure, were sourced from the US government website Usability.gov. We were unable to run usability tests with a large enough sample of actual users in the timeframe of this research project so we chose to evaluate the open data portals based on their presentation of information, their information architecture.
To analyze the organizational scheme, we visited and made use of the seven open data portals. Their URLs were run through the DMI Link Ripper tool to collect the number of the links on the homepage. We then noted the total number of datasets the portal claims to contain, if those datasets were organized into categories, if those categories were represented by icons, and the number of datasets accessible navigating by categories. Additionally, we used the data portals search feature to query "co2" to test the robustness of their search engines. This query was selected because every portal contained an environment category and co2 is used to refer to carbon dioxide across languages.
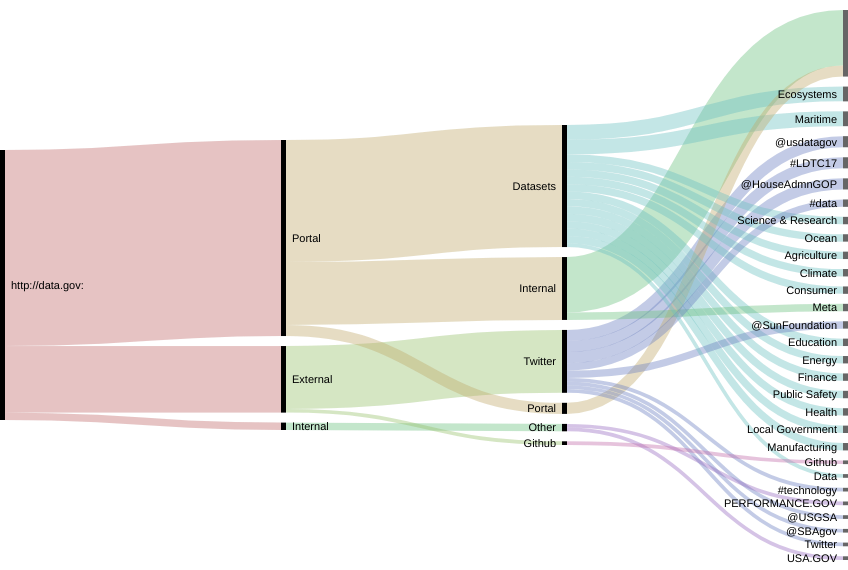
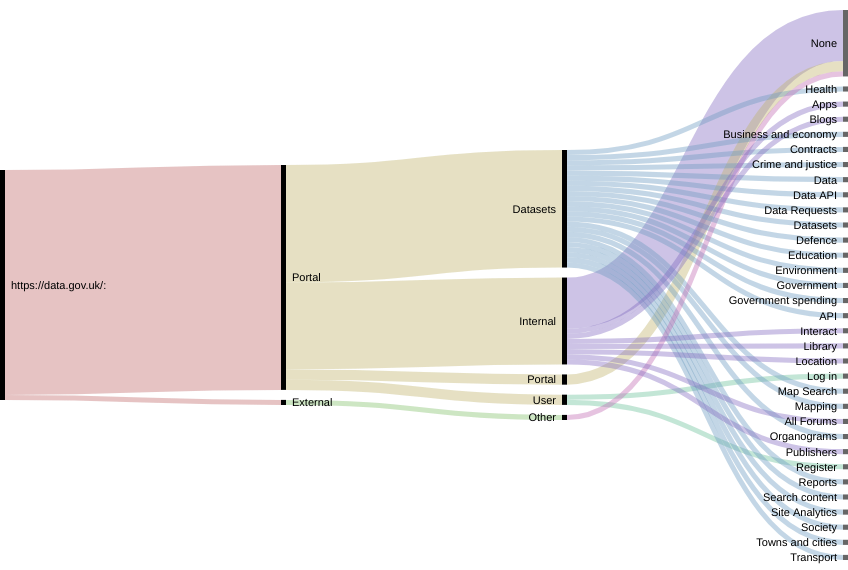
To analyze the organization structure of the portals the links on the homepage were organized in a spreadsheet and labeled based on the section of the portal they led to. The resulting site map was then visualized in a graph. This process proved to be very time consuming so it was only run on the data portals of France, the US and the UK which represented three different approaches to open data based on the organizational scheme results.
5. Online talk analysis
The goal of the Online Talk analysis was to identify how is the usage of the portals reflected in Twitter, since we could make use of a large database of tweets with the hashtag #OpenData, collected by the DMI since 2014. We were interested in locating what kind of actors are talking about Open Data online, and how do they refer to it, since we were particularly interested in detecting critiques, complaints and in general negative experiences with the usage of Data Portals.
6. Backend analysis: issues with source code
Since the only Open Data portal that makes its source code available online is the one from the United Kingdom, this method was only implemented for that site. The goal was to analyse the discussions of developers around the issues they open and resolve around the source code of the portal, to locate whether or not accessibility plays a role. To perform this analysis we scraped from Github all the issues of the 624 modules that make up the gov.uk website (of which data.gov.uk is a subset) with a tool developed specifically for this purpose by Tommaso Elli, and filtered them to keep those related to accessibility and usability. The resulting dataset was processed with the software Iramutek and graphed with Gephi.
5. Findings
1. Semantic Analysis
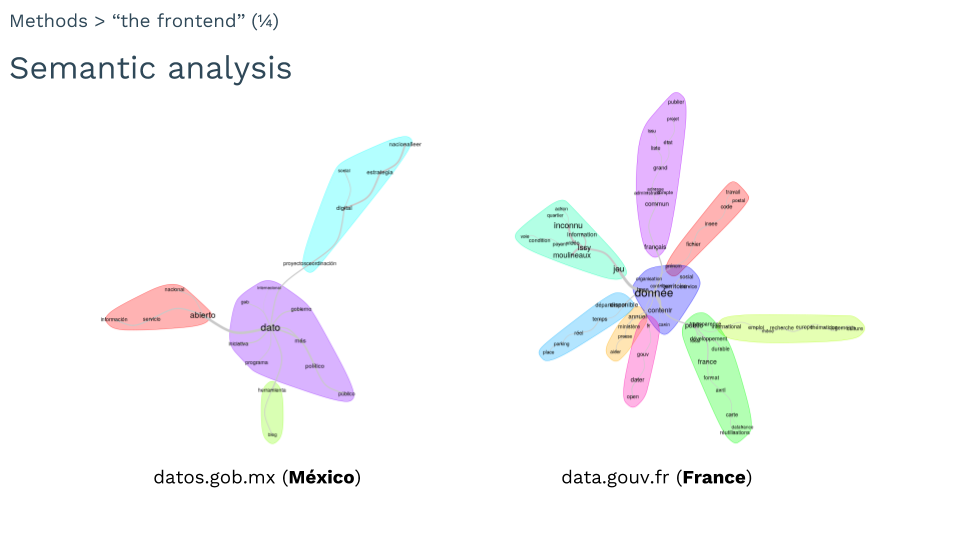
These graphs allowed us to identify the words around which the discourse of each Data Portal is built, and the connection to other relevant elements.
2. Spatial analysis
The results were plotted afterward using the RAWGraphs tools.
3. Searching source code
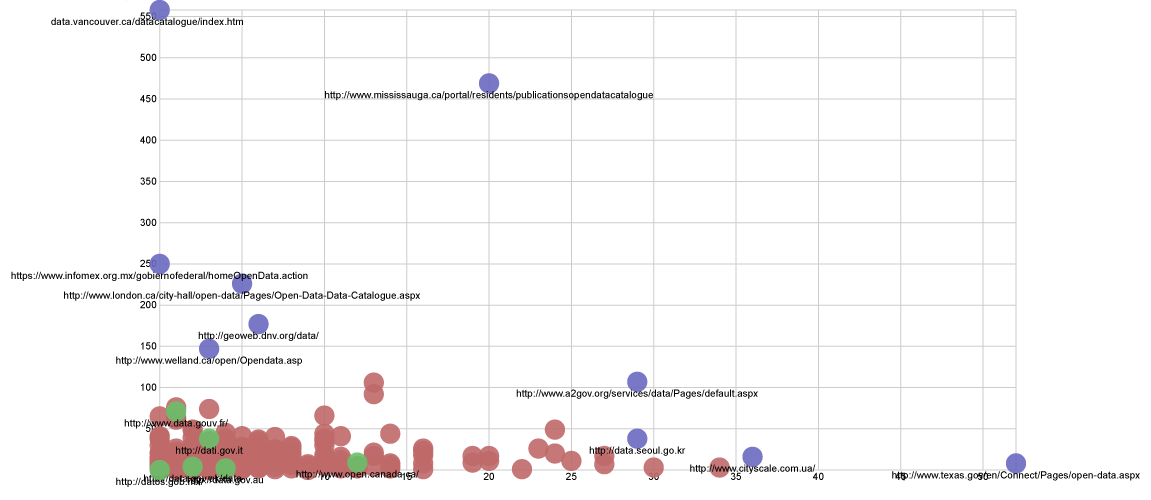
This scatterplot shows the 524 dataportals that we searched for particular HTML components. Every node is an open data portal, the X axis signifies the number of [<input] elements that were present in the source code, and the Y axis defines the number of [<img] that could be found in the code. The purple nodes could be considered outliers, and the green ones are the case-studies we look into throughout this research. The majority of the portals have less than 100 images integrated in their website, with some significant varieties. Being: http://data.vancouver.ca/datacatalogue/index.htm and http://www.mississauga.ca/portal/residents/publicationsopendatacatalogue at the top:
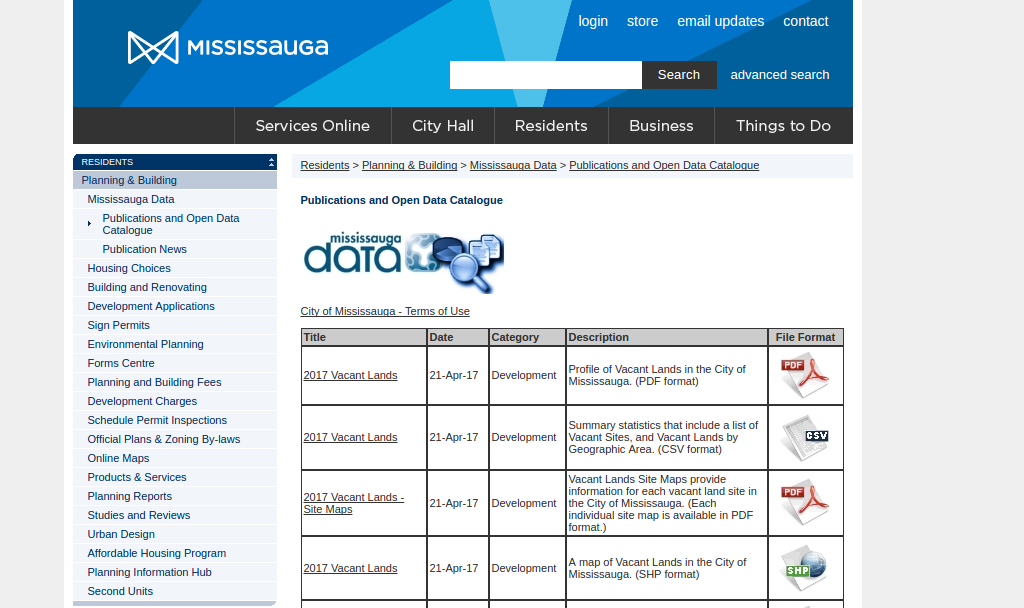

Both portals show a particular understanding of making data accessible, with the use of a catalog. It includes lists of databases and files sorts available in one interface on the front page.
4. Information architecture
4.1 Information Architecture - Organizational Scheme
The results of the organizational scheme analysis are represented in the table below. The numbers in brackets were gathered from the pages in the portal other than where the information was first presented.

Australia does not use categories to present data on the front page of the data portal. On the Datasets page the datasets are organized by Organisations, Groups, Tags, Formats and Licences. Groups seem most similar to Categories on other sites. Groups are arranged by the number of datasets they contain.
Canada does not present categories on the homepage of the open data portal. On the Open Government Portal, one click beyond the home page, the datasets are organized by Portal Type, Collection Type, Organization, Keywords, Subject, Format, Resource Type, Maintenance and Update Frequency. The subject seems most similar to Categories on other sites, and are arranged alphabetically. France presents a list of dataset categories below the search bar at the top of the page. It does not give the number of datasets in each category. On the Datasets page the datasets are no longer arranged by category, instead they are organized by Organisations, Badges, Tags, Licenses, Temporal Coverage, Spatial Coverage, Territorial Granularity, Formats, Reuses. None of these seemed to clearly relate back to the original categories. Italy presents a group of dataset categories with icons and text on at the top of the data portal just below the search bar. On the website categories are referred to as Themes. The Dataset page shows the number of datasets housed under each Theme, and arranges the Themes by the number of datasets. The themes retain their icons and text from the front page. In addition to ‘Themes’, the datasets can be filtered by Organizations, Formats, and Licensing. Mexico presents its categories of data sets at the top of the page below the search bar with icons and text. If gives the total number of datasets and the total number of institutions providing datasets, but not the number of datasets per category. The Dataset page provides the number of datasets per Category. There is no icon with the Category text, and they are arranged by the number of datasets they contain. In addition to ‘Categories’, the datasets can be filtered by Level of Government, Organizations, Groups, Tags, and Formats. The datasets page is missing the Energy and Environment category preset on the front page. Selecting the icons on the frontpage presents information specific to that category, and also provides a different count of the relevant datasets. These pages showed significantly more datasets per Category for all categories except Security and Justice which went from 14 to five. The US presents fourteen categories as Topics near the top of the page, below the search bar. The topics are given with icons, and text. The front page gives the total number of datasets, but not the number of datasets per category. The Datasets page removes or renames some topics and adds others, so the list of Topics on this page differs from the front page. For example, Public Safety was changed to Safety, and Law has been added. In addition to Topics datasets can be sorted by Location, Topic Categories, Dataset Type, Tags, Formats, Organization Types, Organizations, Publishers, and Bureaus, all of which can arrange their subsets alphabetically or by the number of datasets they contain. The UK presents twelve categories of datasets below the search bar, using only text. The category is resented as Themes with a name and description. The themes are arranged alphabetically in columns instead of by rows as was normal for other sites. The front page of the data portal does not give any counts of the total number of datasets available. The Datasets page gives the total number of datasets, and the dataset per filter category. The Themes of Crime & Justice, and Defence are not represented on the Datasets page list of themes, however they can be selected from the from the front page. In addition to Themes the datasets can be filed by Published Status, Collection, API, Licence, Resource Format, Publisher, Schema/Vocabulary, Code Lists, Openness Score, Broken Links, and UK Location Dataset Type. All of the dataset filter options are arranged by the number of datasets they contain.4.2 Information Architecture - Organization Structure
The results of the analysis of the organization structure for the data portals of France, the US and the UK are represented in the following visualizations.
Result: France http://www.data.gouv.fr/ 269 total links 249 internal links, 20 external links

Result: US https://www.data.gov/ 77 links 56 internal links, 21 external links
Result: UK https://data.gov.uk/ 45 total links 44 internal links, 1 external links
Search Results
Australia has one search bar on the data portal. Searching for co2 returned 25,535 datasets.
Canada has two search bars. The first is at the top with “Search Canada.ca” in the search field. This search returns 9,650 results from multiple websites in the .ca domain. The second bar is below the headers with the text “Search through our Open Government Portal.” above it. This search bar returned 57,943 datasets automatically restricted to those with an Open Data tag.
France has one search bar with the text “Search” in the search field. This search bar returned 21 datasets for the co2 query and 3 reuses of relevant datasets.
Italy has one search bar below the headers on the page with the text “ Look up the data of the public administration” in the search field. Querying co2 returned 59 datasets.
Mexico has one search bar with the text “Ex. schools” in the search field. Search results for co2 did not state the total number of search results. Instead in the area where this might have been displayed was the text “25,804 Data in data.gob.mx”. The first page contained 20 results, this was multiplied by the total number of pages minus the difference between the number actual results on the final page and 20. This lead to the conclusion that there are 626 datasets captured by this query.
The US has one search bar that cycles through a selection of example searches in the search field, for example “Credit Card Complaints”, “Monthly House Price Indexes”, and “Federal Student Loan Program Data”. Searching for co2 returned 169,747 datasets, and includes the option to expand the search to the entire data.gov site.
The UK data portal has two instances of the same search bar. The first is small and is included on the right side of the header. The second is much larger and is included on the left side of the page below the header. Searching co2 in either will return the same 28,421 results.
The results of the search analysis reveal that for many governments the majority of their data sets are related to the issue of climate change.
5. Online talk analysis
6. Backend analysis
Since Github allows developers to label the issues they open, we could locate the relative importance of different topics. As the following graph shows, the most frequent label was “bug” (the bigger the bubble, the more occurrences of each label, and the darker the color, the more comments for each issue), however, User Experience (UX) also plays an important role.

A key limitation of this analysis was, however, that Github doesn’t force developers to label the issues they open. In this sense, the labeled issues represent a small percentage of the total of issues opened. In an attempt to overcome this difficulty, we isolated all the issues in which the world accessibility was mentioned, to create a bigger database of issues related to the topic. The number of issues related to this topic is rather small, representing around 0.5% of the total issues opened or closed, which means that it is not a relevant problem from the developer’s perspective.
The following graph shows the relationship between the words contained in those issues. It makes evident that, within the discussion about accessibility, data and user are the most important concepts, since they are strongly related.

However, we cannot conclude from the graph the type of relationship these concepts have without taking a closer look at the text of the issues. What we can say is that the relation between data and users is of considerable importance within the developers’ work.
6. Discussion
From this approach, we were able to reach one sure conclusion, and one area of concern. The conclusion that, except for Canada, navigating government datasets by categories will not connect a user's to the majority of datasets available. For four of the seven data portals examined there was a difference between the categories presented on the front of the data portals and the categories present on the page the contains the actual data set.The area of concern relates to the data.gov.uk website, which appears to have made deliberate efforts to make datasets related to the categories of Crime & Justice and Defense, less accessible.
The first piece of evidence leading us to this conclusion is the arrangement of themes of the data portal. When other websites arranged categories alphabetically it was done using a horizontal orientation, so a new line was created for categories that could not fit in the first line. The UK website uses a vertical orientation, so that extra categories create a new column. By examining the HTML code we discovered that the list of categories was deliberately split to be three groups of four categories. The first group contains the categories: Business & Economy; Crime & Justice; Defence; and Education. If the categories were arranged horizontally then Crime & Justice, and Defence would be read on the first line of the page, instead of the second and third.
The second piece of evidence that Crime & Justice, and Defence and deliberately being made less visible they are not included under the Theme filter on the Dataset page, whereas every other category is listed. The only way to browse through these categories is to select them on the homepage, which then isolates the presented datasets to only that category.
The deliberate choices to arrange the categories in a way that makes them less visible, and to exclude them from the Dataset page, both work to make these categories less accessible than they otherwise would be. Why the UK government would want to make these categories less accessible cannot be determined from a website analysis alone.
7. Conclusions
From the semantic analysis of the website we could conclude that Open Data portals build a discourse centered around promoting the usage of the data they provide, which is in line with the principles of Open Government. However, from the other methods of analysis we discovered that Portals do not fulfill this goal in the best possible way. From the spatial analysis it became evident that most websites privilege the “news” section over other parts of the portals which are more strongly related to data provision. Through the source code analysis we could see that most portals have a more intricate structure than necessary, including large quantities of images or user input controls that make their navigation less intuitive. A similar conclusion emerges from the analysis carried out following the guidelines provided by usability.gov, which made evident that the categorisation of data plays a particularly important role in its accessibility, as does the way in which the categories are presented to the user. The analysis of the issues with the source code opened by the developers shows that, although accessibility is not one of the most relevant topics of discussions, there is a strong connection between the concepts of user and data.
The analysis of the online talk about Open Data is consistent with the finding that portals privilege the news section, since most of the discussion in Twitter consisted more of institutions talking about the benefits of Open Data, and less about its uses.
8. References
Home | Usability.gov. (n.d.). Retrieved 21 July 2017, from https://www.usability.gov/
Knowledge, O. (n.d.). DataPortals.org - A Comprehensive List of Open Data Portals from Around the World. Retrieved 21 July 2017, from http://dataportals.org/
Open Knowledge: Home. (n.d.). Retrieved 21 July 2017, from https://okfn.org/
RAWGraphs. (n.d.). Retrieved 21 July 2017, from http://rawgraphs.io/
U.S. Department of Health & Human Services. (2017) Methods. Usability.gov. Retrieved 6 July 2017, from https://www.usability.gov/how-to-and-tools/methods/index.html
Source Code Search. (n.d.). Retrieved 21 July 2017, from https://tools.digitalmethods.net/beta/sourceCodeSearch/
Topic revision: 21 Jul 2017, JedeVo
Ideas, requests, problems regarding Foswiki? Send feedback