Team Members
Tacyana Arce, Becky Cachia, Iria Garcia, Gijs van der Grinten, Jakko Kemper, Danny Lammerhirt, Soenke Lorenzen, Alessandro Piscopo, Sage Stargrove.
Introduction
Mapping the Greenpeace Nazca Lines crisis - A multi-platform discourse analysis regarding Twitter, Facebook and online news media.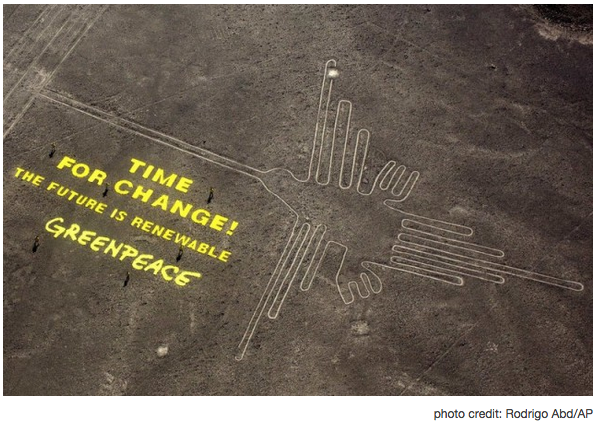 fig. 1 - Photograph of the banner laid in the vicinity of the Nazca Lines by Greenpeace
The 20th Conference of Parties (COP 20) was held in Lima, Peru in December 2014. The COP is part of the annual negotiations on climate politics concerning the Kyoto protocol and is organized by the United Nations Framework Convention on Climate Change (UNFCC). Based on the reports of the Intergovernmental Panel on Climate Change the COP´s goal is to set political guidelines to reduce the impact of climate change (UNFCC). On the 8th of December 2014 Greenpeace International put a banner on the Nazca Lines to raise awareness for a transition towards renewable energy while COP was still ongoing. The activists laid massive yellow cloth letters reading: Time for Change! The Future is Renewable. The Nazca Lines are large figures which depict creatures, plants and mythical figures. Roughly 15000 to 2.000 years ago the lines were etched on the surface of the ground and are believed to have been used for sacred rituals related to astronomy ( The Guardian).
The stunt ignited controversy after the activists hiked through the Peruvian desert and entered a prohibited area. Greenpeace and its activists were accused of damaging the sacred and cultural site of the hummingbird geoglyph, which is listed as a UNESCO Heritage Site. The news made headlines and spread quickly from Facebook and Twitter to traditional and online news sources. Although the organization posted an apology on Facebook and acknowledged the act on the day of the event and sent out an apology statement two days after the event on the 10th of December 2014, the backlash was only subdued after Kumi Naidoo, the Executive Director of Greenpeace International, released a video statement on the 16th of December 2014 (Greenpeace, Press Release: 2014). The video can be seen on the Greenpeace Twitter and Facebook, along with YouTube. Dr. Naidoos visit and televised apology in Peru quieted down the scandal. Currently, investigations are being conducted to find out the extent of the damage caused to the Nazca Lines and the possible ramifications.
The online response to the stunt had primarily negative reactions due to the speculation that the Nazca Lines were in fact damaged (Eshelman); negatively affecting Greenpeaces environmentally friendly image. According to the organizations website, Greenpeace exists because this fragile Earth deserves a voice. It needs solutions. It needs change. It needs action! (Greenpeace: What We Do). As an organization that focuses on promoting the health of the planet, it was important for Greenpeace to analyze the development of the online discourse, especially with such a high level of unfavorable responses. This paper aims to contribute to a better understanding of how such crisis situations reverberate and how organizations like Greenpeace might strategically intervene by formulating an answer to the research questions detailed below.
Hence, we formulated a set of research questions. Firstly, we asked how the debate about the Nazca Lines crisis is reflected by the user´s engagement with online content on Twitter and Facebook and online news. This question implies an analysis of which actors are involved in the discussion, and which content circulated most across which language spheres through sharing and commenting practices, amplifying which story angles over time. The second research question asked which influence Greenpeace´s official statements on the action had on diverting the negative story angle to a more balanced one. Thereby we regarded how Greenpeace´s position on the story got traction over time. Answering these questions may contribute to understand how Greenpeace could have been managing the crisis more effectively.
Digital methods were applied to answer these questions. This allows for a repurposing of a digital platforms´s embedded functions and aims at a recombined use of digital objects on online platforms, that is the medium specificities (Rogers, 1). Repurposing and combining these objects enables researchers to analyze how the medium itself works and authors human actions or how social trends may be reflected on the medium (Rogers, 1-2). This concept may be applied to various digital media sources and their distinct properties. In our case, we regarded three types of online media and tried to find out how they may reflect a societal trend, namely a critical debate about Greenpeace´s Nazca Lines action. The online media comprised a data set of Twitter tweets, Facebook pages and posts and online news media articles.
Online news media indicate how news sources are relaying information to the public. They contain medium-specific recommender systems employing several rating mechanisms like "most commented" or "most blogged about" (Rogers, 30). Since these recommendation systems are linked to commenting and sharing practices, numbers of shares and comments may be applied to analyze how a story gains relevance for users, that is how comments and shares contribute to highlighting information on a media page and therefore spreads.
Facebook as a social networking website allows to create personal profiles connecting with other profiles and socially derived recommendations to build up a personal network (Rogers, 154). As Rogers argues such a network encourages social activities since one´s own activity on Facebook, be it a wall writing or a comment, boosts the own presence on a friend´s page (Rogers,156). Thus the more actively a user shares, comments or likes, the more visible he/she will become in the own personal network but also beyond its boundaries through further likes and shares. In these regards sharing, liking and commenting are indicators of a news story´s virality on Facebook.
With 140 characters Twitter, an online micro-blog, allows users to create a dialogue and tell a narrative. Currently, the platform has 284 million monthly active users tweeting 500 million tweets per day (Twitter). Since it began in 2006, Twitter has grown from a platform for updates to a platform used for sharing information easily. Twitter is a state of affairs machine because it invites a deeper-look into current events (Rogers, 4). The micro-blog offers users and visitors the opportunity to read an account of an event as written by someone who was there, or who has some knowledge of or access to the event. Due to this, it is often considered a platform for alternative journalism (Borra and Poell, 698-699). Twitter offering insight into the perspectives of individuals in the world, those around them and/or current events, makes Twitter a snapshot of public opinion and discourse.
Methodology
We analyzed three data sets of Facebook, Twitter and online news media provided by Greenpeace International which were collected applying keyword scraping and extracting content which contained the keywords Greenpeace and Nazca, looking for Nazca in different types of spelling. The data set ranges from the 1st of December 2014 to the 13th of January 2015. The online news media data consisted of 10.355 articles, the Facebook data set contained 11.812 posts and the Twitter data comprised 89.209 tweets with 60.126 unique users. Considering online news media articles were explored to find the top 10 articles for each of the following categories: top articles by total engagement, top articles by Facebook shares, top articles by Facebook likes, and top articles by Twitter shares. These categories were chosen in order to attain a picture of the most popular content circulating through these new media channels. Total engagement here describes the sum of likes and shares per article. Using Excels Pivot Table function articles URLs could be ranked according to the aforementioned categories. The articles were manually categorized according to the following variables: Domain, Title, Publication, Publishing Date, Country, Language, Categories (i.e. to what sort of publication does the web page belong), Comments (i.e. any further relevant information the researcher wants to add), Actors (i.e. which actors in the event were explicitly named), Post type, Sentiment (i.e. to what extent did the publication explicitly criticize Greenpeace). These categorizations were then entered into another excel file, allowing the researchers to cross-reference and trace any emergent patterns or idiosyncrasies.
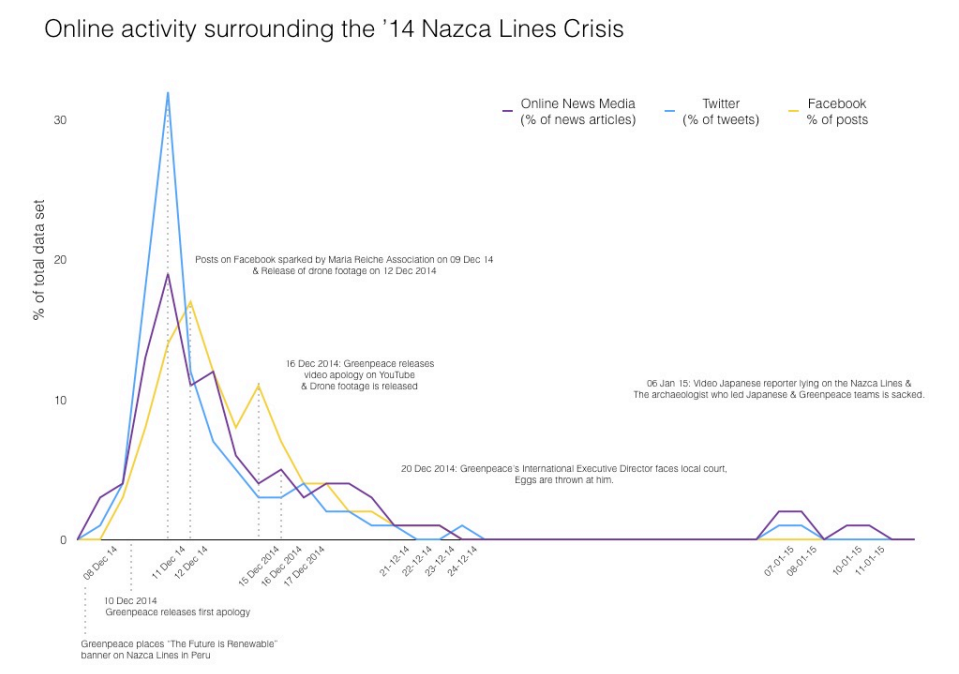
fig. 2 - Graph detailing the online activity surrounding the Nazca Lines incident
The Facebook data set was firstly clustered. Categories that were deemed unnecessary were removed. The final data set contained the date of the post, information about content, the original URL, the posts language, number of likes, shares and comments on the post, number of followers for the posts author, user name and gender as well as location (country, region and city). In order to narrow down the relevant time span the post activity per day was compiled by organizing the data set according to date (from least to most recent). From there, the number of posts per a day was extracted for the dates between the 8th until the 19th of December 2014. This data was compiled to show when the topic was the most posted about and when these postings began to drop in numbers.
To answer the first research question we regarded Facebook pages that dominated in terms of number of posts per profile and the amount of engagement per profile. Engagement was measured as the sum of shares and comments on a page or a Facebook post. Comments and shares may serve as indicators of a higher level of commitment to the content since users decide to take action beyond a single click (as with liking). Also shares and comments indicate virality of a story as they function to broadcast content to the personal social network on Facebook via the newsfeed. Furthermore, the engagement with the issue and the most popular content over time were sorted by date and language of post. Analyzing the engagement over time across languages serves to map how different Facebook audiences were gradually interested in the issue and which audiences rather neglected it. Then a chronology of the most popular Facebook posts, that is posts which accumulated the most shares and comments, was built, separating the data set in single spreadsheets per day, ranging from the 8th to the 25th of December. By analyzing the raw data and putting these in a Pivot Table in Excel, two separate lists of languages and URLs were arranged in a descending order going from most shares and comments to least. We then went to each specific URL for the top comments and shares and documented the Facebook post taking a screenshot. By organizing these pictures according to dates a timeline of the most popular content could be established. In order to track how Greenpeace content was shared and responded to, the list of top posts in terms of shares and comments was analyzed, looking for days when users were mainly engaged with Greenpeace content. Especially important were the 10th and 11th, as well as the 16th and 17th of December since these days immediately succeeded the two Greenpeace apology statements. At the same time, we regarded if top content of the day that did not come from a Greenpeace source referred to official Greenpeace postings, thus increasing the visibility of Greenpeace´s standpoint.
The Digital Methods Initiatives Twitter Capture and Analysis Toolset (DMI-TCAT) was used in order to filter the tweets for analysis. Firstly, the data set was plotted across a timeline from the 7th of December 2014 to the 12th of January 2015. To do so, the number of tweets for each day was normalised as a percentage of the whole data set for a more accurate comparison with the other two data sets. Identical tweets or retweets (RT) were downloaded from the DMI-TCAT in order to be analysed as being representative of the most popular content shared on Twitter (through this data sample) at this time. The RT´s were categorised according to language, with English (747), Spanish (1, 462) and Japanese (476 RT) being the most numerous. We translated Japanese and Spanish retweets in Google Translate (aware of the shortcomings of translations done in this way). We ran each language set of retweets through the DMIs Tag Cloud generator in order to gain a crude understanding of the key issues in each languages Twittersphere via the most frequently used words in each data set. We then analysed the word frequencies, opting to omit words alluding to opinion-based descriptions like good or bad as well as words that could not clearly be categorised as issues, such as cause. We used a top down approach by analysing words that occurred more than 40 times in the retweets. Following this analysis we then also decided to use a bottom up approach by analysing the words that were used less than 40 times but more than 10. To gain a deeper understanding of the most popular content, we also read the 10 most retweeted tweets in each language, categorising the content of the tweet according to an emergent categorisation method. Later the URLs shared in these retweets were analyzed in order to establish which external sources are being pulled into the Twitter discussion. Eventually the findings to the 10 most mentioned profiles in our retweets, also reading further into each profile in order to gain a deeper understanding of the user landscape within this data set.
Findings
Findings: Online news media
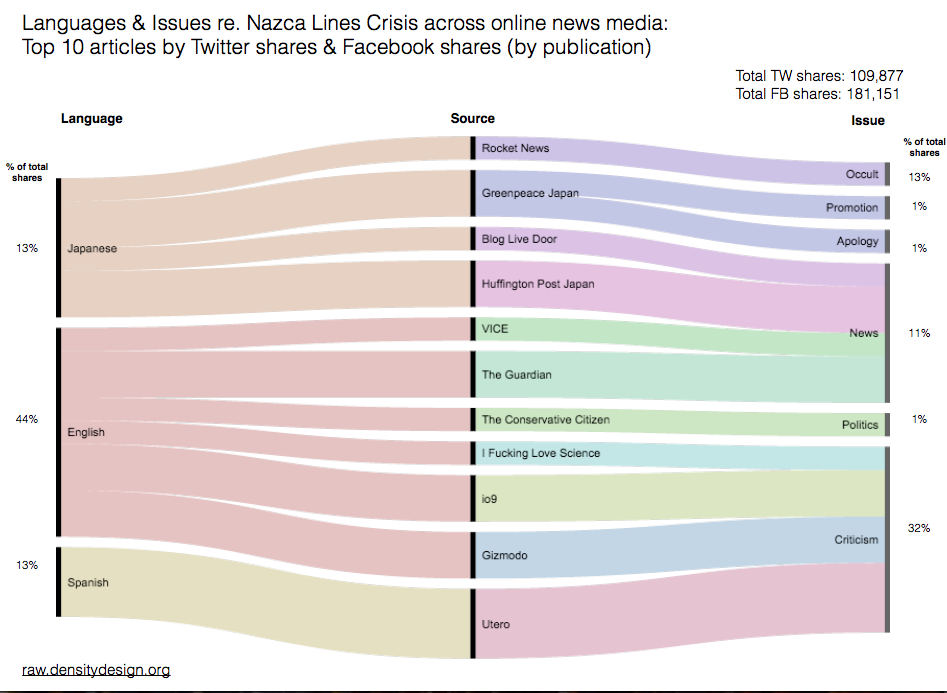
fig. 3 - Visualisation of the top 10 shared articles, their source and their respective languages
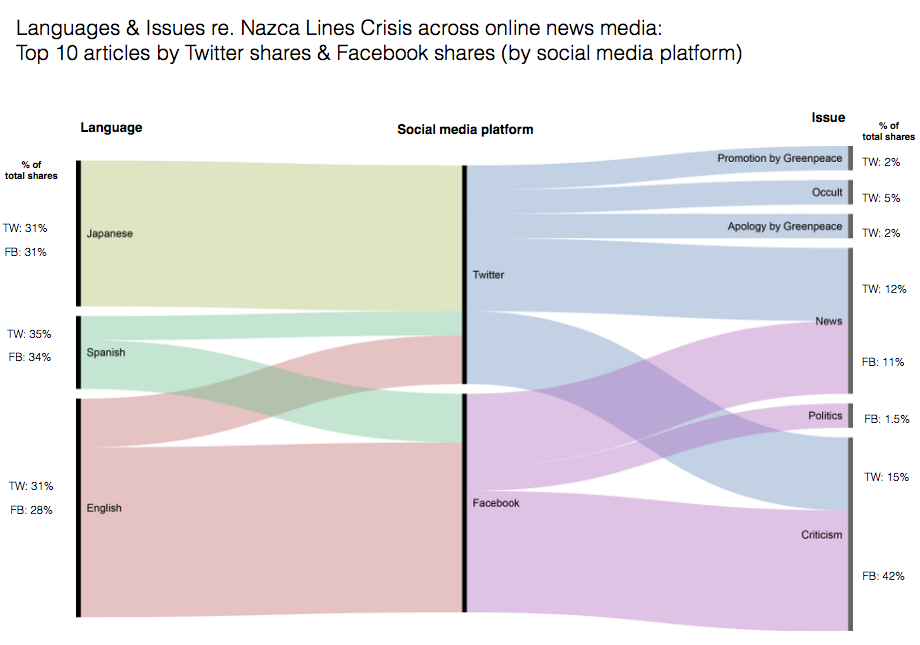
fig. 4 - Visualisation of top 10 shared articles, category of news outlet, and their respective languages
Interestingly enough, two of the top shared links on Twitter link to the official page of Greenpeace Japan. Of these two links, the most popular one entails an official announcement from Greenpeace Japan that an operation has been conducted in the vicinity of the Nazca Lines. The article does not mention or acknowledge the damage that was reportedly done to the Nazca Lines. Furthermore, the article by Greenpeace contains the explicit claim that the Nazca Lines were not touched at all . At the time of publication the 10th of December outrage about the event had already begun to spread and was voiced through various online platforms.The other link, posted a day later includes an official apology (in both Japanese and English) for any damage that the Nazca Lines may have endured. The most popular Japanese link, however, directs the user to a popular occultist blog that discusses the alleged spiritual connections the Nazca Lines have to the Earth and therefore, the implications that the actions of Greenpeace have on this bond. In summary, one of the other main Japanese links refers to The Huffington Post Japan and provides a journalistic overview of the situation. It should be mentioned that the article emphasizes the criticism that had already begun to be staged against Greenpeace.
The most popular English-language link was an article hosted by Gizmodo and appears to be largely sarcastic in tone. It is vehemently critical of Greenpeace's actions the article is tellingly titled "How Greenpeace Wrecked One of the Most Sacred Places in the Americas". It also references a post on io9, which is more neutrally framed, and also appears in the list of top shared web pages on Twitter. It should be noted that both of the publications are owned by Gawker. Finally, in regards to the Spanish-language links, the first link refers to a page that has no connection with the matter at hand, and the second refers to a Peruvian activist site. This site critically reported on the actions of Greenpeace immediately after the event (the date of publication was the 9th of December 2014).
Overall, Twitter sharing activity around the Greenpeace operation near the Nazca Lines appears to be largely critical in nature and predominantly geared towards Japanese-language sites. Furthermore, interestingly enough, the first Greenpeace Japan announcement regarding the operation (with no mention of any damage) was shared more often than the formal apology issued via Greenpeace Japan. Most of the shared content (all but one webpage) was published between the 9th and the 11th of December. There appears to be relatively little discussion and/or activity concerning the video apology issued on the 16th of December.
Facebook likes and shares were so similar that we opted to discuss the two together. Most of the communication took place from the 9th to the 13th of December, 2014 with the sole exception of a link to Vice on the 17th of December, which shows the extent of the damage done to the Nazca Lines. The link offers the reader drone footage of the area. Almost all of the sharing and liking activity on Facebook took place in English, especially when compared to the Twitter data. A majority of the content was decidedly critical in tone, and stems from (activist) media outlets. The most engaged with content link was a sarcastically toned article on I Fucking Love Science, which repeatedly demeans Greenpeace for their actions. None of the articles included the official (video) apology issued by Greenpeace on the 16th of December people generally seem more eager to share information concerning an event than information regarding its aftermath or reactions, as evidenced by the fact that almost all sharing and posting activity took place between the 9th and the 12th of December. Luis Jaime Castillo, Perus Deputy Culture Minister, is mentioned in almost every article (often framed as the direct adversary of Greenpeace).
Findings: Facebook
Tracking the Facebook post activity per day from the 8th of December (the day of the incident) to the 25th of December (9 days after Greenpeace´s official apology video was released) indicated that there was minimal online engagement on the day of the event but the number of posts increased by approximately 720% the following day. After the apology statement was released by Greenpeace on the 10th of December, the posts per a day increased by approximately 1,782% from the original 54 postings with a total of 962 posts for the day. On the 12th of December there was the most number of postings with 2,004 postings. Interestingly, this number of postings is significantly higher than on the 16th of December when Greenpeace released an official apology video. On this day the number of postings was only 865.

fig. 5 - Post activity on Facebook between the 8th and the 25th of December
Notably, the facebook page for I Fucking Love Science was the number one page for the most number of comments and shares. Their posting on the 12th of December, which linked to an article from their website titled Greenpeace Irreparably Damage Ancient Nazca Lines which had a total of 14.228 comments and 42.166 shares. This is the only facebook page that consistently stayed in the top five for all three of the categories, and since the data has been collected has still increased in number of likes, comments and shares. Diario La República which is the facebook page for La República, a daily Peruvian newspaper, was number two for the most number of likes (11.786) and number four for the most number of comments (3.148); it was not even in the top 20 for most shares, however. The third most liked facebook page post belonged to Diario El Comércio (Perú); More generally the most dominant actors involved were very diversified; but could be organized in the following categories: news outlets, websites/blogs about science, technology and/or entertainment, Greenpeace and its subsidiaries.

fig. 6 - Engagement with Facebook posts by language
Considering the Facebook audiences engaged with the issue it was shown that the discourse was mainly driven by English and Spanish. In the beginning of the discourse after the 8th of December comments and shares mainly were generated on Spanish content. The engagement with Spanish content rose between the 8th and the 10th of December from around 2.000 comments and shares to approximately 3.000. After the 12th the engagement decreased just to rise once again on the 16th, when Greenpeace released the apology video produced in Peru. While the first rise of engagement (8th to 12th of December) can be referred to online articles of El Diario Comércio (Peru) the second rise (16th of December) may be related to a report of CNN en Espanol about the apology video. This indicates that the Greenpeace video affected the Spanish language sphere and caused engagement spreading the apology. Yet, the engagement fell the following day from 2.100 to 430 comments and shares showing that the attention span for this discursive turn was short.
In the English sphere engagement rose from the 10th until the 12th of December from about 2.000 shares and comments to more than 50.000 on the 12th. The rise was mainly driven by a rather sober Greenpeace apology post from the 10th of December and subsequent reactions on it. The responses were rather negative, criticizing the apology to the point of sarcastic statements about Greenpeace´s action. After that steep peak interest dropped notably. Contrary to the Spanish sphere engagement did not rise on the 16th of December but remained stable at a niveau between 3.700 and 4.300 comments and shares. Content users were most engaged with was drone footage demonstrating the damage on the Nazca Lines. Thus the English sphere rather concentrated on further critical reports overshadowing Greenpeace´s apology. Yet Greenpeace crisis communication also got traction in the beginning as the Italian language sphere demonstrates. Immediately after the news of the event was released, one of the most shared stories was by Greenpeace Italia, posted on the 9th of December.
When chronologically analysing the most influential Facebook posts from the day of the event until one day after the official apology video, one of the main concepts that becomes clear is that the official response from Greenpeace did not cause any relevant effects with regards to the number of Facebook comments or shares. The most significant peaks in Facebook activity all had to do with the platforms and their online following involved in sharing the news, and thereby generating the most traffic in relation to shares and comments. The story angles that were most prevalent revolved around a combination of outrage, astonishment and resentment towards Greenpeaces actions. Some stories tried to outline the possible damages that were done to the site (for example by showing drone footage), while other articles opted to offer a neutral stance. These articles quoted Peruvian officials, and did not offer outrage towards the events, but rather unbiased journalism. Overall, however, the sentiment was dominantly negative.
Greenpeaces communications through Facebook had little effect on diverting the negative story angle. When looking at the stories that produced the most shares and comments or their total sum and thus engagement we were unable to find any effects coming from the official Greenpeace International response. The initial apology was not considered adequate by many and generated a lot of controversy; the official apology was two days after the event (an amount of time that can be argued was too much) and the official apology video by Dr. Naidoo was more than a week after the event and, more importantly, after the peaks in Facebook activity. When we look at the effects of these official reactions we can see there is almost no increase in the number of comments or shared stories, or the total engagement in general.
Findings: Twitter
The three data sets follow the same pattern across time. As a platform that bursts into a space for news dissemination after an event of this kind, Twitter shows a pattern of immense activity in a short span of time directly following the event itself much like the news data set. Online activity regarding the event decreases almost as quickly as it took off, only to rise again every so often when the news reports legal consequences to the event. These do not resonate out of the news sphere, and therefore Twitter by proxy. Spanish was the largest language, followed by English and Japanese. This follows the pattern of news having broken first across South America and in the Peruvian and other Spanish language news spheres. Other language geographies have picked up on the story over time reflected in the number of retweets in the data set.

fig. 7 - Visualisation of top 10 retweets per language, along with their sentiments and sources
Most prominent issues in each data set have to do with news-related descriptions or descriptions of Greenpeaces protest. English and Spanish follow a similar pattern of word frequency, leading us to speculate that the English and Spanish Twitter spheres are informed by similar sources. The Japanese sphere sets itself apart in two ways: firstly, there is evidence of the placing of the Nazca Lines Crisis within the broader issue of climate change as related to the coinciding of the 8th December action with the COP20; secondly, the large occurrence of emotive vocabulary hints at a particular empathy that is missing from the English and Spanish retweets. In the case of retweets again, English and Spanish follow a similar pattern, both in terms of how many retweets were simply reporting news content, and how many shared critical opinion. Japanese stands apart as a more active space for criticism on the part of Japanese Twitter users. Furthermore, the majority of URLs shared are news content. Top Mentions were Greenpeace + news + people from the scientific community.
The heavy emphasis on news content reflects a suffocating surface of news content across the Twittersphere, making it difficult to determine the portrayal of Greenpeace within Twitter and outside of news content. By taking a bottom up approach to words frequencies in the retweets we were able to start getting at some of this content. For example, the English sphere seems to now bring the original message of Greenpeace back into the discussion, and there is more evidence of discussion around Greenpeace as an entity albeit largely negative. Lesser retweeted content, we understand this to be representative of a subtle middle ground of activity that is representative of opinion and concerns, might influenced by news but set apart from a mere reproduction of news content. Unfortunately, we did not have enough time to delve further into the middle ground. However, further research would have created a clearer issue map of this subtle, middle ground of activity as well as a social graph of users so as to elucidate the key influencers across the different levels of interaction on Twitter (a social graph by mentions would potentially show clusters and/or online Twitter communities alluding to influential actors).
Conclusions
After analyzing the data Greenpeace provided us with in the three different areas of our research, namely: online news articles, Twitter and Facebook, we must conclude that the overall sentiment and responses have have clearly been very negative when pertaining to Greenpeace and their action at the Nazca Lines. The sentiment was mostly one of shock, anger and disbelief about the irresponsibility that was portrayed.
For each analyzed data set somewhat similar patterns could be found. Considering online news media, scientific blogs and (grassroots) news activist (c.q. media activism) publications appear to have more online weight than traditional media (the only traditional media outlets to appear are The Guardian and different versions of the Huffington Post). The media-activist site Utero (Uterus), from Peru, was the very first to spread the complaint of the Maria Reiche Association against Greenpeace and thus appears to be a key player in the mainstreaming of the events. Vice, another media-activist organization, was responsible for bringing the subject to the light again, specifically on December 17th, with their report about the drone footage showing the extent of the damage.
It was concluded that the language of the content most engaged with overall is English. When comparing total engagement to Twitter and Facebook activity, Twitter appears to comprise only a small part of the activity regarding the Nazca Lines. The top shared site on Twitter does not even appear in the total engagement table. Furthermore, the dominant language on Twitter appears to be Japanese, while the overall dominant language for all the platforms is English. In terms of similarities between Facebook and Twitter; articles on Vice, Gizmodo and io9 (non-traditional media outlets) appear to be popular content on both platforms. It should also be noted, however, that the results are somewhat skewed because two variables have been measured for Facebook (likes and shares), compared to one for Twitter (shares). People also generally seem more eager to share information concerning an event than information regarding its aftermath or reactions, as evidenced by the fact that almost all sharing and posting activity took place between the 9th and the 12th of December. This could serve as an indicator to Greenpeace of the timely nature of these kinds of crisis situations; in the future Greenpeace might do well to respond more swiftly to a similar event in order to capitalize on the strongly viral character with which such phenomena gain traction online. In this case, releasing a formal apology by video eight days after the events entered into the public consciousness spurred relatively little attention when compared to the outrage that the events initially produced.
Facebook and Twitter themselves cater different audiences. Twitter was dominated by Japanese content, while English and Spanish content mainly circulated on Facebook. The Facebook discourse mainly took place in the English language sphere with a large variance of engagement over a short period of time. Content most shared and commented on mainly comprised criticism such as reports of El Diario Comércio (Peru), I Fucking Love Science or Vice News and did not reflect the Greenpeace perspective. Mainly the Spanish language sphere reflected on Greenpeaces apology video on the 16th of December while the overall mostly shared and commented content dealt with drone footage of the Nazca Lines´ damage. The Twitter discourse is overwhelmingly news-based with distinct differences between Japanese and then English/Spanish. Although, we are aware that nuances might have been lost in translation. The Japanese landscape would be nicely discussed in terms of Japanese pop culture as setting it apart from a Eurocentric language tradition. Generally the tone of the Twitter discourse is reflecting on news reports, the original message of Greenpeace is at least in the top tweets lost.
This study strived to map the discourse about the Nazca Lines crisis on different online media. It therefore showed how the discourse developed. For a further understanding of which content circulated in which networks of people an in-depth analysis of less popular tweets might show that Greenpeaces angle on the story got traction. As the most mentioned Twitter user, Greenpeace was heavily criticised on Twitter criticism that far outweighed any effect Greenpeace communications might have had. To understand how social networks of pages might influence the distribution of content propose to analyze linkages between users and pages. One approach might contain an analysis of like networks using the Facebook application Netvizz. This allows to further understand which topography of a like link network exists between users and pages that might reinforce the circulation of distinct content between both.
Greenpeaces official statements coming from different national offices have been differently caught up on Facebook and Twitter, showing a generally fragmented response of Greenpeace that was further dispersed through different online media. As it was shown several national Greenpeace offices reacted solely in different online media and with different standpoints. Also, little engagement with the official Greenpeace apology video was documented. It must be said, the measurement of engagement does not mean that there was no further dialogue going on. Yet it gives a crude indication of the most popular content circulating per day. This means that Greenpeace failed in several ways to address the problem since it reported different statements, which were caught up by different audiences around the world. With regards to an official response to a controversial incident that generates global outcry, Greenpeace could have responded in a quicker manner, thereby potentially controlling the narrative. Also, it might be speculated that a concerted apology of Greenpeace International could have been more effective in shaping the discourse.
Bibliography
Twitter. "About Twitter, Inc." Twitter. 2015. 14 January 2015. https://about.twitter.com/company.
Associated Press in Lima. "Peru to Take Legal Action over Greenpeace Stunt at Ancient Nazca Lines." The Guardian. 2014. 13 January 2015. http://www.theguardian.com/world/2014/dec/10/peru-legal-action-greenpeace-stunt-nazca-lines.
Borra, Erik and Thomas Poell. " Twitter, YouTube, and Flickr as Platforms of Alternative Journalism: The Social Media Account of the 2010 Toronto G20 Protests." Journalism. 13(6): 695-713 (2012).
Eshelman, Robert. "In Photos: Greenpeace Unfurls Climate Message Next to Nazca Lines in Peru." VICE News RSS. 2014. 14 Jan. 2015. https://news.vice.com/article/in-photos-greenpeace-unfurls-climate-message-next-to-nazca-lines-in-peru.
Freberg, Karen. "Intention to Comply with Crisis Messages Communicated via Social Media." Public Relations Review 38.3 (2012): 416-21.Science Direct. Web. 14 Jan. 2015. < http://www.sciencedirect.com/science/article/pii/S0363811112000252 >.
Greenpeace. Greenpeace Releases the following Apology about the Nazca Lines Protest on December 8th. Greenpeace. 2014. 14 Jan. 2015. http://www.greenpeace.org/international/Global/international/briefings/other/Nazca-Lines-protest-apology.pdf
Rieder, Bernhard. "Studying Facebook via Data Extraction: The Netvizz Application."
Rieder, Bernhard. "The Refraction Chamber: Twitter as Sphere and Network." First Monday 17.11 (2012).
Rogers, Richard. Digital Methods. Cambridge, MA: MIT Press, 2013.
Rogers, Richard. "Debanalizing Twitter: The Transformation of an Object of Study." Proceedings of the 5thh Annual ACM Web Science Conference (2013): 356-65. Print.
UNFCC. Lima Climate Change Conference - December 2014 UNFCC. 2014.14 January 2014. http://unfccc.int/meetings/lima_dec_2014/meeting/8141.php
Greenpeace International. "What We Do." Greenpeace International. 2014. 10 Jan. 2015. http://www.greenpeace.org/international/en/campaigns/
Ideas, requests, problems regarding Foswiki? Send feedback