Mapping Climate Conflict Vulnerability and Victims
Team: Gabriele Colombo, Carlo di Gaetano, Stefania Guerra, Catalina Iorga, Sabine Niederer, Simeona Petkova, Sophie Waterloo.
Literature on climate and conflict lists climate variables that indirectly cause human conflict and are connected to a countries adaptive capacity. The IPCC (2007) defines adaptive capacity as the ability or potential of a system to respond successfully to climate variability and change. (...) Common traits include human and social capital, wealth, technology, and the quantity and quality of infrastructure. (SEI.org 2011:4) These traits are among the variables used in climate vulnerability indexes, research reports that rank countries according to their adaptive capacity to climate change. For this study, we triangulated three such vulnerability indexes. We included DARA Climate Vulnerability Monitor (CVM), Germanwatch Global Climate Risk Index (CRI), the GAIN Index, a project of the Global Adaption Institute (GAIN), which summarizes a country's vulnerability to climate change and other global challenges in combination with its readiness to improve resilience.
In this study, we use the indexes to distill both ranked country lists and climate vulnerability terminology, that we find in the lists of variables employed to calculate the vulnerability scores for each country.
1. DARA's Climate Vulnerability Monitor (CVM) (released in 2012, data from 2011)
This index evaluates the global impact of climate change on human health, weather, human habitat, and economics at a national level by using groups of climate- and carbon-related indicators. It reassesses the human and economic costs of the climate crisis by using death toll and economic loss, respectively, as measurements. For more info on the CVMs methodology, click here.
For the purpose of this research - assessing climate change vulnerability - we only kept the climate-related indicators. The four climate macro indicators (each with several sub-indicators mentioned in brackets) are:
- environmental disasters (drought, floods and landslides, storms, and wildfires),
- habitat change (biodiversity, desertification, heating and cooling, labour productivity, permafrost, sea-level rise and water),
- health impact (diarrheal infections, heat and cold illnesses, hunger, malaria and vector-borne, meningitis) and
- industry stress (agriculture, fisheries, forestry, hydro energy, tourism, transport).
2. Germanwatchs global Climate Risk Index (CRI) (released in 2013, data up to 2011)
The Global Climate Risk Index 2013 analyses to what extent countries have been affected by the impacts of weather-related loss events. The score of each country is calculated by assigning different weights to the death toll (⅙), death per 100.000 (⅓), total loss in millions USD (⅙) and losses per unit GDP (⅓). For more info on the CRIs methodology click here.
The CRIs macro indicator is extreme weather, while its sub-indicators are storms, floods, heat waves and loss events (both human and financial).
3. The GAIN Index (released in 2012, data from 2011)
The GAIN Index, a project of the Global Adaption Institute (GAIN), summarizes a country's vulnerability to climate change and other global challenges in combination with its readiness to improve resilience. It uses both quantitative and qualitative measurement to calculate a countrys score, with quantity measures focusing on amounts (how much is used and how many people have access), and quality measures considering factors such as exposure to poor quality and impacts on people. For more info on the methodology of the GAIN index click here.Please note that we have only used the six key factor indicators dimension of the Vulnerability framework of this index. These macro indicators (with often simplified quantity and quality sub-indicators listed in brackets) are:
-
water (change in precipitation, freshwater extracted for all uses, access to improved water supply, change in temperature, 5 yr.-olds mortality due to water-borne diseases, access to improved sanitation),
-
food (change in agricultural cereal yield, population in rural areas, agricultural capacity, variation in cereal crop yields, food import dependency, under 5 yr.-olds suffering from malnutrition), health (death from disease, health workers per capita, longevity, infectious disease mortality, health expenditure, maternal mortality),
-
ecosystem services (biome threat, ecological footprint, protected biomes, dependency on natural capital, threatened species, Intl Environmental Conventions)
-
human habitat (urban concentration, population living in slums, electrical outages, urban risk, excess urban growth, quality of trade and transport infrastructure) and
-
infrastructure (land < 5m above sea-level, population living < 5m above sea-level, roads paved)
Research Questions:
What are the countries most and least vulnerable to conflict as a result of climate change?
How prominent are these countries in the online issue space of climate change and that of its sub-issues (demarcated through their vulnerability indicators)? How does this resonance vary across online issue space, looking at a countrys resonance within climate change on Google.com, Google News, Twitter (set of one year of climate tweets 22 Oct 2012 - 22 Oct 2013), and within UN General Assembly reports on climate change (dating from 2002-2012).
How does the issue imagery of climate change (using Google Image results) address these vulnerability indicators? Do we see adapted or vulnerable landscapes? And is the issue humanized (showing people, animals and landscapes) or quantified (in scientific stats and graphs) in imagery?
Method:
Mapping the countries the most vulnerable and most resilient to climate change
The first step here is to collect lists of countries, ranked by their vulnerability to climate change. For this, we use three indexes with recent data: DARA's CVM (2012, data from 2011), Germanwatch (2013, data up to 2011), GAIN index (2012, data from 2011). We triangulate the lists and found the countries most and least affected by climate change. For Gain and Germanwatch, we select the top and bottom 50 countries. For Dara, we use 'acute' for the most vulnerable, and 'moderate' for the least vulnerable. Subsequently, we create a world map indicating the least and most vulnerable countries.
Mapping the resonance of vulnerable and resilient countries in the online issue space
Here, we queried various data sets for the resonance of the most vulnerable and most resilient countries, looking at Google, Google News, Twitter data, and UN general assembly documents (available through UN ODS).
- Twitter: Take the collection of global warming, Using climate change AND country name. Collect and cloud the results.
- Google News: Query google news for "climate change". Take top 100 results and with the Lippmannian device scrape for shortlist of the 14 most vulnerable and most resilient countries.
- Google.com: Query google.com for "climate change"; Take top 100 results and with the Lippmannian device scrape for shortlist of the 14 most vulnerable and most resilient countries.
- UN General Assembly Reports: Take all English language UN General Assembly reports for "climate change" (2002- Oct 2013), query them for the shortlist of the 14 most vulnerable and most resilient countries. Note: future check could entail looking at whether the country is listed in the section on climate change.
- Additional sub-issue queries in Google.com:
- Disaster: "climate change" (disaster OR drought OR flood OR storm OR wildfire OR "extreme weather")
- Water: "climate change" (water OR "fresh water" OR "drinking water")
- Human Habitat: "climate change" (habitat OR slums OR "urban growth" OR migration)
- Health: "climate change" (health OR disease OR illness OR mortality OR "life expectancy")
- Food: "climate change" (food OR hunger OR "food security" OR "food crisis" OR yield OR agriculture OR farming)
- Infrastructure: "climate change" (infrastructure OR energy OR transport OR waste)
- Ecosystem: "climate change" (ecosystem OR biodiversity OR species OR forest)
- Land & Sea: "climate change" (desertification OR "sea level" OR permafrost)
Mapping Climate Imagery
2) 2 Canadian national newspapers over 6 months = people dominating the representation followed by climate change impact. (DiFrancesco and Young, 2011).
3) 13 newspapers; imagery embedded in climate related stories within 2010; a set of 1500; people dominated the coverage (politicians); geo distant landscapes (ice caps); personally distant images. (O'Neill, 2012).
4) public engagement with imagery = largely absent from the literature; Boykoff et al. (2013) article fills that gap by looking at climate visual imagery from 13 newspapers from USA, Australia and UK. 16 categories and 75 sub categories. We have approached the issue of the climate changed imagery by asking: what can the Web based imagery add to the climate change discourse?
1. Climate change image analysis
We have queried Google Image Search (as the dominant image search engine space) for climate change. We have further manually analysed and categorized the first 1000 images and visualized it in a tree map.
2. Climate Change Sub-Issue Panoramas
For the image analysis part of this project, we queried "climate change" in Google Images and retained the top 1000 results. Initially, we attempted to classify all images according to the indicators that formed the basis for queries on which the resonance map is based. However, given that the bulk of the results could not be labelled as such, we only categorised the Landscape imagery using the following indicators: Disaster, Land and Sea, Infrastructure, Ecosystem, Food and Human Habitat.
Findings:
Mapping the countries the most vulnerable and most resilient to climate change
According to all 3 used vulnerability indexes (DARA's CVM, GAIN index and Germanwatch's CRI), the most vulnerable countries are: Afghanistan, Angola, Cambodia, Laos, Madagascar, Mauritania, Myanmar and Niger (Table One). The least vulnerable countries according to all 3 vulnerability indexes are: Cyprus, Egypt, Iceland, Israel and Luxembourg (Table Two).
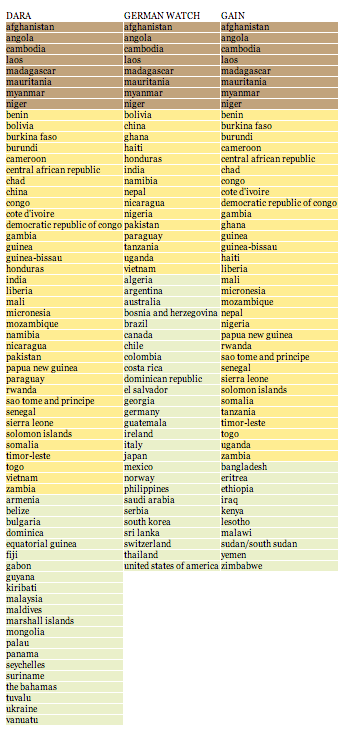 Table One: Triangulated lists of the most vulnerable countries according to the vulnerability indexes of DARA, GAIN and Germanwatch. Brown means occurring in all three lists, countries in yellow occur in two of the lists and the countries marked green occur in only one of the lists.
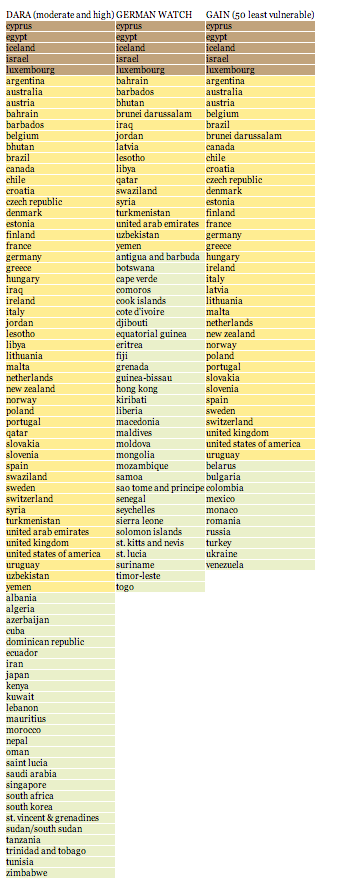 Table Two: Triangulated lists of the least vulnerable countries according to the vulnerability indexes of DARA, GAIN and Germanwatch. Brown means occurring in all three lists, countries in yellow occur in two of the lists and the countries marked green occur in only one of the lists.
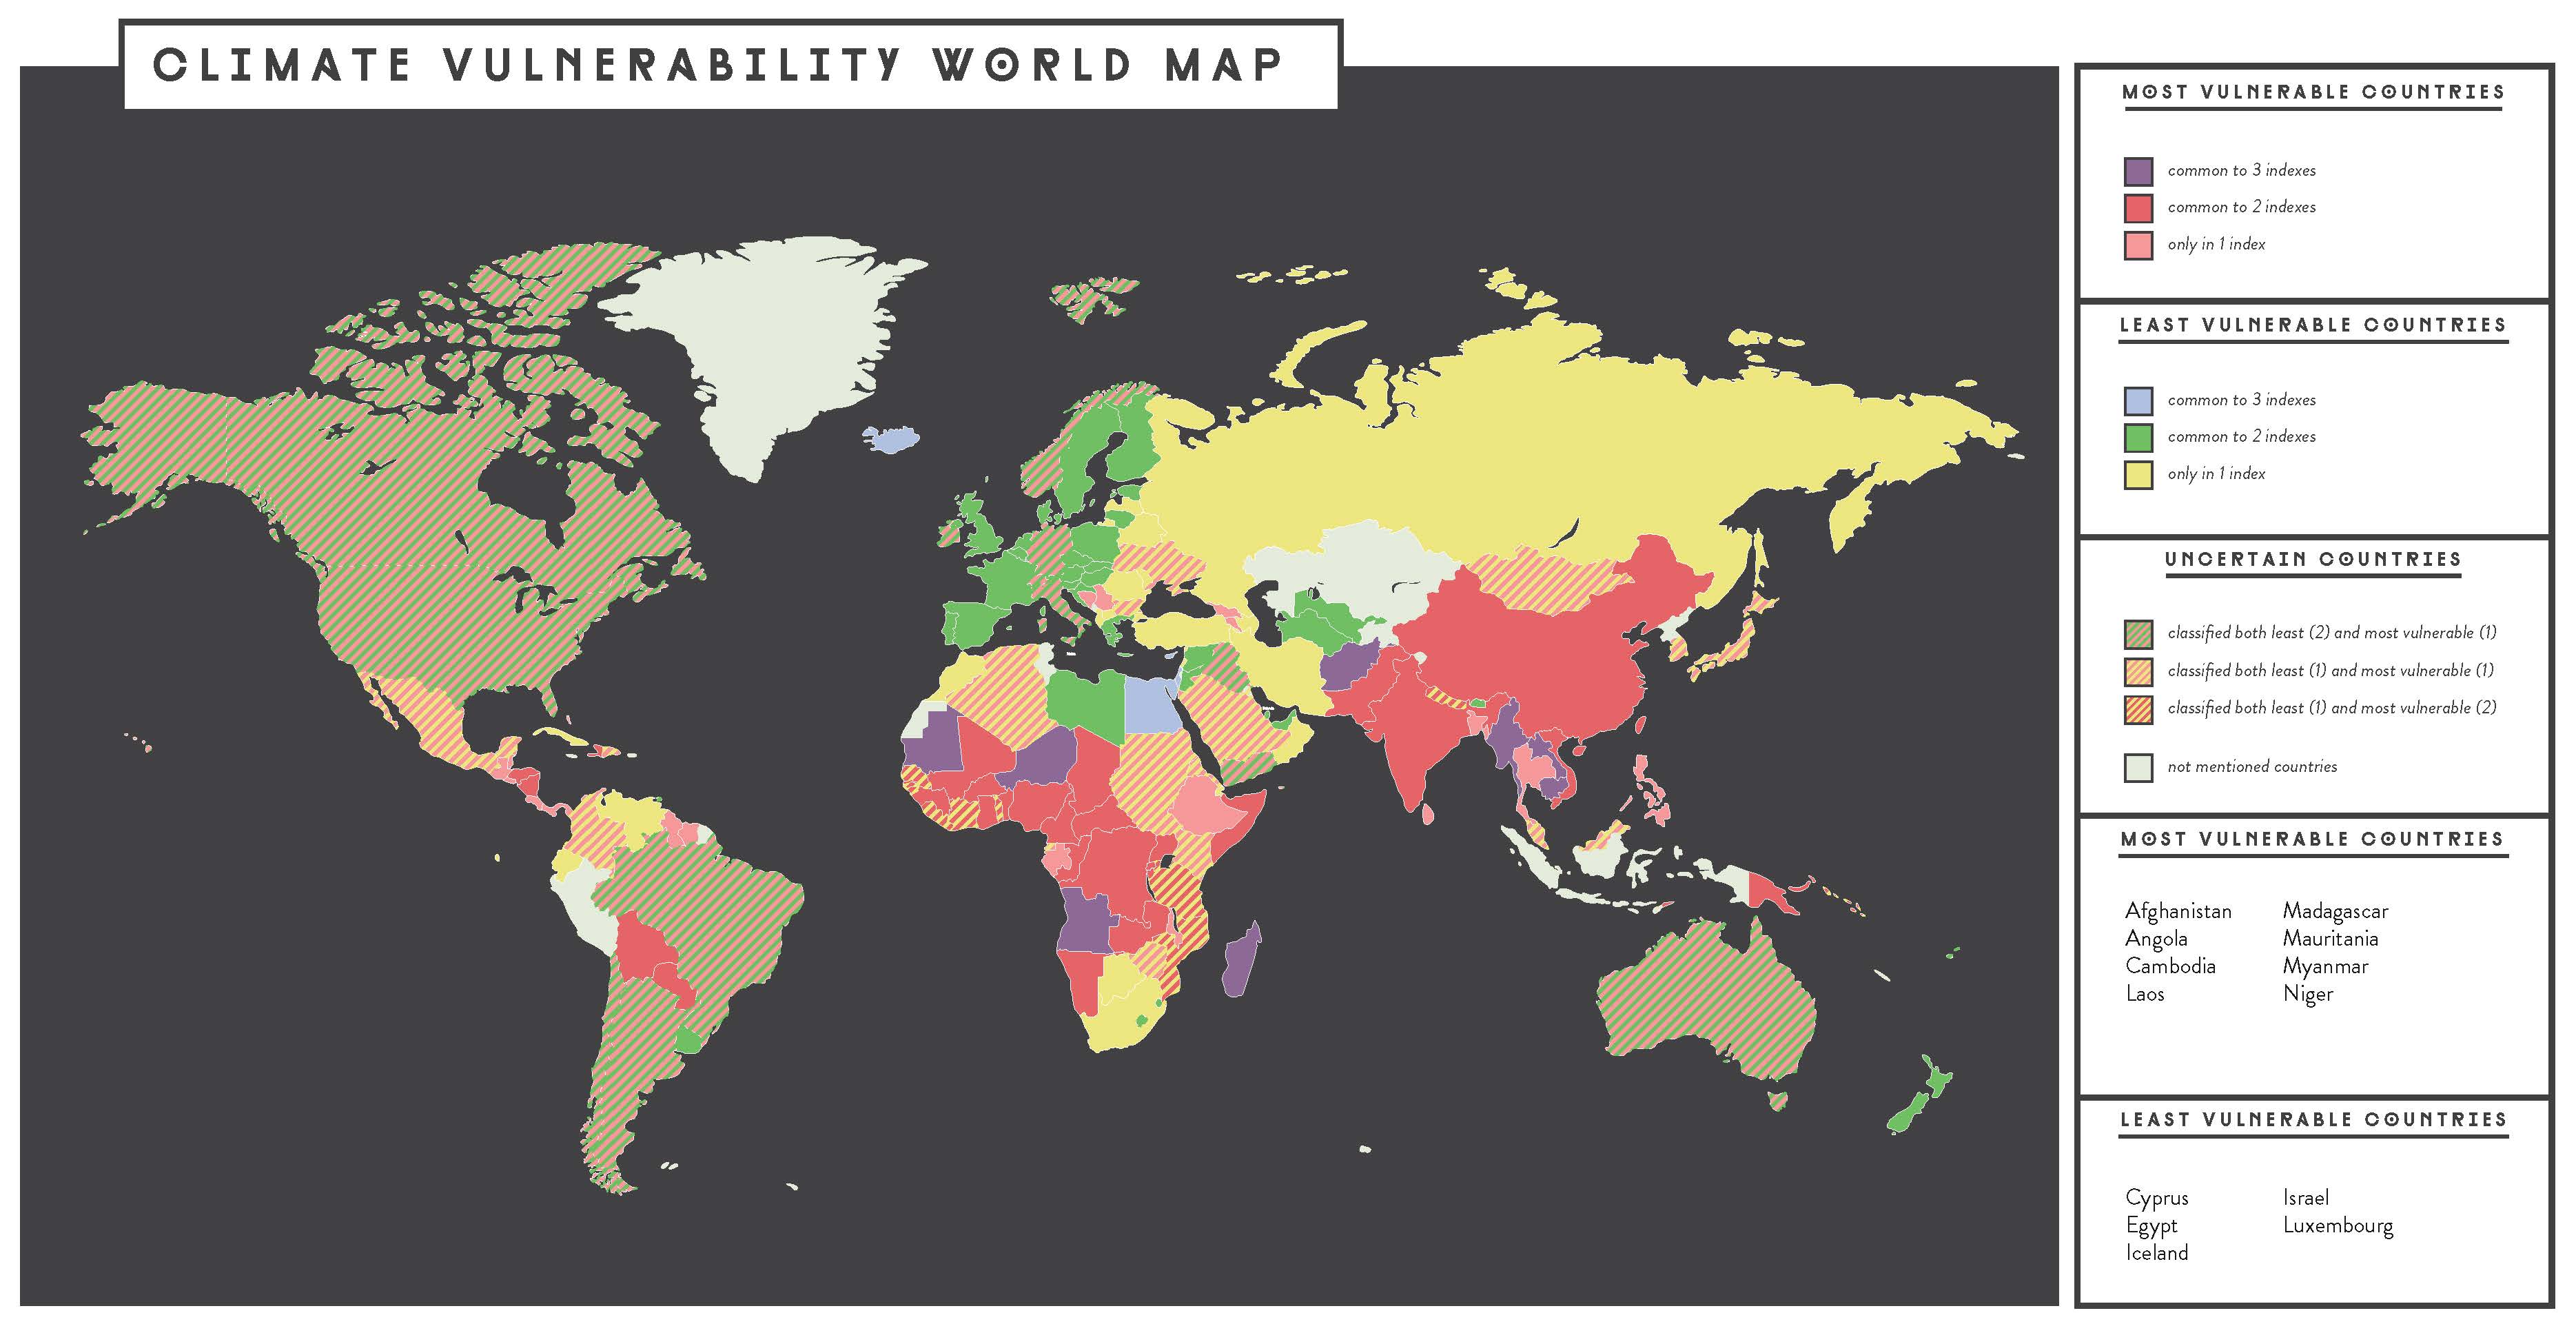 Figure One: Climate Vulnerability world map.
On the world map (Figure One), the most vulnerable countries (in purple, occurring in all three lists) are located either in Africa or Asia. Very vulnerable countries (in red, occurring in either two of the lists) are also located in the same regions, mostly West African and Southern Asia. Other vulnerable countries (in pink, appearing in at least one list) are more spread out: from South America through Central Europe to Southern Asia.
The most resilient countries (in blue, also appearing in all lists) are also relatively dispersed: Northern Europe, Western Europe, Southern Europe, North Africa and the Middle East. Other resilient countries (in green, occurring in either two of the lists) seem to be mostly confined to Northern and Western Europe, but a few of them are also located in South America, Africa and Asia. Another group of resilient countries (in yellow, appearing in at least one list) is also quite diverse, to be found in regions such as Russia, Southeastern Europe and Western Asia, but also South Africa or Latin America.Mapping the resonance of vulnerable and resilient countries in the online issue space
Country Profiles:
In the country profiles chart, each sub-issue is visualized as a ring, resized according to the resonance of the shortlisted countries within that specific sub-issue. The map shows an aggregate value for each sub-issue on the top right. Each country then is profiled according to its resonance within sub-issues, which are sorted from highest resonance to lowest resonance.
The diamond-shaped labels indicate whether the country is considered vulnerable (red) or resilient (green).
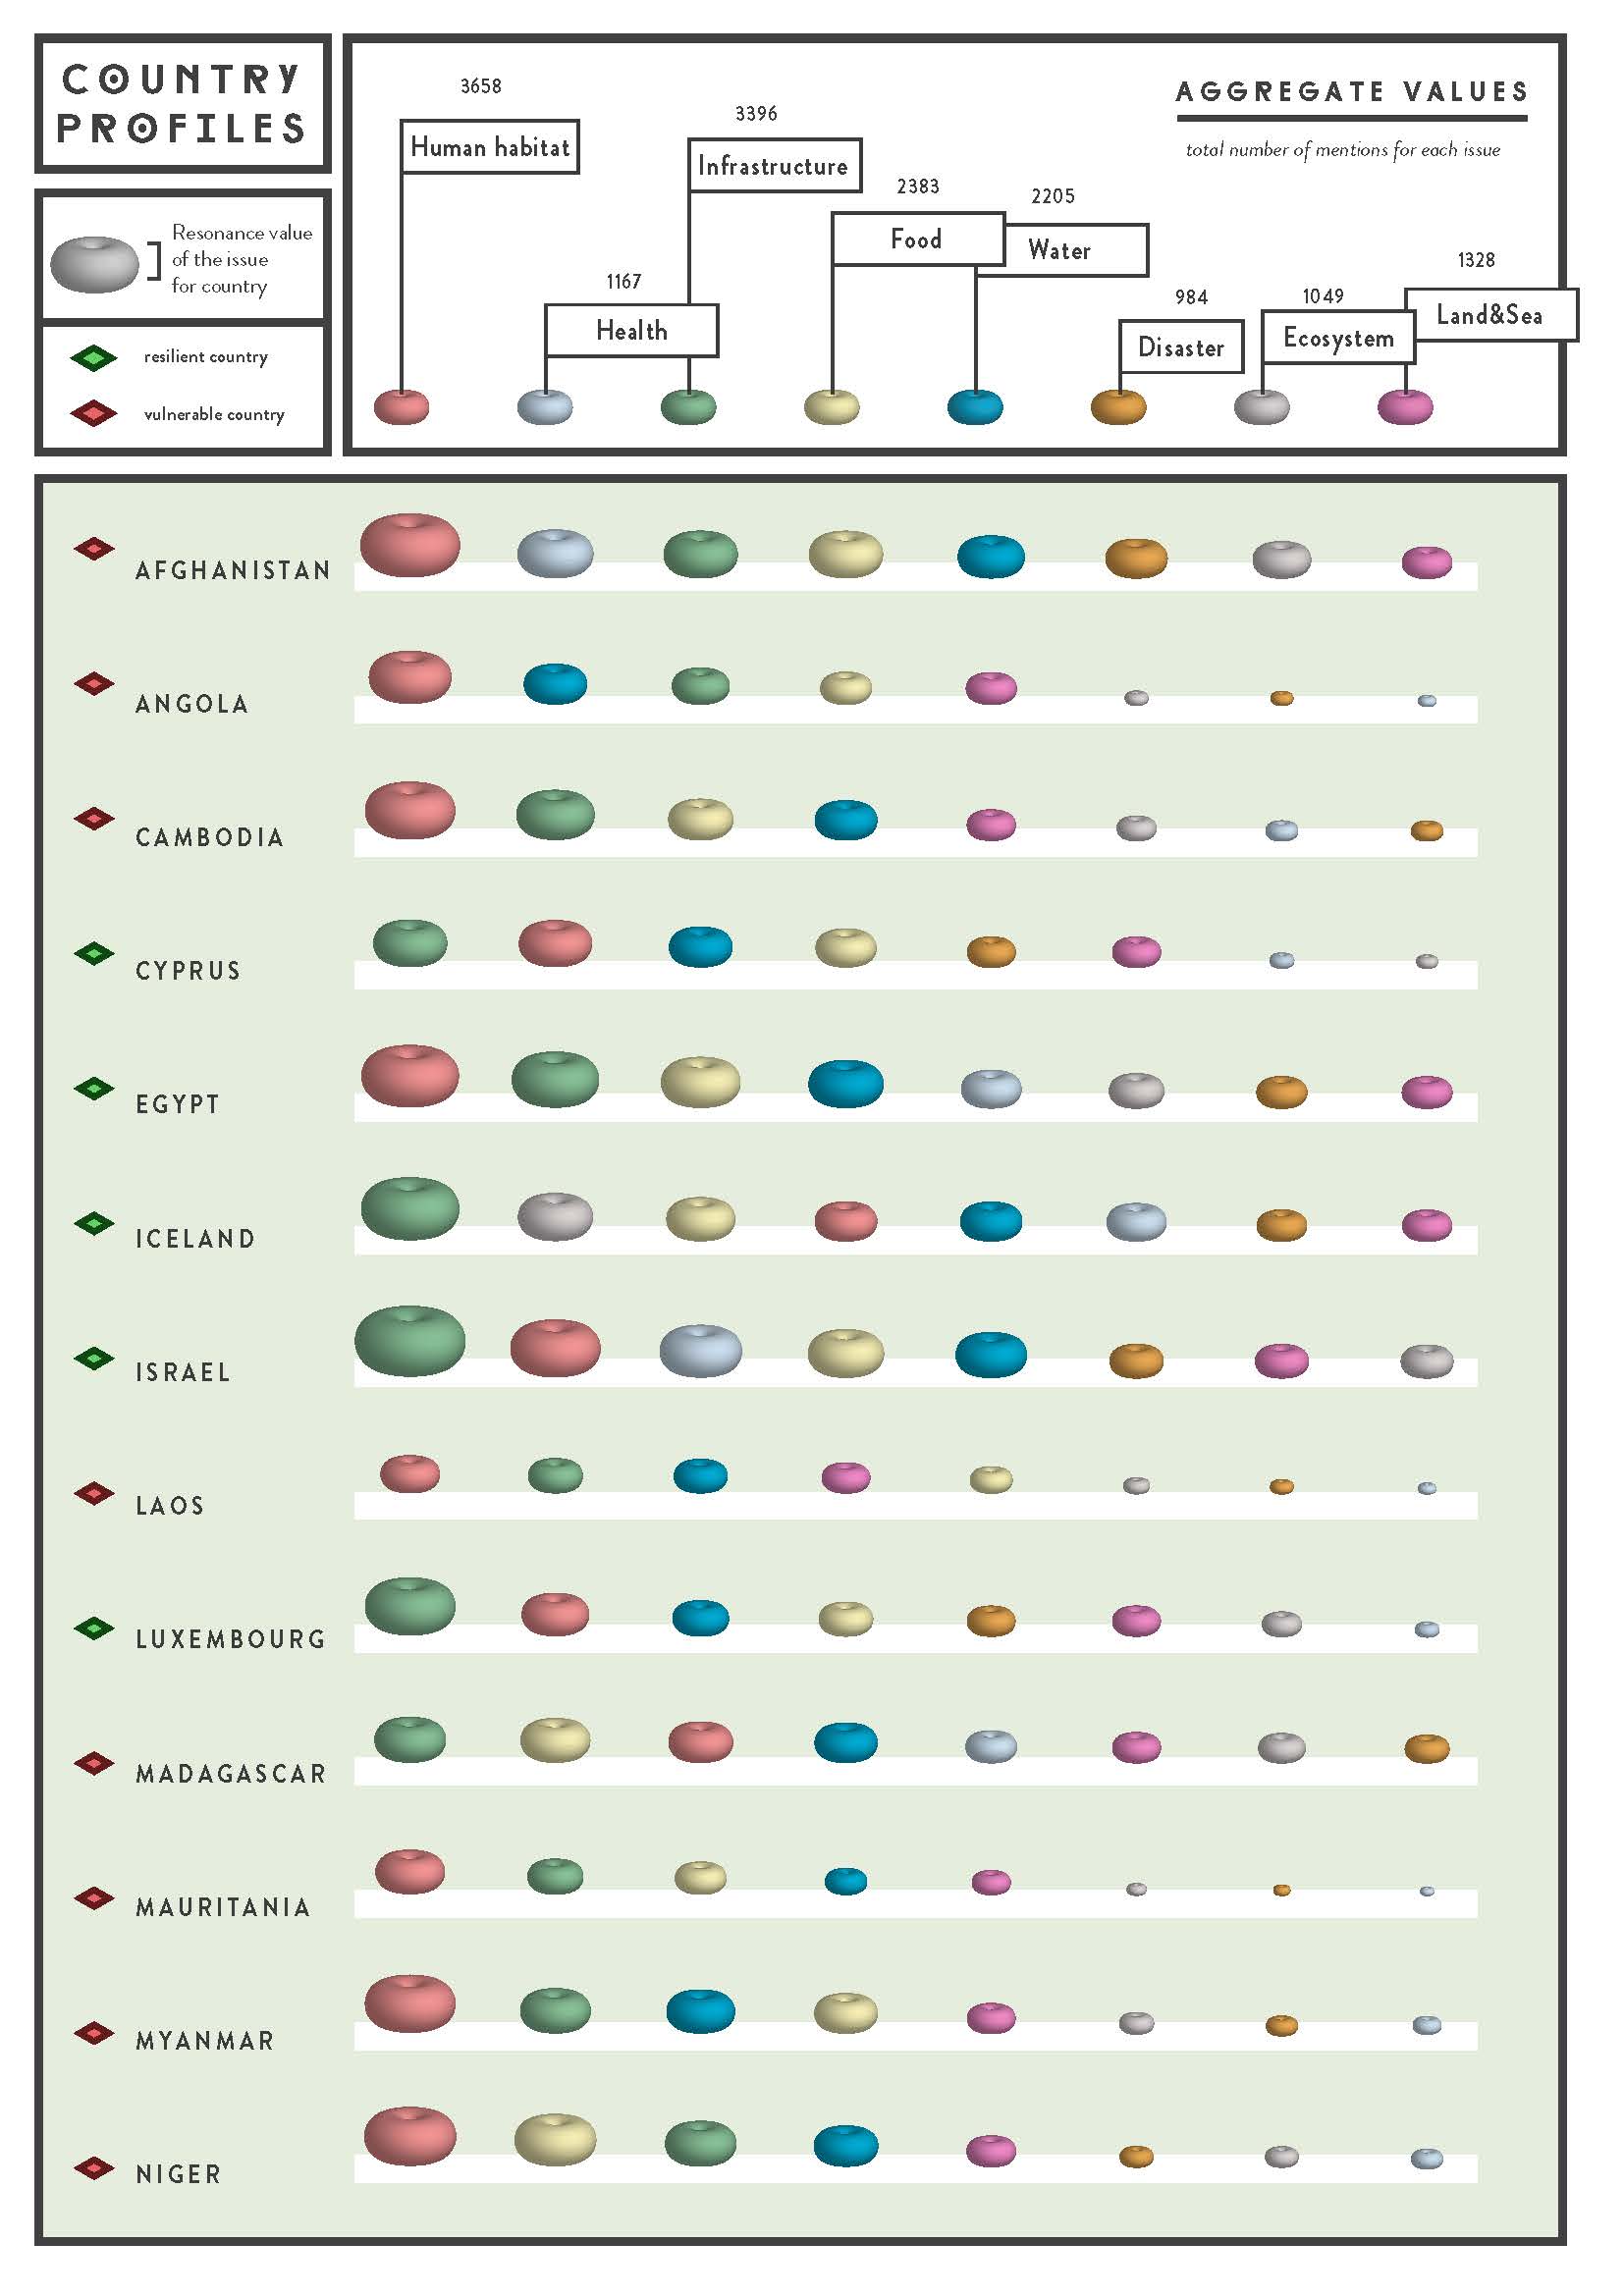
Figure Two: Country Profiles. See the full-sized map on: country_profiles_low.pdf.
The profiles demonstrate that the countries resonate most within the sub-issue space of Infrastructure and Human habitat. Food and Water are other consistent sub-issues across countries. Health seems to be specific to Afghanistan and Israel, whereas Ecosystem is specific only to Iceland.
Resonance Map
Subsequently, for each country the resonance in the various issue spaces (Google, Google News, Twitter and UN documents) is visualized in a resonance bar. These resonance bars are placed on a footer that is either green (resilient) or red (vulnerable). With Gephi, a network graph is made of all issues and countries, where only the strongest links are retained to position the countries in relation to their ties to a sub-issue. The diameter of a sub-issue shows the cumulative resonance of the set of countries for that sub-issue. The relative position of the countries refers to the commitment of a country to a particular issue (Figure Three).
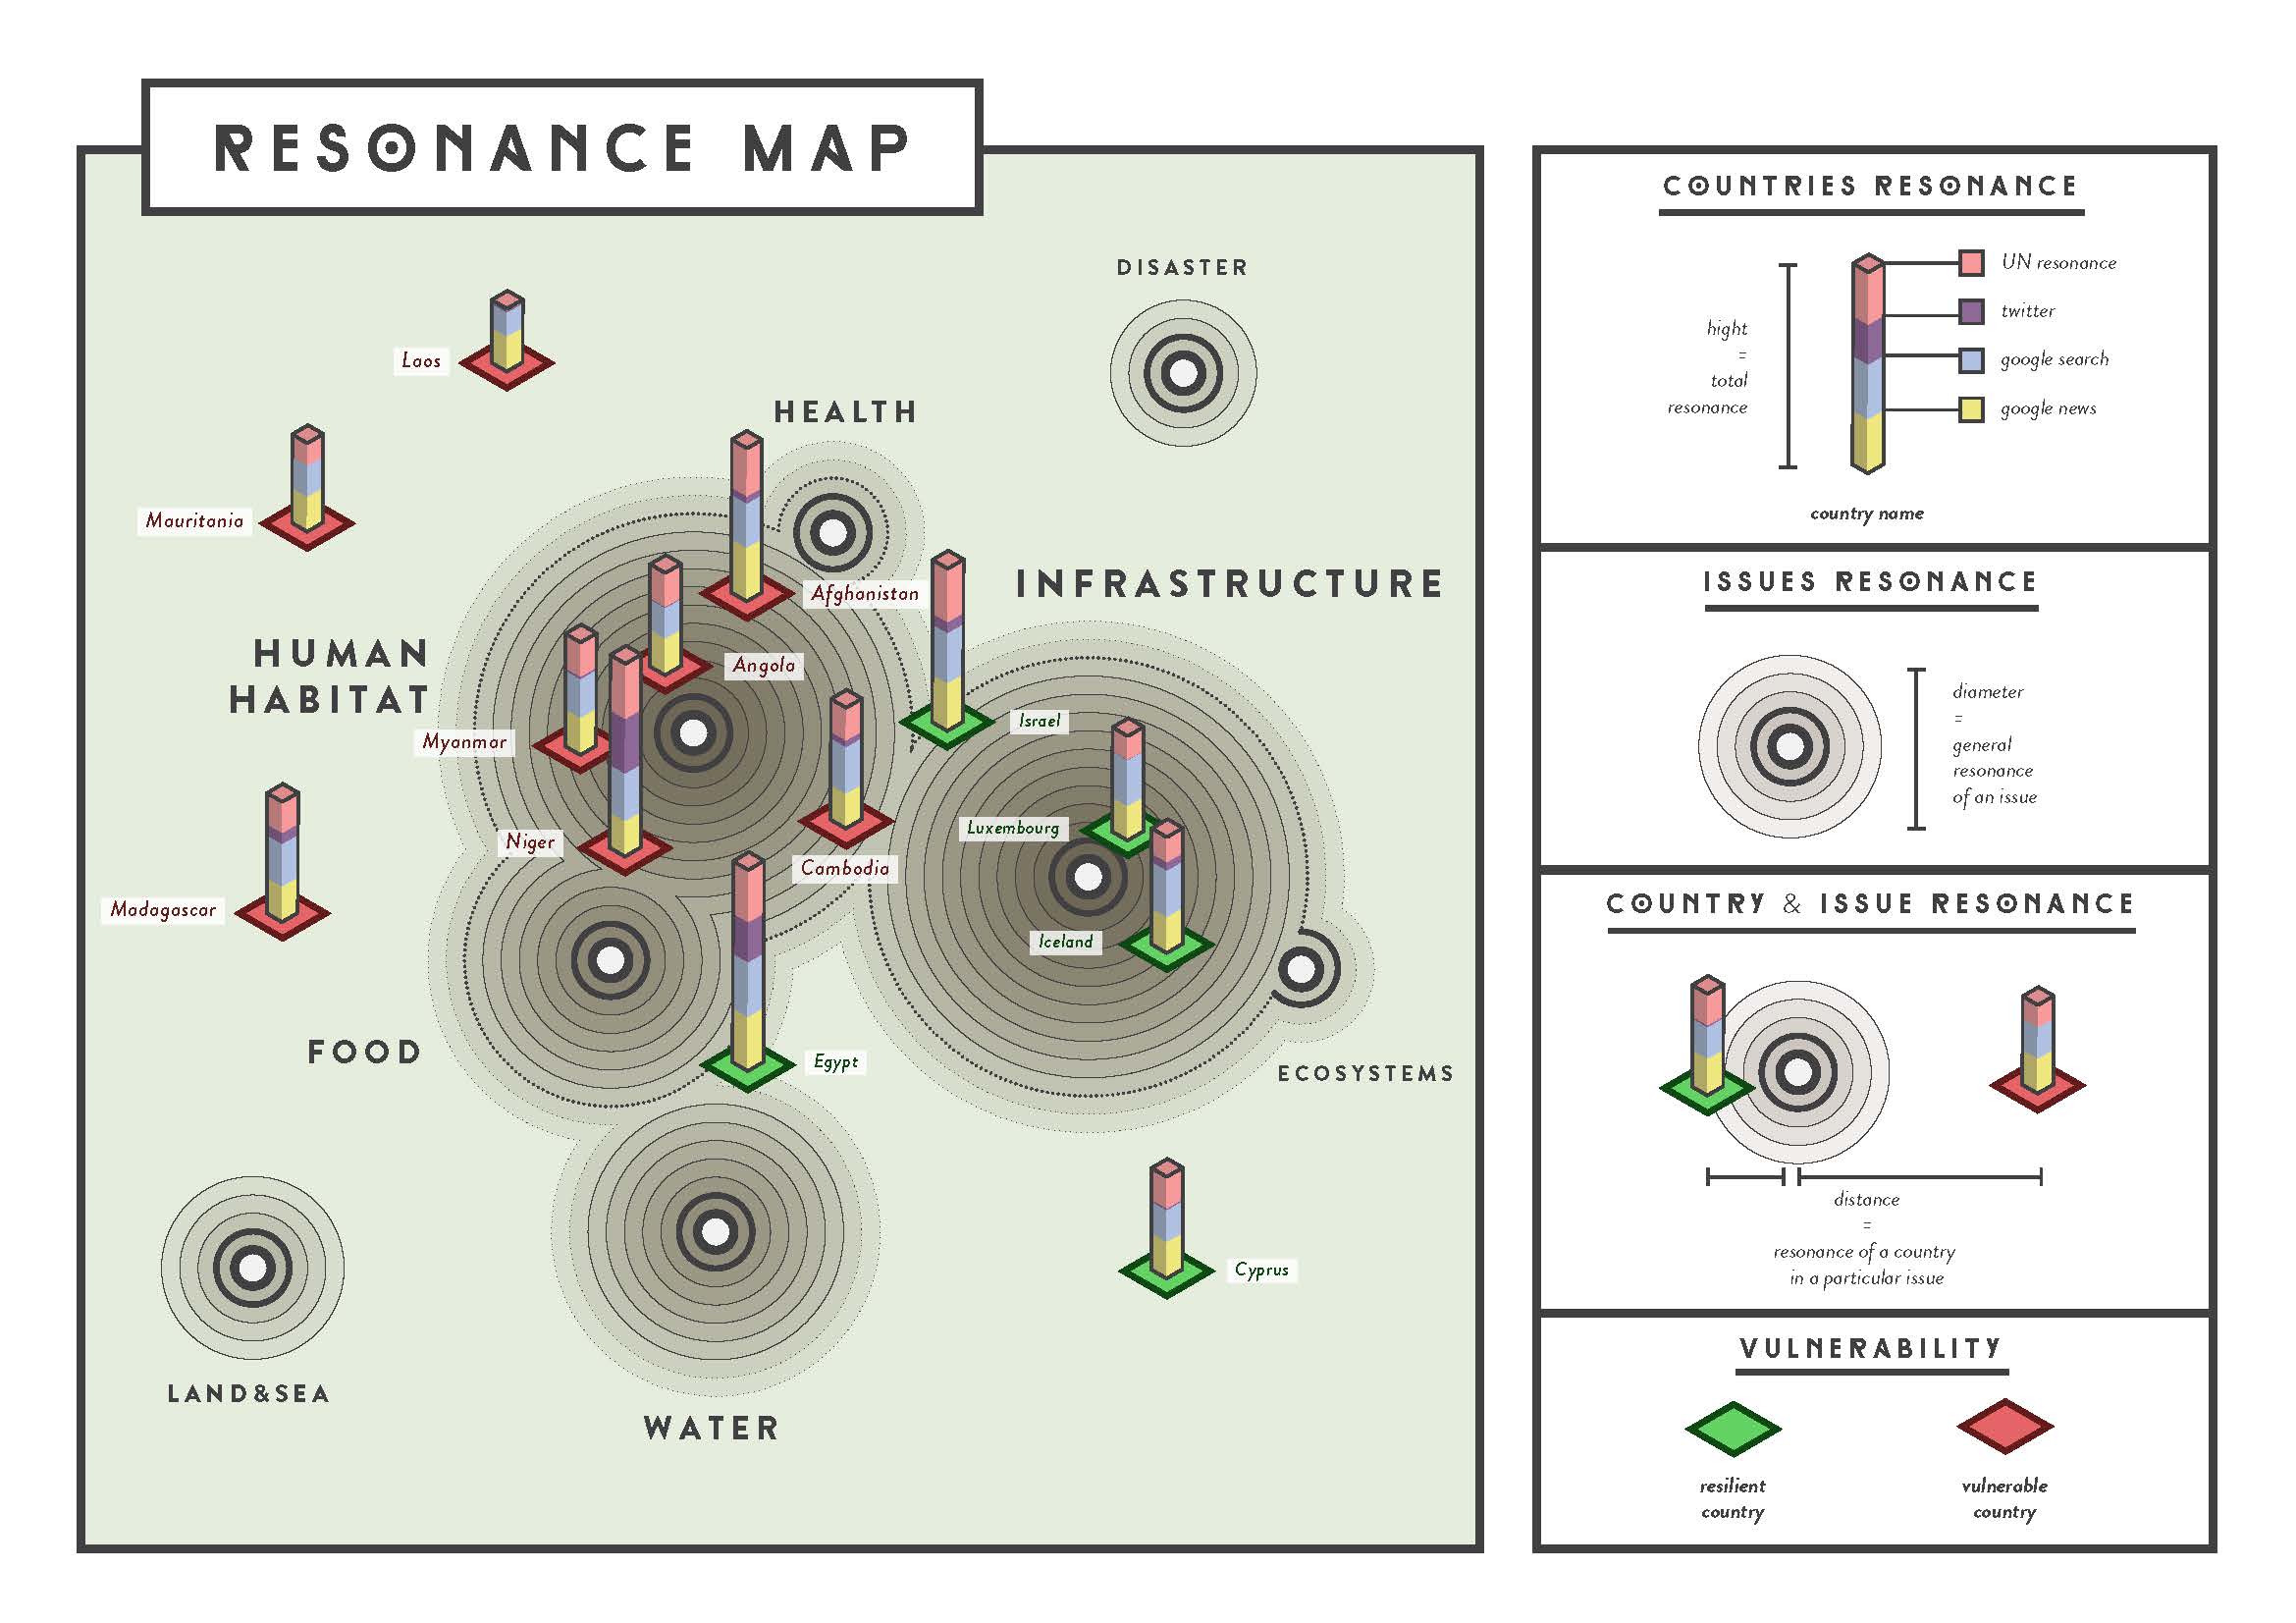
Figure Three: Climate Vulnerability Resonance Map. See the full map on: ultima_filtrata_pulita.pdf.
Overall, it shows that Infrastructure is an concern of resilient countries, and Human habitat is a concern of vulnerable countries. Furthermore, positioning the sub-issues based on the cumulative resonance, reveals the close relation of Health and Food with the sub-issue of Human habitat.
Climate Imagery: Tree Maps The most dominant subset of climate change related images according to Google Images is Landscapes, Science and People. The most prominent subcategory within the landscapes was imagery related to disasters, followed by land&sea (floating icebergs).
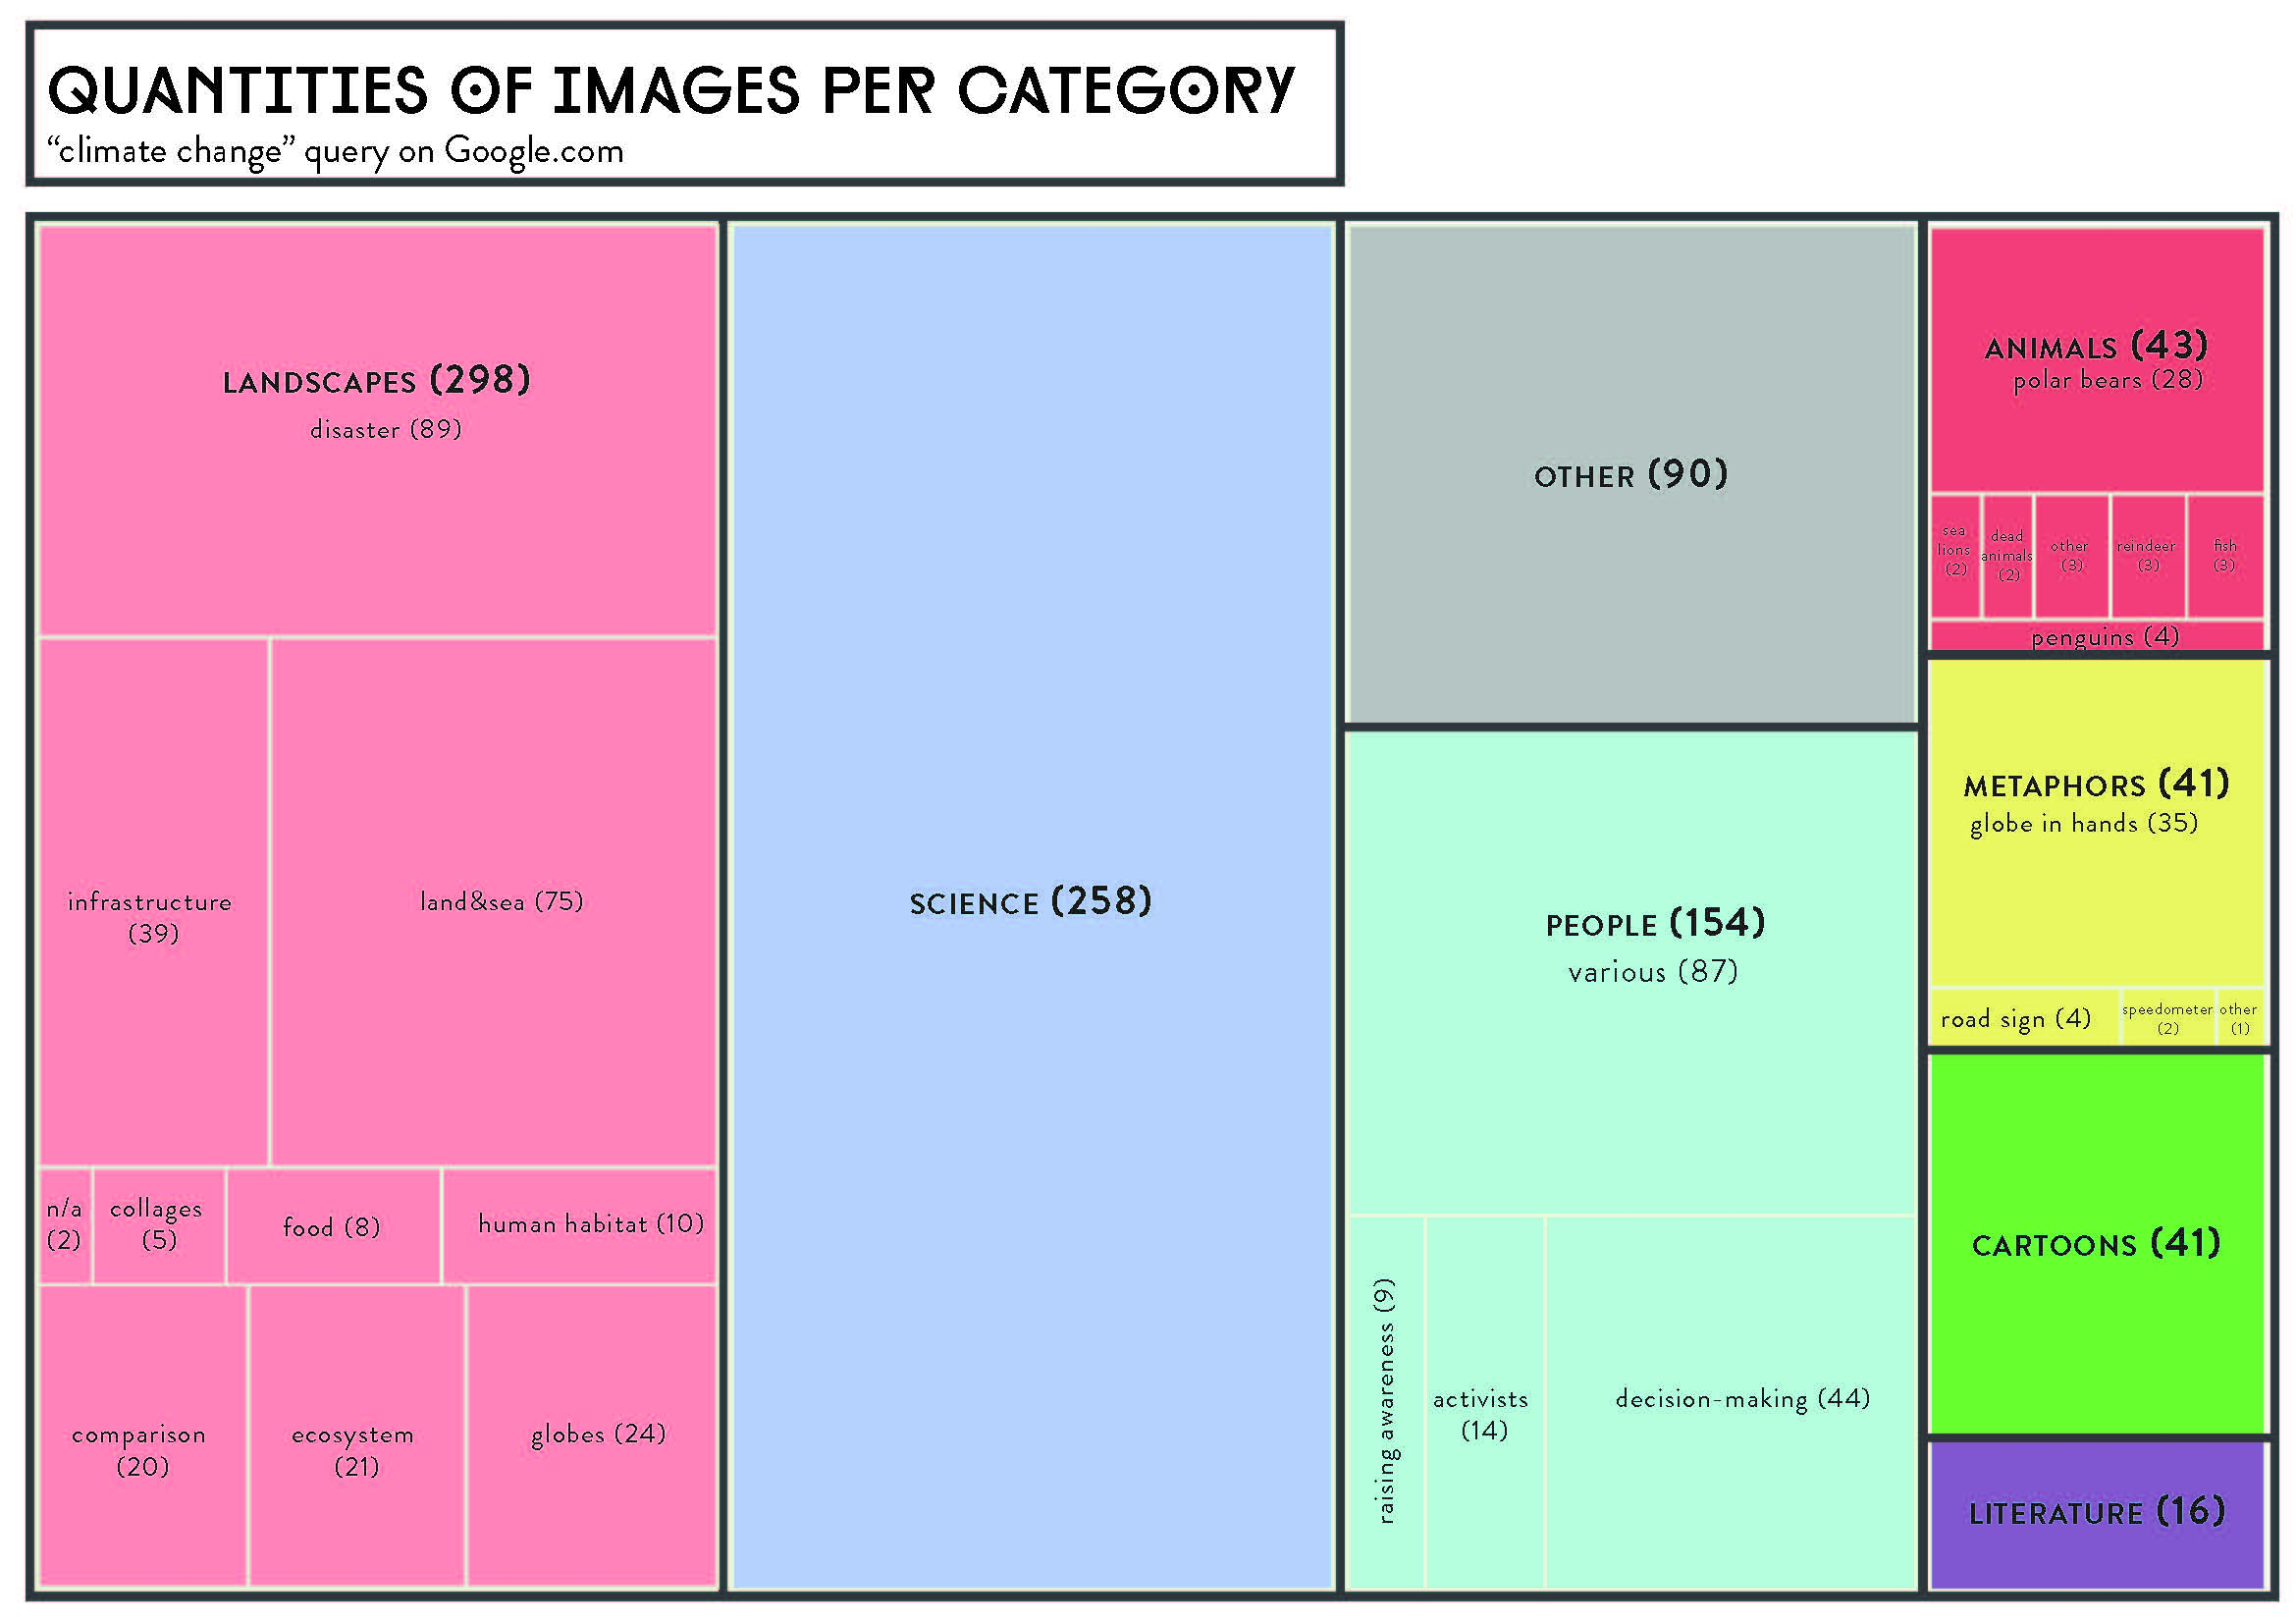
Figure Four: Tree map of categorized Climate Change images.
We then decided to zoom in on the imagery that Google images return for the subsets of the most (Figure Five) and the least vulnerable countries (Figure Six). We have queried Google Images with the respective queries: for most vulnerable: "climate change" (Afghanistan OR Angola OR Cambodia OR Laos OR Madagascar OR Mauritania OR Myanmar OR Niger) and for the least vulnerable: "climate change" (Cyprus OR Egypt OR Island OR Israel OR Luxembourg). The most dominant subset of climate change related images according to Google Images is Landscapes, Science and People. For the most vulnerable countries, the images are mostly related to landscapes and disasters. For the least vulnerable ones, the most resonating images are the ones related to people, decision-makers in particular.
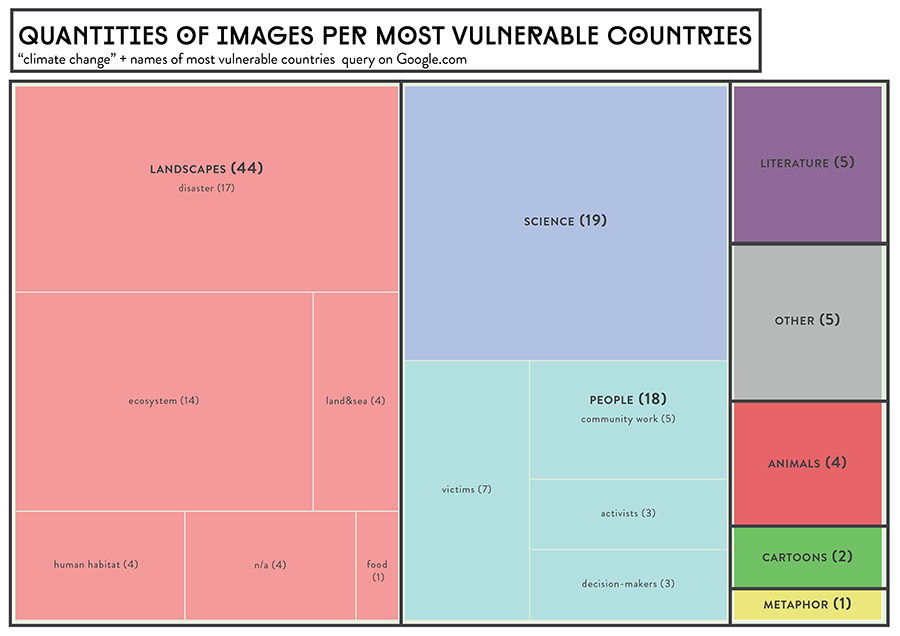
Figure Five: Quantities of images for the most climate vulnerable countries.
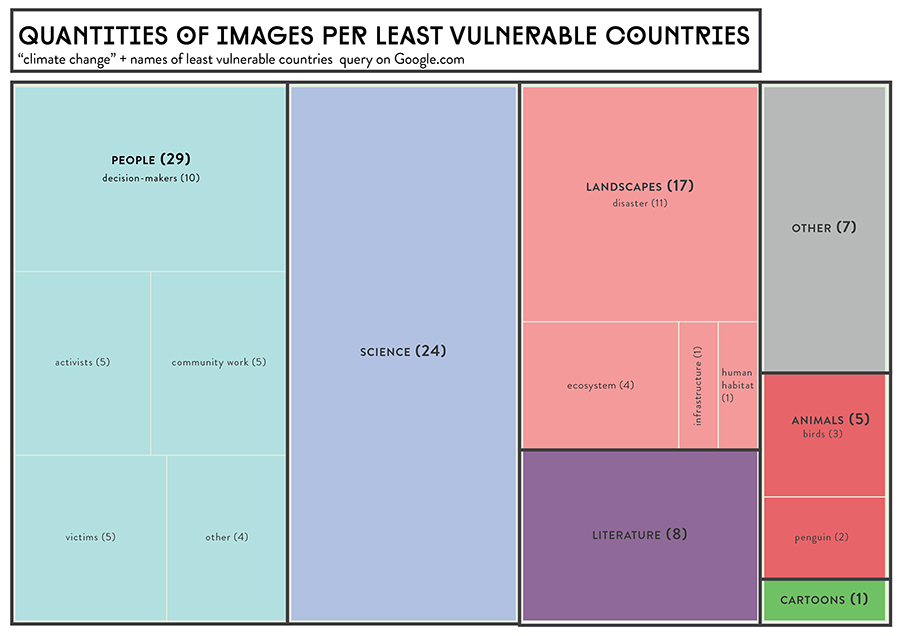
Figure Six: Quantities of images for the least climate vulnerable countries.
Climate Imagery: Landscape Panoramas
In addition to the quantification of the number of images into the Landscapes, Science, People, Animals, Cartoons, Literature, Metaphors and Other categories, we decided to zoom in on the Landscape imagery, which was translated, visually, into an Issue Landscape comprising panoramic representations of each indicator, grouped according to the subject matter shown in each image.
Discussion and Further Research
Further research: zooming in
Here, further analysis could be done of the resonance of countries per online issue space, and per sub-issue. The resonance per sub-issue could then be compared to the hot spots defined by the vulnerability indexes per variable (as listed in GAIN and DARA). Furthermore, additional sources could be used, such as blogs.
Another issue that deserves continued research concerns the countries that occurred as both vulnerable and resilient in the triangulated lists (see above, in a lined pattern on the vulnerability map). Such countries - US, Brazil Germany, Italy and Australia, among others - could have been scored both negatively and positively because of the very different indicators used by the sample indexes. For instance, Germanwatch focused on the effects of extreme weather, as quantified through human and financial loss, while GAIN and DARA captured other factors, such as health, infrastructure, habitat and ecosystems. Thus, it would be interesting to see, per sub-issue, why a country can rank both low and high, and also whether this contradiction is reflected by the Web.
Further research: zooming out
A meta view could be provided by repeating the analysis with the full list of 182 countries. Another meta view could be provided by comparing national Googles. Google offers about 115 local Google domains.

Ideas, requests, problems regarding Foswiki? Send feedback