Climate Change Studies on Adaptation Strategies in Germany and Central Europe: Mapping with Kompass Database
Data Sprint ReportIssue Mapping for Politics
Alexandros Valarakis, YooJin Chelsea Jang
Introduction
1.1. Climate Change Risk, Vulnerability and Adaptation
Coping with climate change can roughly be divided into two types; mitigation and adaptation. Mitigation includes such measures as reducing CO2 emission and preserve nature, and adaptation is adjusting or modifying the systems characteristics in order to cope with the climate change impact (Brooks 8). In most cases, both measures are taken by nation states or international institutions so as to simultaneously contain the temperature rise and minimise loss. Emphasising that vulnerability measurements should lead to decisions of adaptive actions, W. Niel Adger writes about adaptation: International action on climate change provides examples of how vulnerability challenges governance structures for adaptation. Adaptation is now discussed explicitly within the mechanisms of the Climate Change Convention and there are funds and strategies targeted at the most vulnerable countries (Adger 277). Indeed, adaptation is getting more and more attention in the research of climate change and vulnerability studies for its effect of reducing hazards of risks (Brooks 8). Therefore, devising effective adaptation strategies will create an optimized environment for the mitigation to take maximum effect .1.2. Climate Change Studies in Germany
Germany, along with other nations all around the world, has been under the risk of climate change. According to Potsdam Institute for Climate Impact Research, German climate has been changing since the 1900s, with changes in average temperature precipitation, and duration of snow cover (Zebish et al. 189). Competence Centre on Climate Impacts and Adaptation (KomPass) has set itself the task to promote climate change adaptation in Germany and Europe. It points out sustainable approaches and gives an impetus to the development of a society and environment that is adapted to climate change. One of the main tasks of KomPass is to develop the German Adaptation Strategy (DAS) and promote its implementation. For that purpose, KomPass pools and imparts expertise on climate impacts and potential adaptation measures, targeting authorities, scientists, industrial and environmental associations and also citizens. It seeks to promote the implementation and development of the German Strategy for Climate Change Adaptation (DAS) by the following measures: Policy advice, Environmental research, Provision of information, Networking and participation. (KomPass)1.3. Our database
As a part of its DAS development, KomPass put together Project Catalogue. The catalogue documents scientific projects in Germany and Central Europe, in order to generate basic knowledge on climate change adaptation to citizens and funders, as well as academia. Documentation and information are based on a special documentation and analysis matrix developed for the project catalogue, which allows a structured keyword search in the German environmental portal (PortalU) or on the KomPass website and thus provides an overview of the available information. It is created to inform stakeholders from research and research sponsors by collecting existing knowledge about climate impacts and adaptation, although the database is so vast that directly drawing insights from it appears to be difficult. Therefore, analysing the projects in depth and m apping the results using social cartography would match well with KomPass s cause, which is to provide transparent information about who are the actors and which are the matters of concern even to lay people.Research Questions and Hypotheses
Based on the EMAPS mission and communications with the KomPass team (September 2013, March 2014[1]) and after a first database review, the following research questions and hypotheses were formulated or refined: RQ 1. Which topics (sectors and fields of activity) are covered in the projects? > Are there any research gaps or are certain topics favored over others? > Is there a development of certain topics over the years? > Which topics co-occur in the same projects? Hypotheses 1. Sectors that are derived from direct climate change impacts have always attracted attention in research,whereas researches of which sectors that are concerned with indirect impacts started later. RQ 2. Are there any regional patterns of project funding? > Do topics of projects correspond with the climate change impacts that the regions face? Hypotheses 2. More vulnerable regions attract more attention for research. RQ 3. Are there any patterns in the structure of actors involved in the projects? > Who are the funders of climate change projects? > Who are the main actors (co-ordinators) in climate change projects? Hypotheses 3-1. Actors have focus on specific topics due to their specific research profile; possibly disregard other topics that falls out of interest. Hypotheses 3-2. Funders look for an equal share of funds, rather than for the actual need for research.Methods
3.1. Data Cleaning and Processing
Dataset collected by KomPass is an XML file that can be exploited by running Python to sift out only necessary data. It was processed multiple times to produce raw data to collect data from and add more data to. Following fields are extracted from or added to the dataset for the next step (putting data into map): 1. Title + Abstract 2. Start date + end date 3. Sectors and fields of activity 4. Involved actors (founders, coordinators, participants) 5. Target administrative region: 6. Target bio-geographical region: uncontrolled 7. Fundings3.2. Data into Maps
In order to answer Research Question 1, the first step was to assign each projects to the official topic categories of the German Adaptation Strategy (DAS; The Federal Government 2). Each project has descriptions about what their topics are in their abstracts as Sectors and fields of activity or Sectors and fields of action. This information was not coded into programmable fields, so the abstracts of the entire dataset were manually scraped in order to allocate each project to the corresponding sectors. To automatise the process, the coded field of uncontrolled keywords was allocated into most adequate sector category, which is later to be merged with the manually scraped data. The organised data[2] was added with start and end dates of each project operations. To see the temporal development of projects and topics and to test Hypothesis 1, distribution of the projects over time (figure 1) and distribution of sectors over time (figure 2) was measured. It must be mentioned that projects that are missing either one of start date or end date were assigned with three-years duration based on the expert suggestion that projects operate for three years on average. In order to examine the relevance of each sector have with one another, the co-occurrence of multiple sectors in same projects were calculated (figure 3). The more frequently they appear in the same project the tighter they would be related to another. To see if multiple sectors and fields of activity occurring in the same project will show which topics are of interest to the same actors. Studying topic co-occurrence is generally considered interesting as it have been a locus of the birth of sciences and described as pockets of innovation. To answer Research Question 2 and Hypothesis 2, data on the locational distribution of t he projects is juxtaposed with the previously studied report on vulnerability across places in Germany (Zebisch et al. 166). Vulnerability is a very complex concept to metrify and incorporate various methods and perspectives at the same time (Adger 274, see also Birkmann 55). For the same reason, Potsdam Institute for Climate Impact Research avoided to quantify the level of vulnerability because they did not want to pretend a precision that does not exist (Zebisch et al. 187)[3]. Moreover, vulnerability indices can be politically expropriated in many ways, measuring vulnerability levels according to the administrative divisions can create tensions among the regions. vulnerability with regards to 17 sector of interest was measured on bio-geographical map, which is a map that partitions Germany into areas that does not match with any administrative unit, but bio-geographic ones, of which the criteria include coastal, mountains, rivers, or lowland areas (figure 4). Overlapping two maps; loci of the projects and vulnerability map (figure 5), is to define the relationship between the number of projects and the geography of Germany and to investigate if the vulnerable places have more projects conducted in them. In other words, with this map we get an overview of the distribution of projects in relation to the of the vulnerability of each area. D istribution of the projects according to their target areas was done by manually refining uncontrolled location keywords to match with the vulnerability definition areas, and by automatically and manually checking the abstract of the projects to incorporate more locations[4] (figure 6). This data is matched with specific risks of climate change for each natural areas with the number of projects concerning the relevant sectors. Vulnerability map shows to which risks each bio-geographical area is more susceptible, and the vulnerability levels to the risks of flood, drought, agriculture, forestry, diseases and heat waves compared to the number of projects that are meant to counter-measure these risks are depicted in the following six maps (figure 7-12). The allocation of the number of projects for each areas offers a first insight on whether the more vulnerable zones are getting the necessary attention. For more logic in the analysis, additional information on funding of each projects will show which topics are most prone to be funded and thus regarded most interesting and fundable. Then, it is possible to prioritise the topics (sectors and fields of activity) of the projects and which ones are favored over others. In order to fully answer this question, money matter has to be considered. Accurate data for fundings for each region and adding that layer onto the number of projects will be able to show a more concrete map of the vulnerable areas. Two highly vulnerable areas are selected to analyse their funding situation, and in order to have a good comparison, additional region with lower vulnerability was chosen to collect funding data for (figure 13). Funding data[5] was collected, mainly from the following sources: Google (Web search), UFORDAT (German environment-related projects), Federal Government (BMBF, BMU, Federal Ministries), INTERREG (only projects with German participation), CORDIS (EU projects, 5th, 6th, 7th FP, ). The final Research Question will be answered by determining the key actors involved in the reports and map down any potential patterns. Hence, we identified the project funders and coordinators[6] and established the connections between them using the sectors as a correlation point (figure 14).Findings
4.1. Description and interpretation of maps
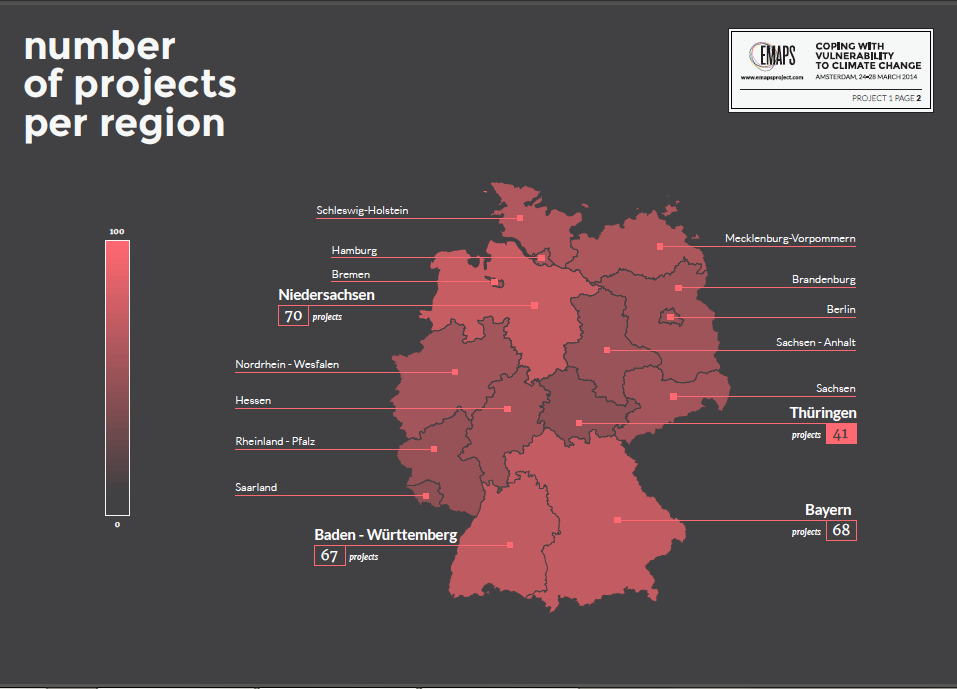
Visualisations are made to offer firstly an overview of the topics that are covered in the projects and their association with one another. The maps should be interpreted bearing questions such as; whether there are any research gaps; whether there are certain topics favored over others; whether there is a change in research trends over the years; or if researches are done according to necessity. In the following section, significant findings will be pointed out a. The map projects per sectors over time (figure 2) proves right our hypothesis 1. (Sectors that are derived from direct climate change impacts have always attracted attention in research,whereas researches of which sectors that are concerned with indirect impacts started later.) Directly influenced sectors and fields of activity - already started to get attention from the researchers since the early years, whereas sectors that relates to indirect impacts started to get full-fledged attention around 2005 and appear to be catching up. b. Project per areas over time (figure 15) map shows significant increase in the number of projects allocated in the vulnerable zones since 2005. Taking into account that the highly vulnerable bio-geographical areas in Germany were defined back in 2005 (Zebisch 171), this result offers a careful speculation that this increase is a strategic shifting of research attention towards the most vulnerable areas, caused by the 2005 vulnerability report. c. Number of projects per region map (figure 16) indicates that there is no visible correlation between administrative division of Germany and the distribution of the number of projects. As it can be seen, projects are mostly evenly distributed when organised by administrative regions. This fact allows us to speculate that there could be something of a political equilibrium in the sense that all administrations should be equally treated in terms of project allocations. d. Adaptation projects per natural areas map (figure 6) indicates that in general, projects are evenly distributed also in the bio-geographical regions, even though the shift of research focus towards the vulnerable areas (see section b above) is apparent. This was further proven by two maps; specific vulnerabilities of natural areas compared to number of projects concerning the relative sectors map (figure 7-12), which matches the distribution of projects on specific sectors that are countermeasures to particular risks with the vulnerability map of that particular risks; and amount of funding for projects in specific areas map (figure 13) which shows that highly vulnerable areas do not specially get funded more . e. Sectors co-occurrence map (figure 3) clearly shows that topics of the direct impact category appear to co-occur more closely than ones of indirect impact.Discussions
5.1. Difficulties
One of the difficulties encountered during the research was the inconsistency of the data set. Some entries did not include the necessary information that others did. For example, in some cases data on sectors and fields of activity were missing in the scraped abstracts so they had to be additionally defined by uncontrolled keywords. These inconsistencies prohibit the researchers to accumulate the necessary data with automated - computational methods and require manual scraping of information. In the case of this dataset, which is consisted of 291 project, it was possible to operationalise the research manually, however if the catalogue was concerned with a more international, and thus bigger dataset, then this factor can be a big obstacle.5.2. Suggestions
One of the factors that this research proved to be really crucial in order to substantiate results was the funding data of the projects. Even though funding data can provide much richer perspective on the research, Kompass dataset unfortunately did not include this information and the retrivement of such data was difficult. During the data sprint, it was only possible to find funding information for ⅔ of the needed projects. The enrichment of the dataset with such information will improve future researches by allowing more correlations to emerge. Funding data can lead to answers to such questions as which projects are considered to be worthy of funding and more importantly if there are any power relations among the actors. This kind of expansion of this research will work in favor of transparency in the works of KomPass and DAS. The visualisations created in EMAPS Data Sprint can be potentially used in KomPass implementation processes such as policy advice, provision of information, networking and participation. The refinement and mapping of the current dataset can support KomPass internal work by enhancing the communication - cooperation with other political actors and helping to identify the focus of future activities. Finally, this visual representation of the index of adaptation projects can assist KomPass information and communication activities to the public.Appendix: Visualisations
Figure 1. Project over time Figure 2. Projects per sectors over time Figure 2. Projects per sectors over time Figure 3. Sectors co-occurrence Figure 4. Natural areas specificities Figure 5. General vulnerability of natural areas Figure 6. Adaptation projects per natural areas Figure 7. Specific vulnerabilities of natural areas compared to number of projects concerning the relative sectors: Flood Figure 8. Specific vulnerabilities of natural areas compared to number of projects concerning the relative sectors: Drought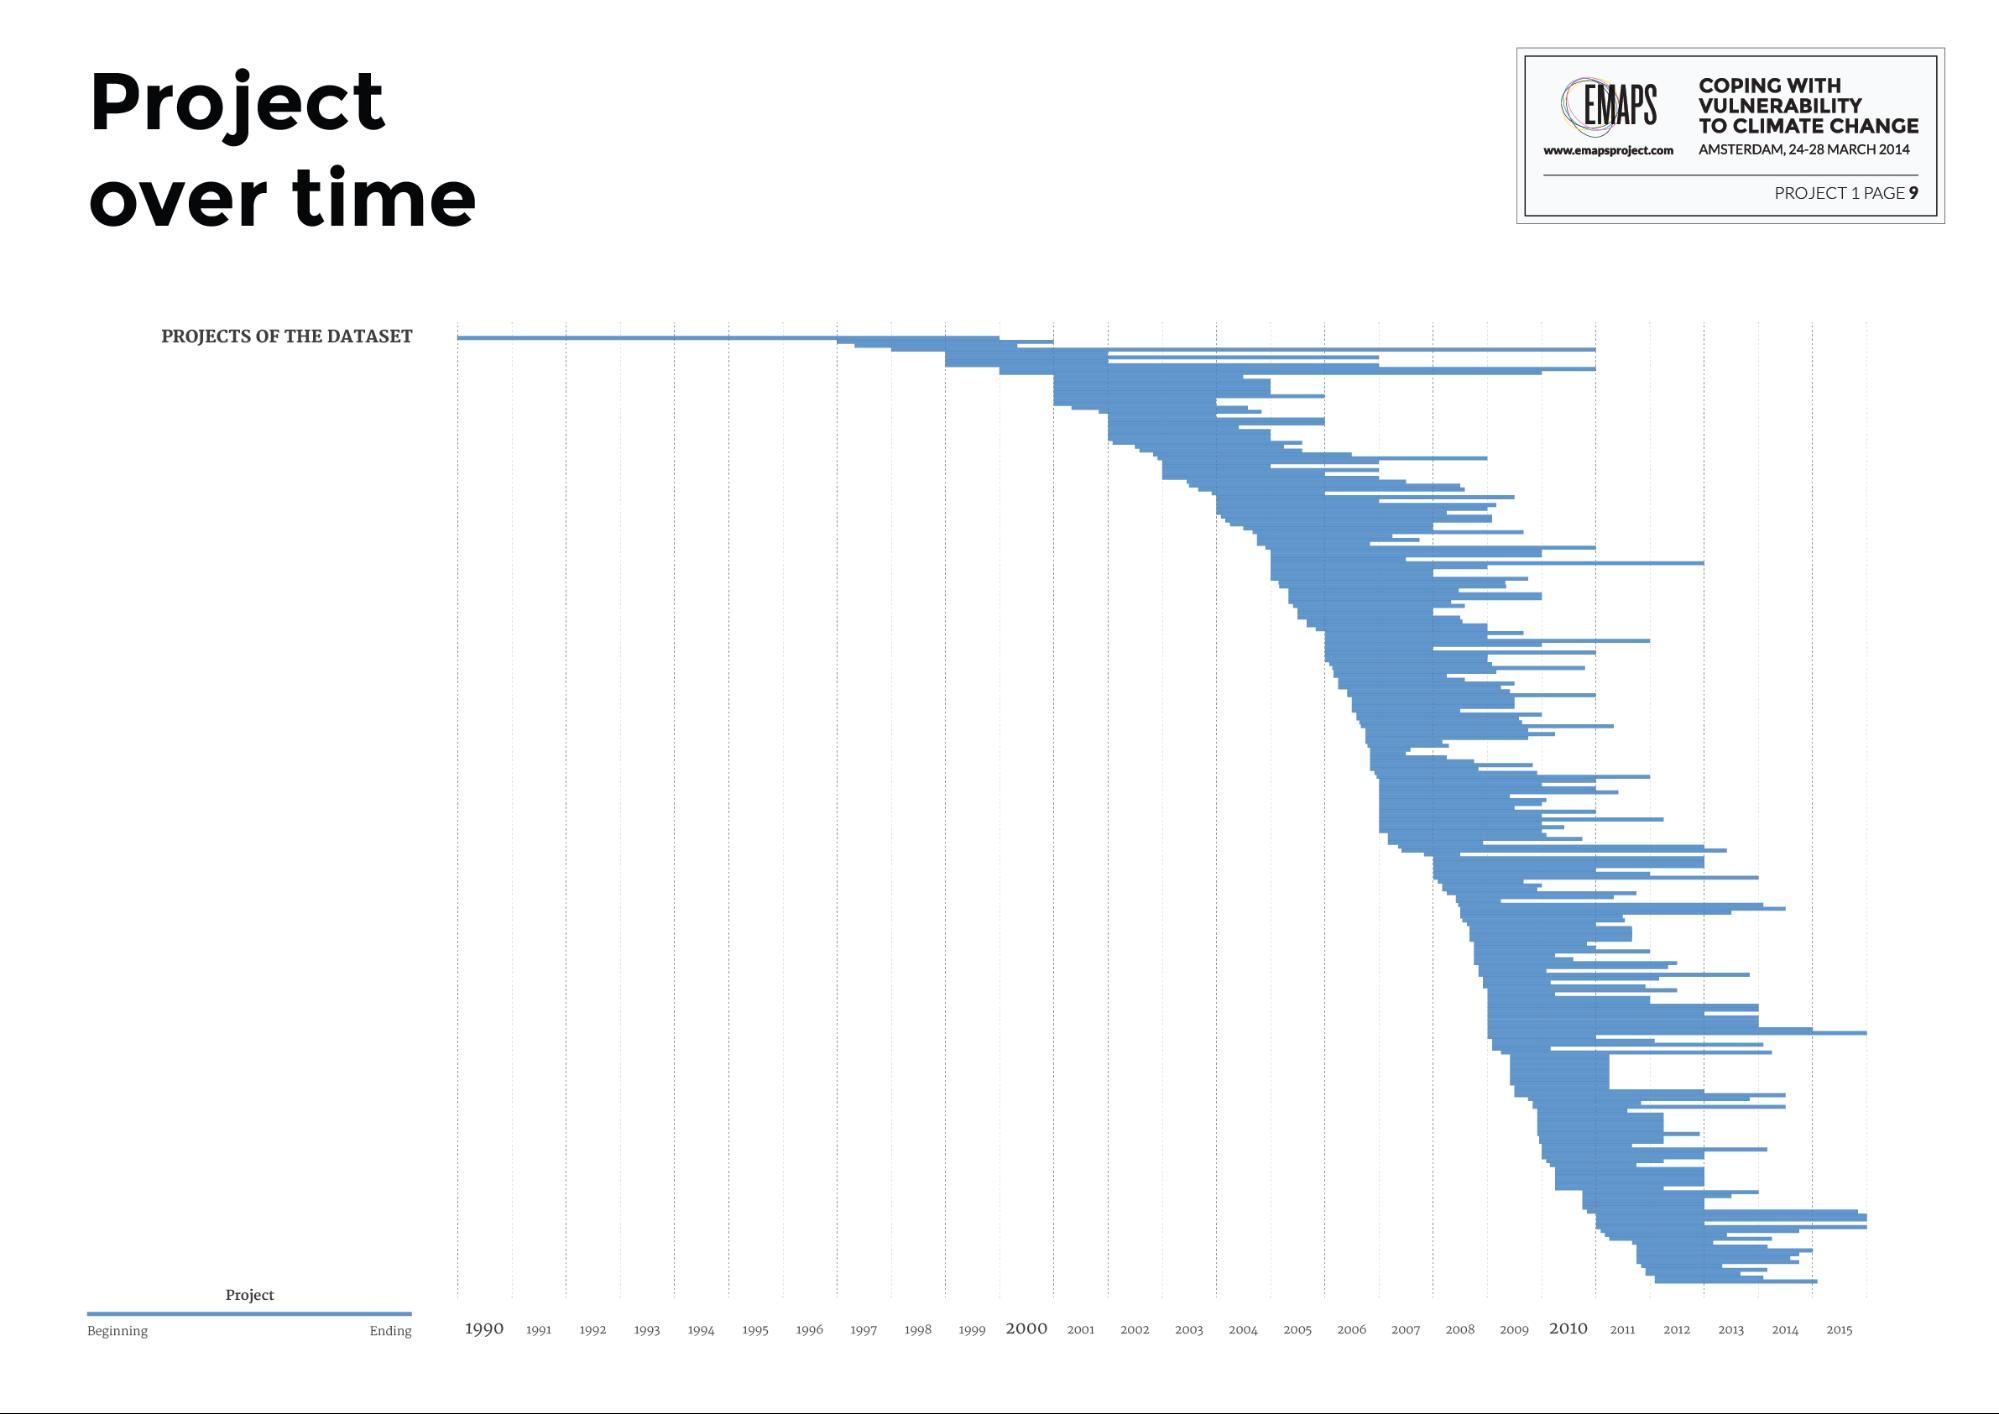
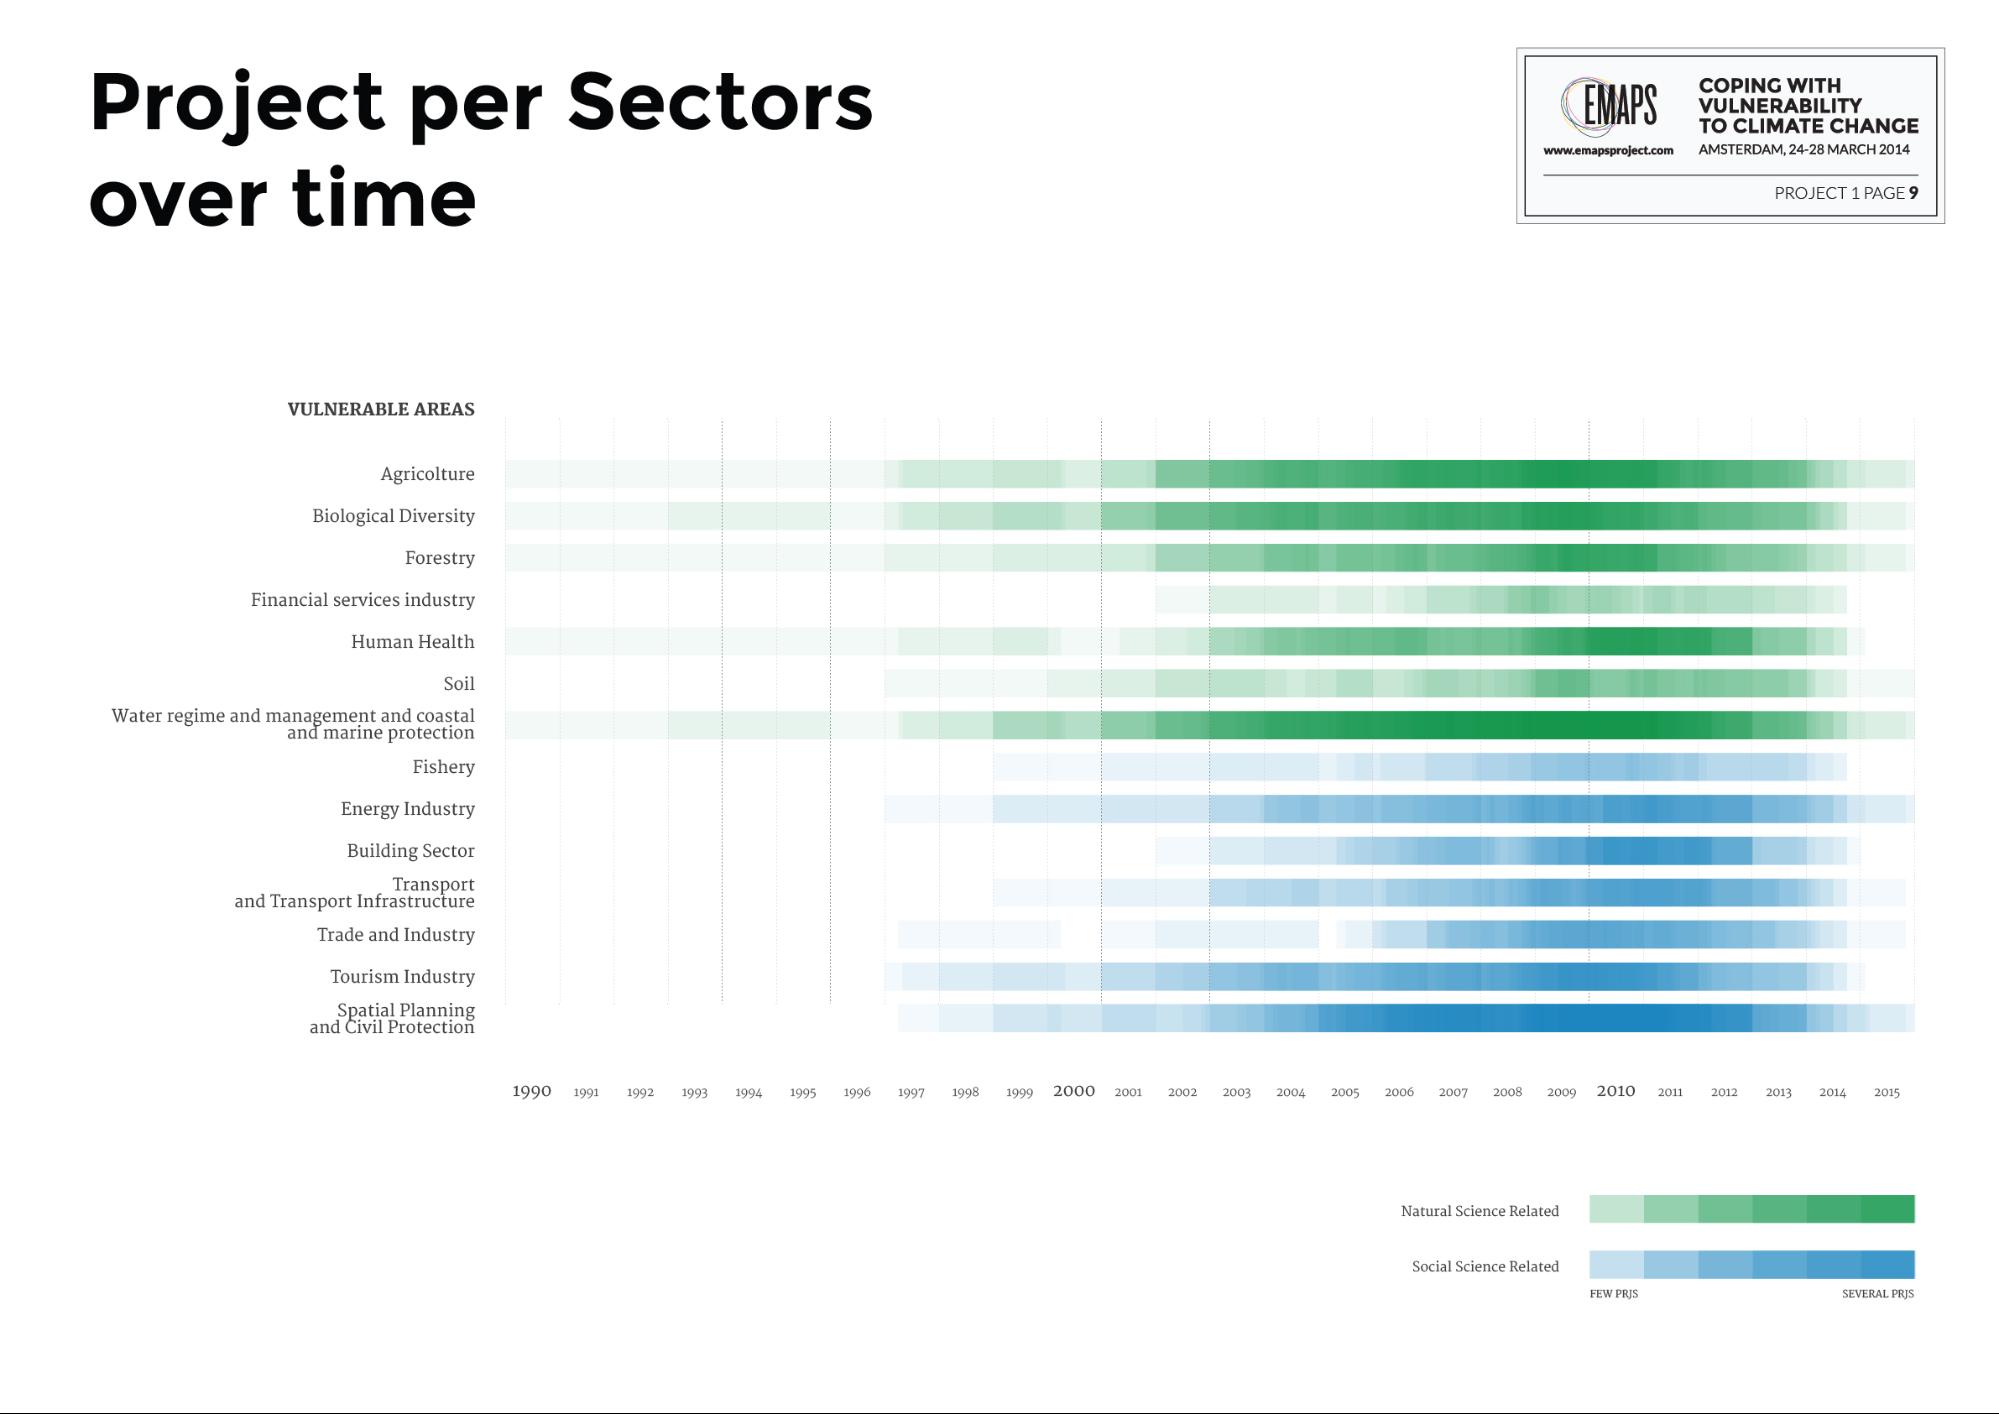
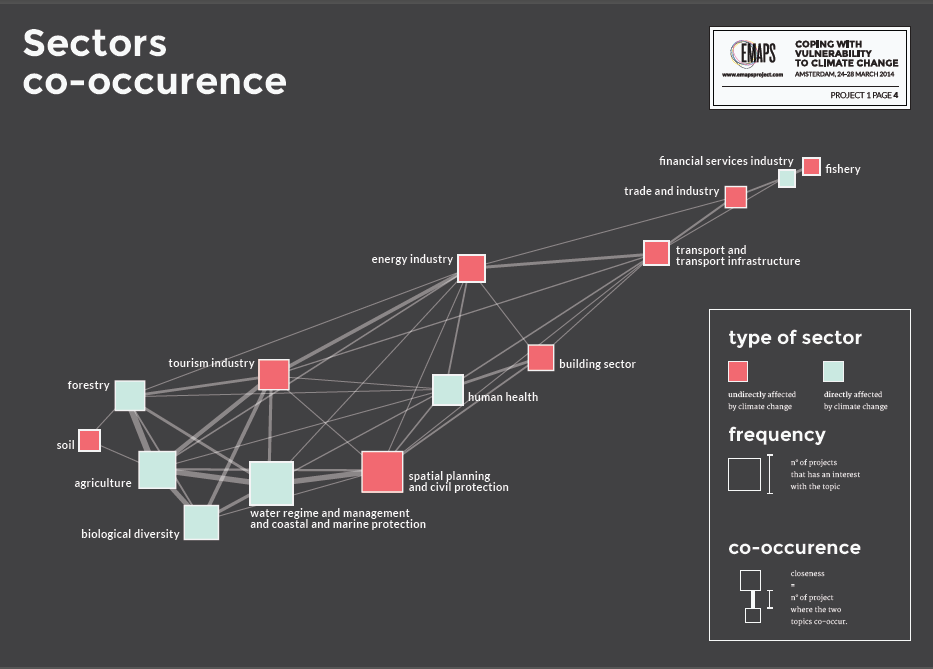
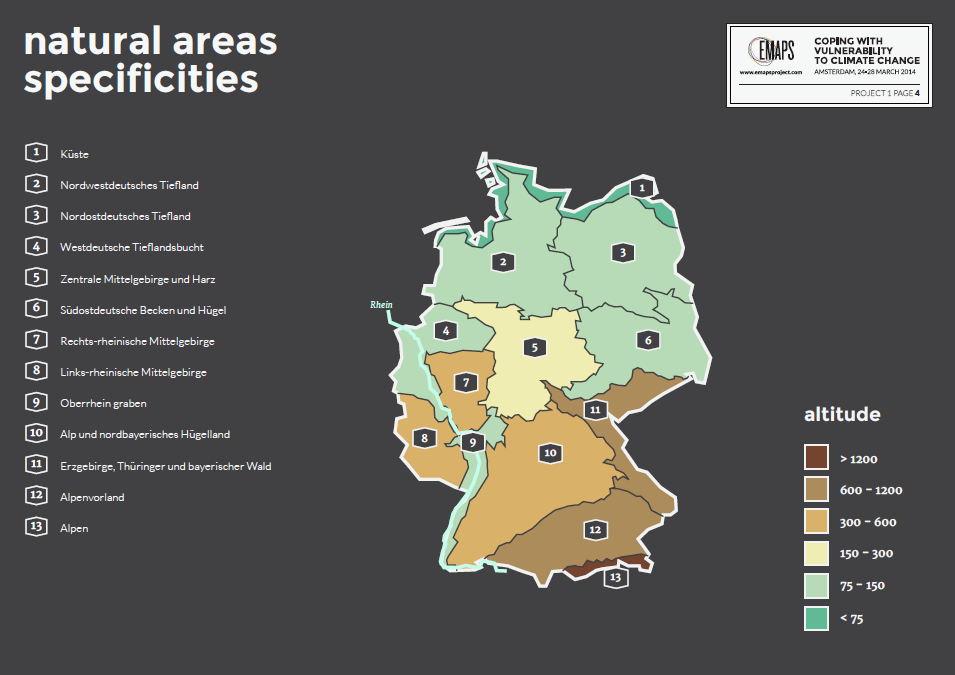
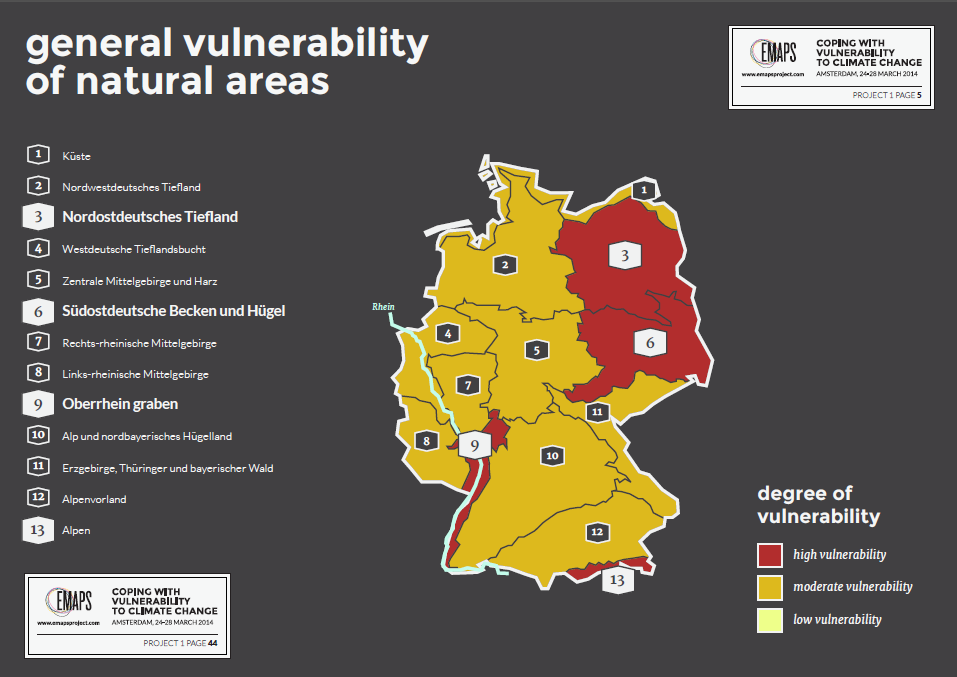
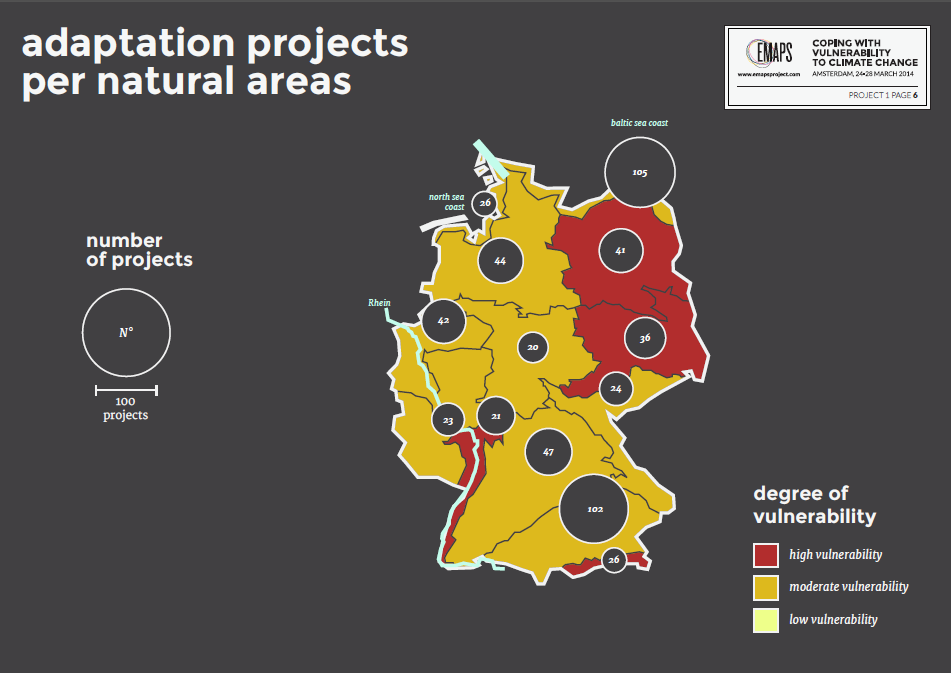
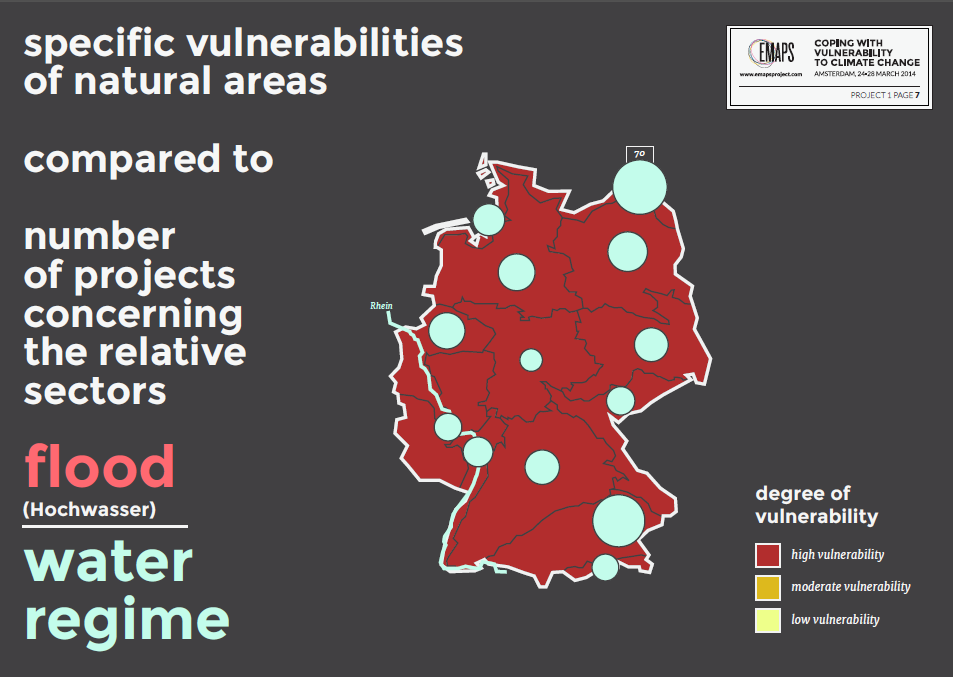
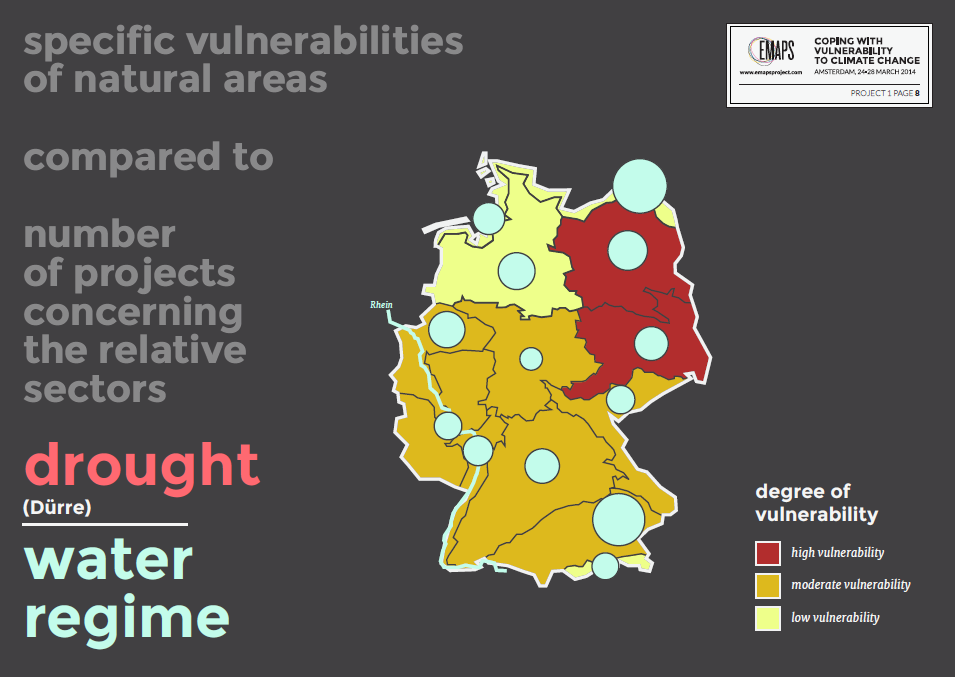
Figure 9. Specific vulnerabilities of natural areas compared to number of projects concerning the relative sectors: Agriculture
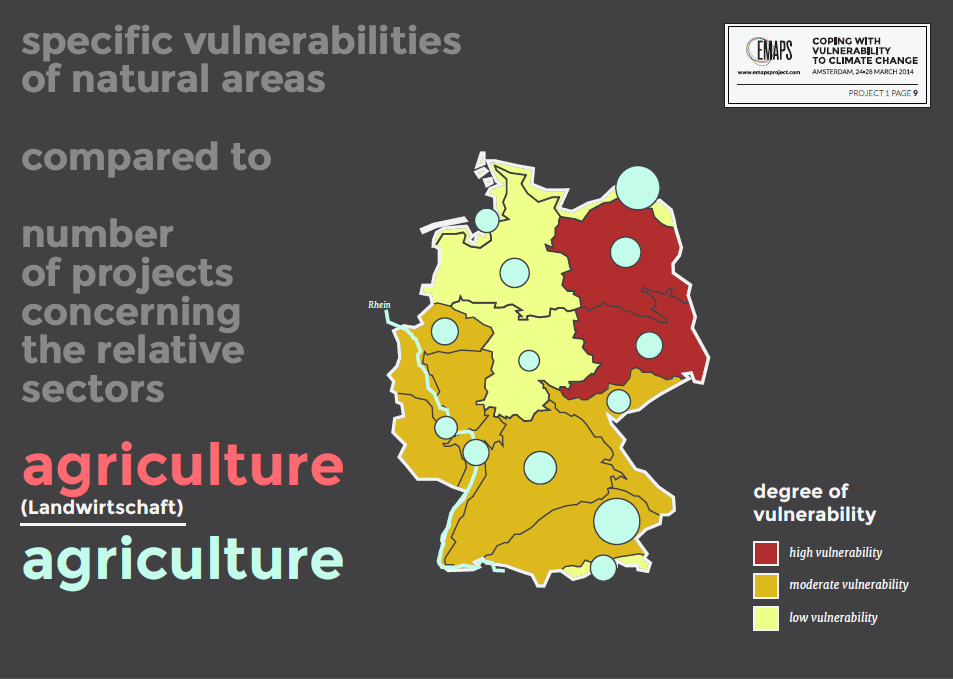
Figure 10. Specific vulnerabilities of natural areas compared to number of projects concerning the relative sectors: Forestry
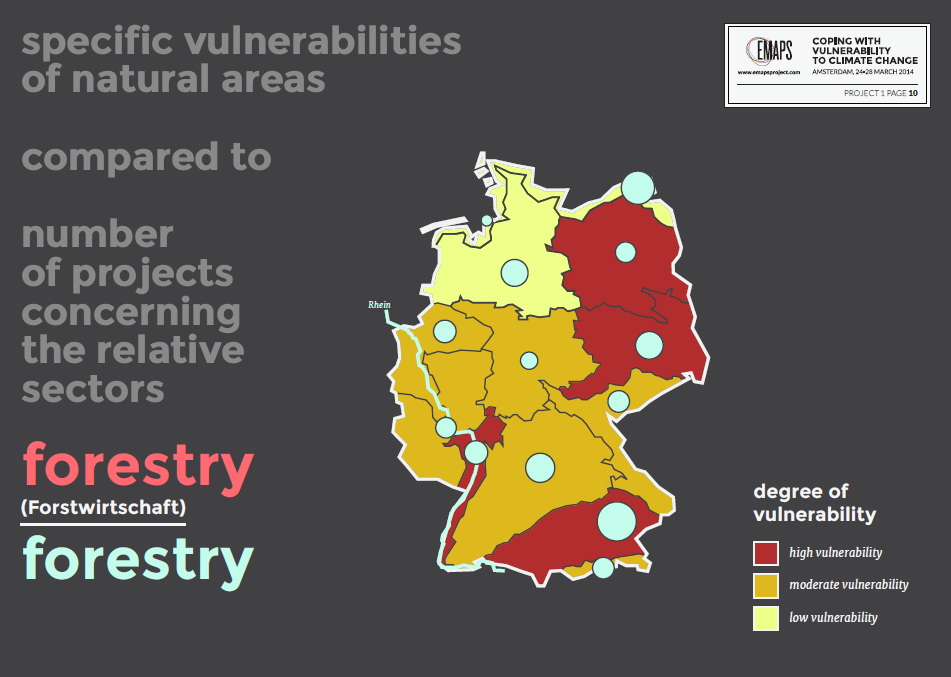
Figure 11. Specific vulnerabilities of natural areas compared to number of projects concerning the relative sectors: Diseases
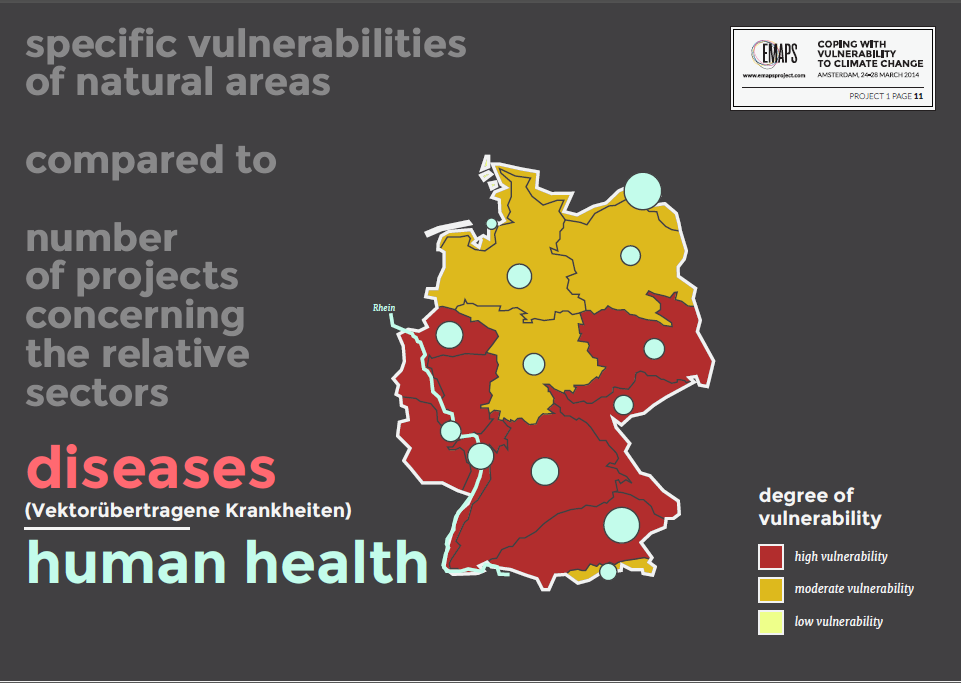
Figure 12. Specific vulnerabilities of natural areas compared to number of projects concerning the relative sectors: Heatwaves
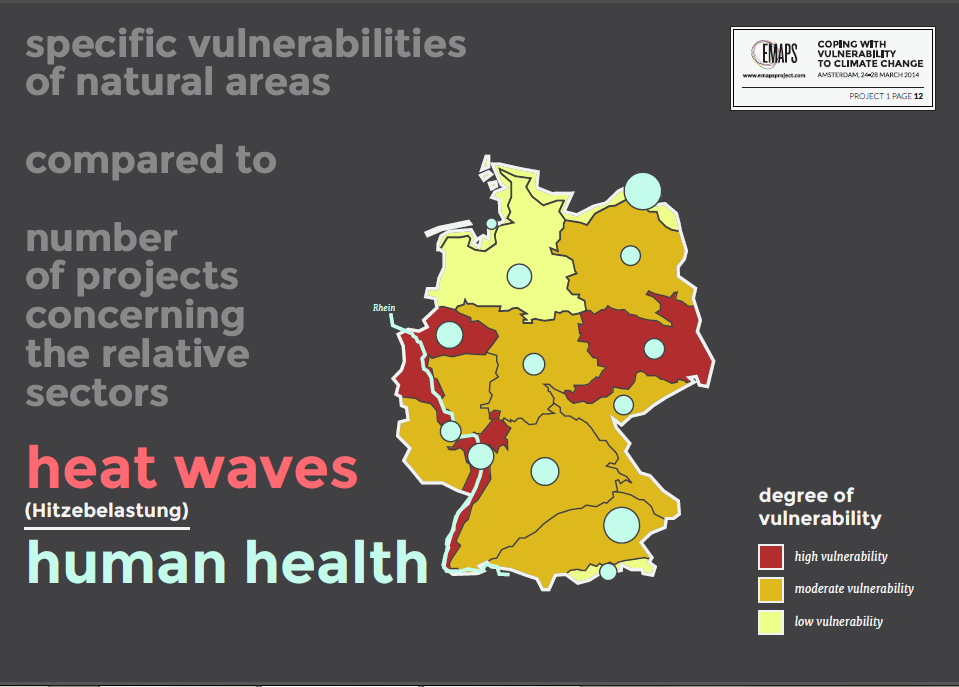
Figure 13. Amount of funding for projects in specific areas
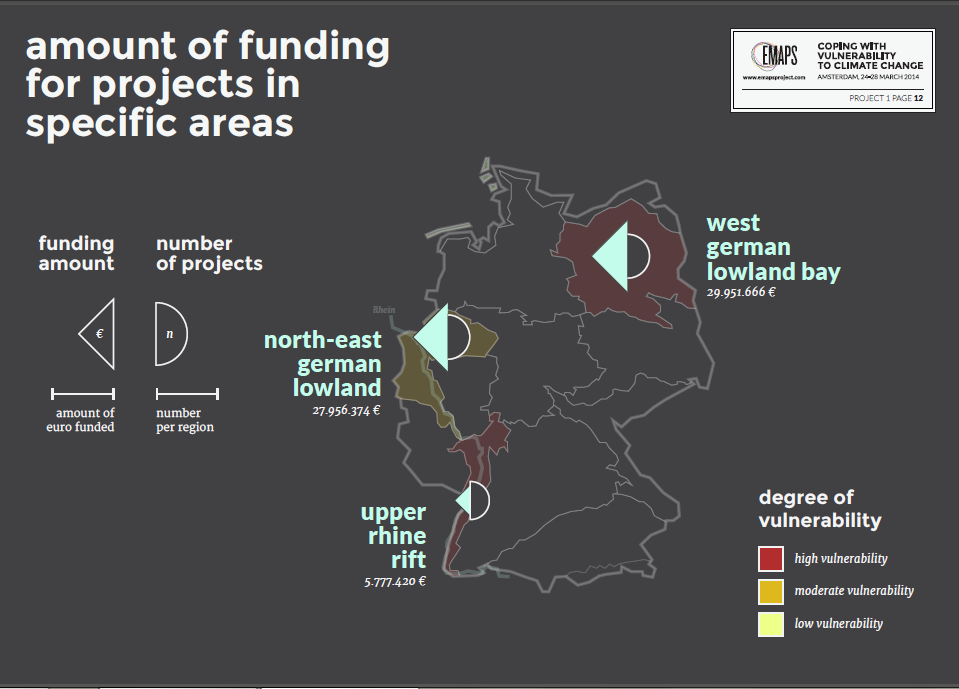
Figure 14. Actors overview
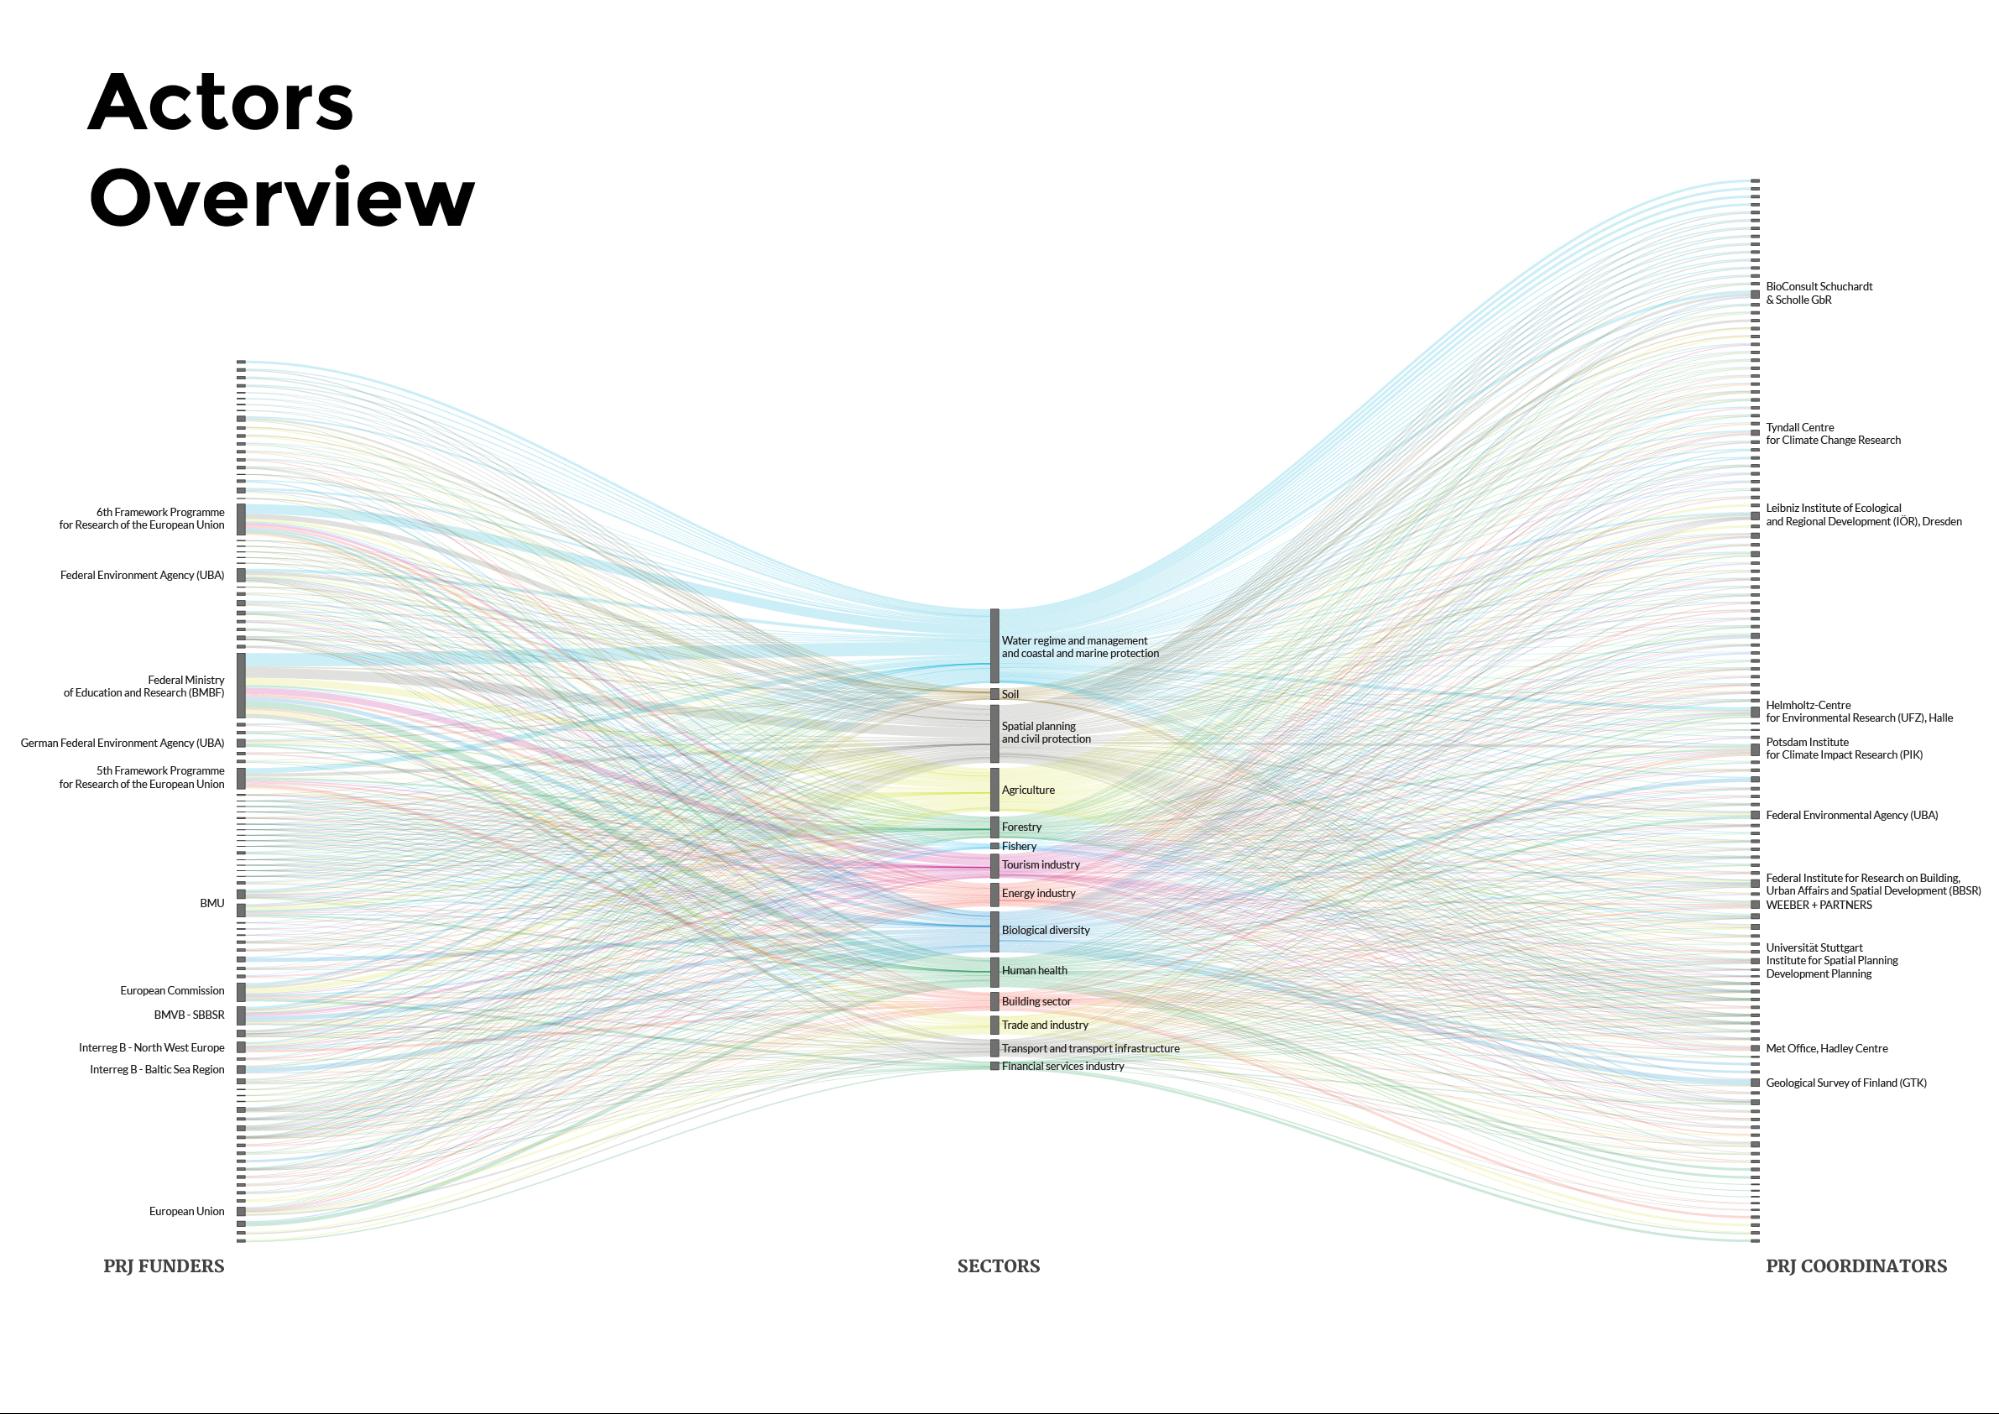
Figure 15. Project per areas over time
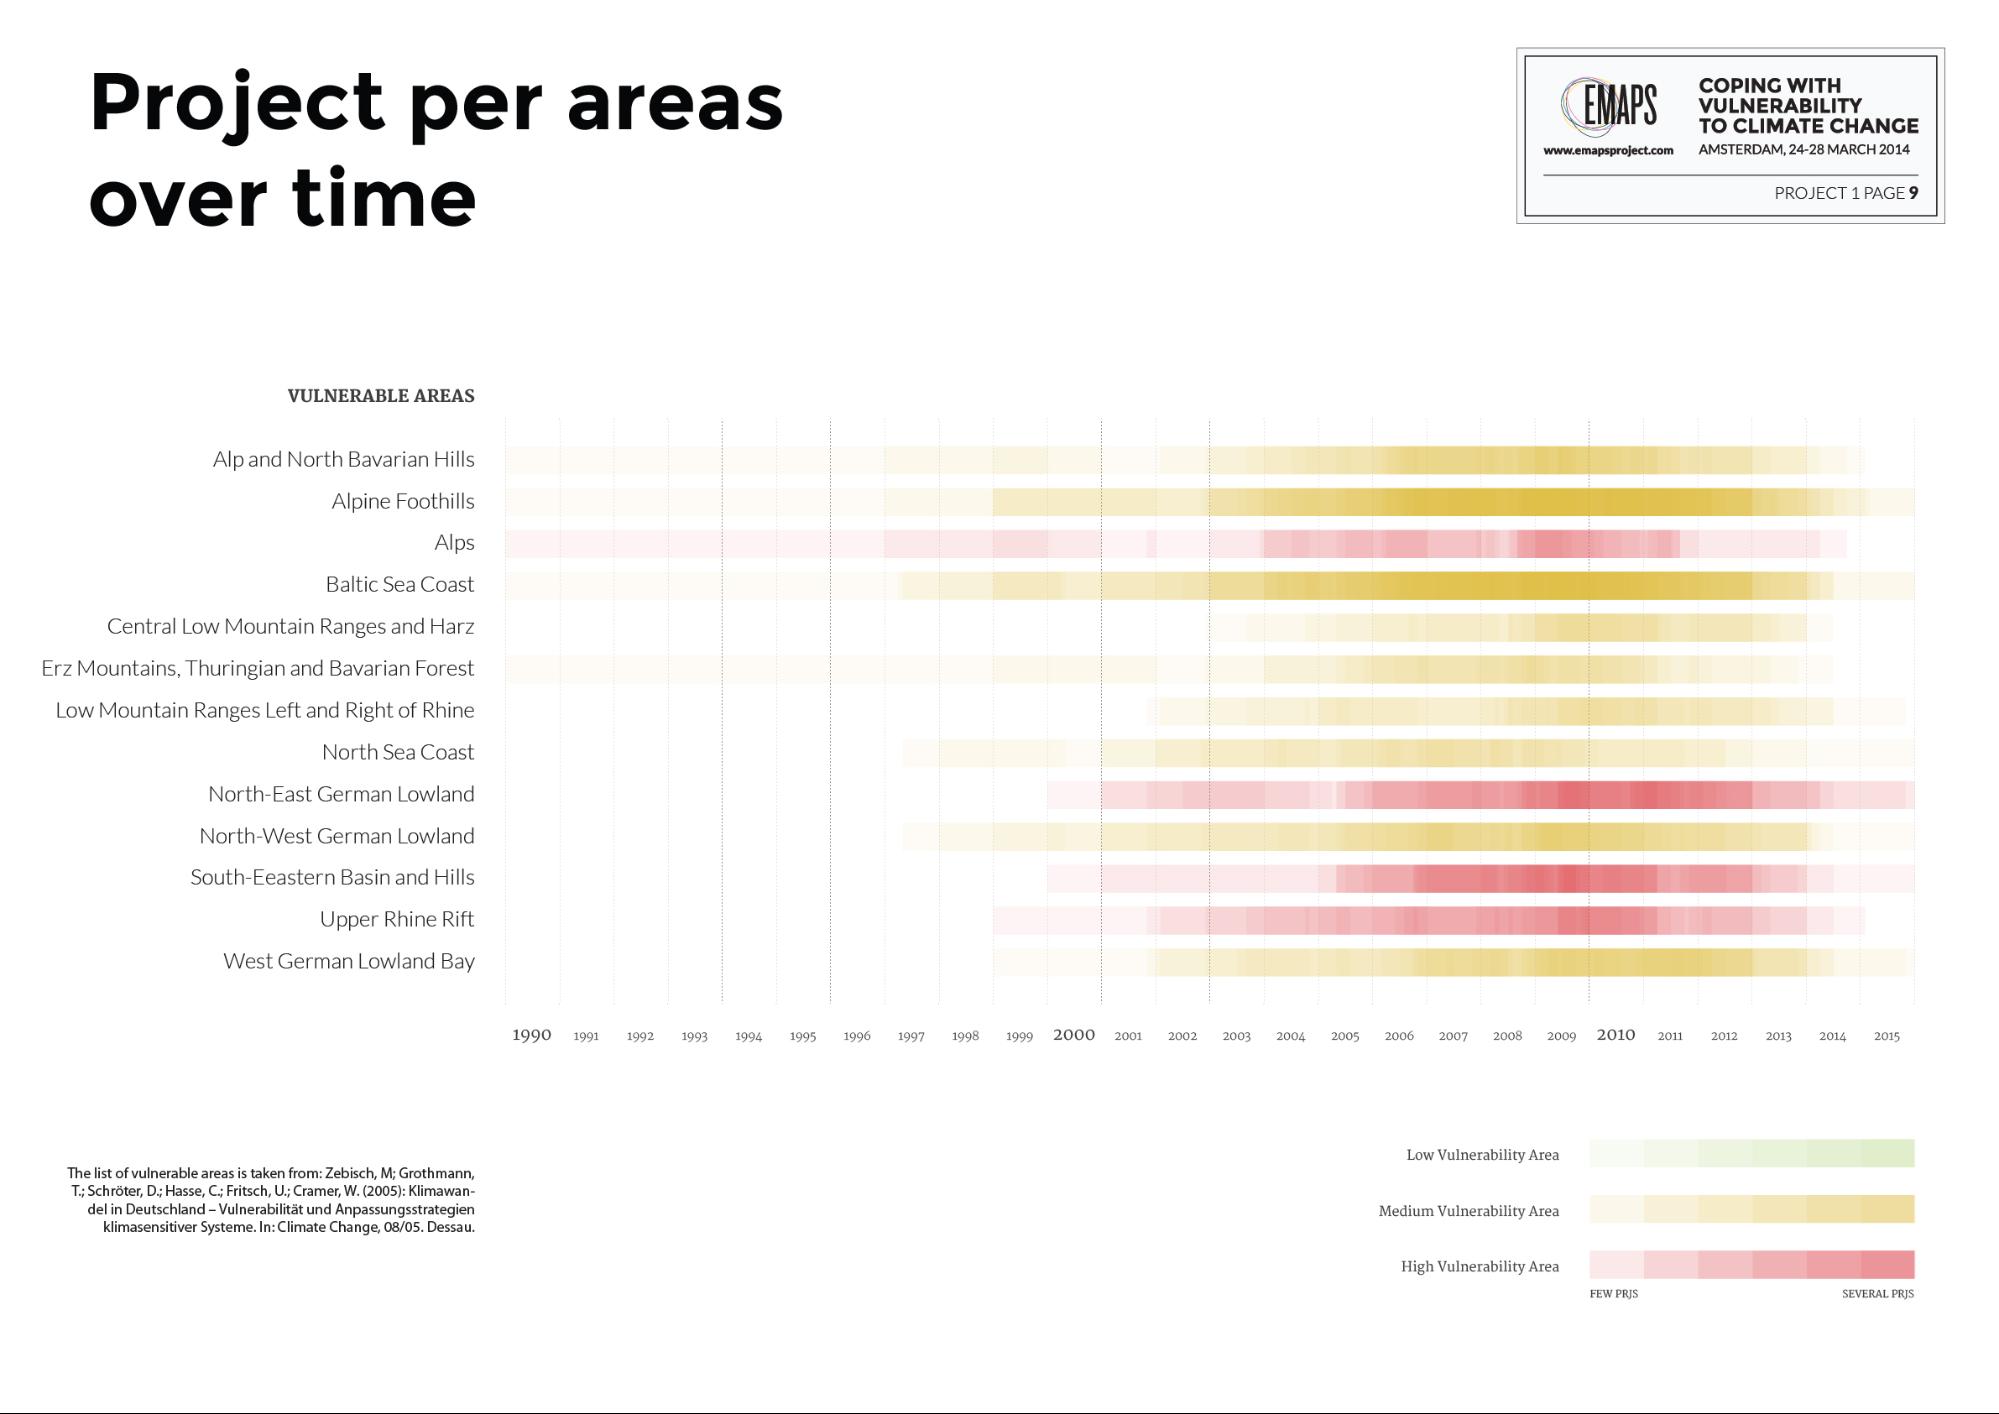
Figure 16. Number of projects per region
References
Adger, W. Niel. Vulnerability. Global Environmental Change 2006: 16. 268281. Zebisch, Mark et al. Climate Change in Germany Vulnerability and Adaptation of climate sensitive Sectors. Potsdam Institute for Climate Impact Research. 2005. 1-205. Brooks, Nick. Vulnerability, risk and adaptation: A conceptual framework. Tyndall Centre for Climate Change Research. 2003. 1-16. Birkmann, Jörn. 2. Indicators and criteria for measuring vulnerability: Theoretical bases and requirements. Measuring Vulnerability to Natural Hazards. Ed. Birkmann, Jörn. New Delhi: United Nations University, 2006. 55-77. Print. KomPass. The Competence Centre on Climate Impacts and Adaptation (KomPass) Umwelt Bundesamt. 20 Aug. 2013. Web. 02 Apr. 2014. <http://www.umweltbundesamt.de/en/topics/climate-energy/climate-change-adaptation/kompass>[1] Communication with KomPass team was done by Mark Fleischhauer during EMAPS datasprint, (mark.fleischhauer@tu-dortmundREMOVE_ME.de) [2] For data, see Sectors in shared document [3] Zebisch et al.s vulnerability measurements are in three levels; high, mid and low, instead of quantified numbers. [4] See column vulnerability area in Project_funding for the assignment of projects areas [5] See Project_funding [6] See actors
This topic: Dmi > VulnerabilityClimateChange > EmapsAmsterdamSprint2014Project1ClimateChangeStudiesOnAdaptationStrategiesInGermanyAndCentralEuropeMappingWithKompassDatabase
Topic revision: 07 Apr 2014, ErikBorra
Topic revision: 07 Apr 2014, ErikBorra
Ideas, requests, problems regarding Foswiki? Send feedback