You are here: Foswiki>Dmi Web>GovcomorgJubilee>CyberLands>CoWordLifeline (31 Jul 2012, NoortjeMarres)Edit Attach
Climate Change on Twitter: Hashtag Lifelines and Actor Profiles
Members
Noortje Marres, Carolin Gerlitz, Esther Weltevrede, David Moats, Sara Kjellberg, Tally Yaacobi-Gross, Jill Hopke, Kalina Dancheva, Diego Dacal, Alessandro Brunetti, Johannes Passmann, Albrecht Hofheinz, Colleen Reilly.Introduction
This project deploys hashtag mining and related techniques to analyse issue dynamics on Twitter. We approach hashtags as a heuristic for analysing the 'liveliness' of issues with Twitter. We ask: does the ‘behaviour’ of hashtags over time provide a useful indicator of wider issue dynamics in this space? More specifically, we wish to examine the differences between two types of measures for detecting the variability of hashtags over time: frequency and co-word analysis. Frequency measures form an integral part of both the Twitter platform and much Twitter research, as they provide indications of the rise and fall of terms and users, feeding interest and investment in the increase and decrease of user activity, key-word mentions, and so on. Co-word analysis arguably provides an alternative to frequency measures to detect activity online. Co-word analysis can be used to document shifts in thematic associations over time, and it can help to make visible variation in the composition of issues. The overall aim of the project is to examine different measures for analysing issue liveliness on Twitter (frequency, co-word), by applying them to a specific data set, climate change tweets collected during a three month interval. Img. Tweet activity vs. key word lifeline.
Background
What is co-word analysis? Co- word analysis is a method of content analysis that makes textual data amendable to network analysis. Co-word analysis works by detecting word pairs or ‘co-occurrences’: words that occur in each others’s vicinity (word distance of say 3, 4 or 5 words), and proceeds by weighing these word relations (assigning them values in terms of relative strength and quantity of connections). Combining these measures, co-word analysis in principle makes it possible to detect the emergence of new significant themes, so called ‘pockets of innovation’ and, more generally, changes in thematic associations over time (Callon et al, 1983; Danowski, 2009). Happening content. Co-word analysis has been included in a variety of digital research and online visualisation tools (eg Infomous; Wordij). The form of analysis gained special relevance in the context of digital research and allows to address the phenomenon of ‘happening content’: the dynamic nature of online information ecologies as well as issues which raises the question of how to detect, valuate and display significant variation in and of data. Fresh terms may arise, new reports are released, and events occur that can shift the relations among actors and issues, and so the question arises how best to capture, analyse and render such change. In this sense, co-word analysis enables us to study 'happening content': it offers a way to detect fluctuations in networked content, as an alternative, or addition, to more established 'methods of the medium', such as inlink or follower counts or the measurement of word frequency.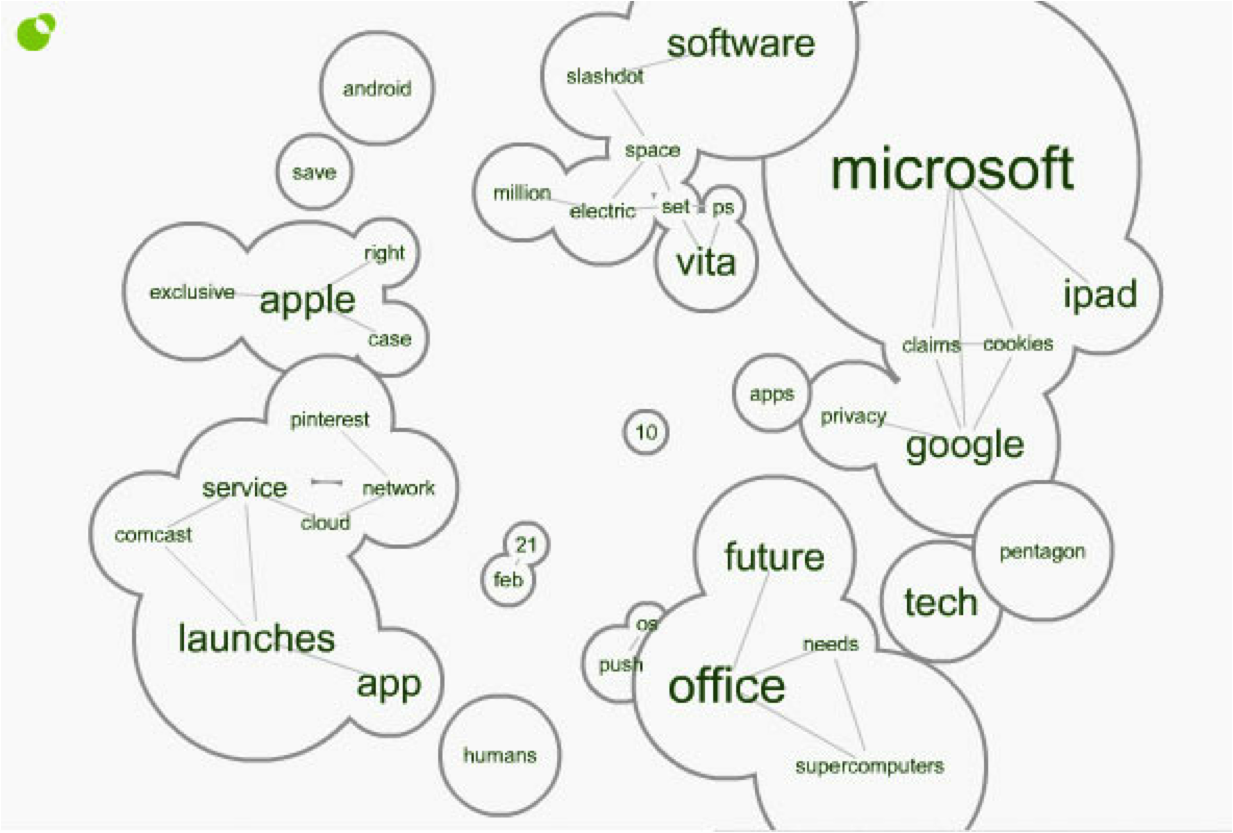 Img. Infamous co-word map
As co-word analysis offers a way to study the happening and variation of content, it can also be called a form of 'real-time research' (see for a discussion Back and Lury, forthcoming). But co-word analysis gives a particular spin to this, as it does not focus on liveness, on what is current and hot right now, but traces variation of key-word relations over time. As co-word analysis foregrounds significant variation of content over time, we can say it focuses on liveliness instead (Marres and Weltevrede 2012).
Studying Liveliness. This project seeks to deploy co-word analysis for a specific empirical purpose: to determine the liveliness of issues by analysing issues and actors associated with a set of Tweets, related to climate change. We would like to detect the rate of change and variation of co-word relations in this specific data set over time. To do this, we will concentrate on analysing the ‘associational profiles’ of selected key-hashtags: the URLS and hashtags that these key hashtags are associated with on Twitter in specific periods of time. Documenting changes in the associational profiles of key-words between different intervals, it becomes possible to analyse issue variability, or liveliness.
Img. Infamous co-word map
As co-word analysis offers a way to study the happening and variation of content, it can also be called a form of 'real-time research' (see for a discussion Back and Lury, forthcoming). But co-word analysis gives a particular spin to this, as it does not focus on liveness, on what is current and hot right now, but traces variation of key-word relations over time. As co-word analysis foregrounds significant variation of content over time, we can say it focuses on liveliness instead (Marres and Weltevrede 2012).
Studying Liveliness. This project seeks to deploy co-word analysis for a specific empirical purpose: to determine the liveliness of issues by analysing issues and actors associated with a set of Tweets, related to climate change. We would like to detect the rate of change and variation of co-word relations in this specific data set over time. To do this, we will concentrate on analysing the ‘associational profiles’ of selected key-hashtags: the URLS and hashtags that these key hashtags are associated with on Twitter in specific periods of time. Documenting changes in the associational profiles of key-words between different intervals, it becomes possible to analyse issue variability, or liveliness.
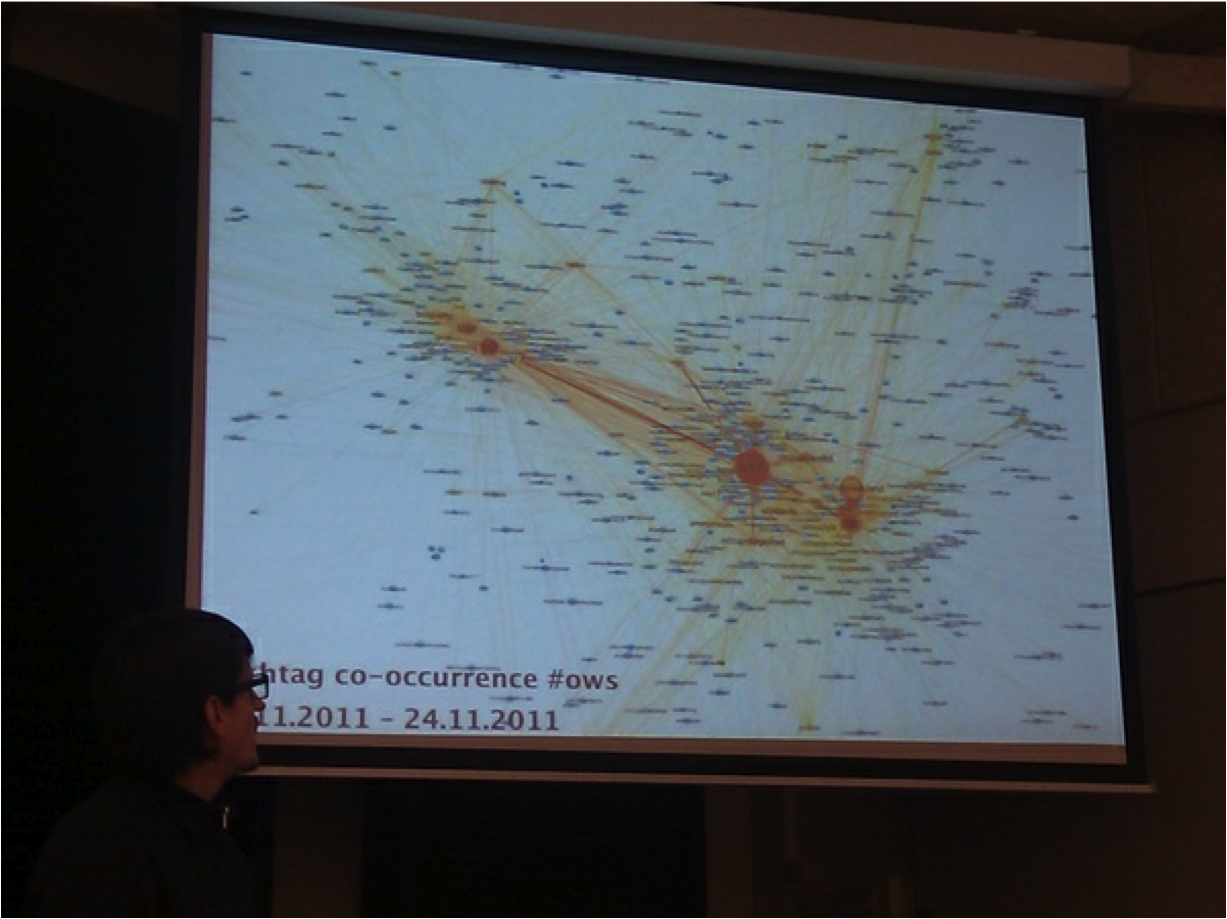 Img. Co-word map for #ows tweets.
Aims
1) Develop key-word lifelines. The main objective of the project is then to develop further a specific aspect of co-word analysis: so called key-word lifelines that capture the intensity with which selected key-words change their relations to other key-words and actors (changes in associational profile). 2) Explore visualisation. The second project objective is to explore the possibilities to visualise such keyword lifelines and to explore the analytical capacities and potential of such approach. To do so, the project using on an existing set of Twitter data and deploys a specific feature of Twitter co-word analytics tool which detects the associational profiles of key-words: the number of key word connections each word holds and how these connections change over time, how new word-connections move in and old ones disappear.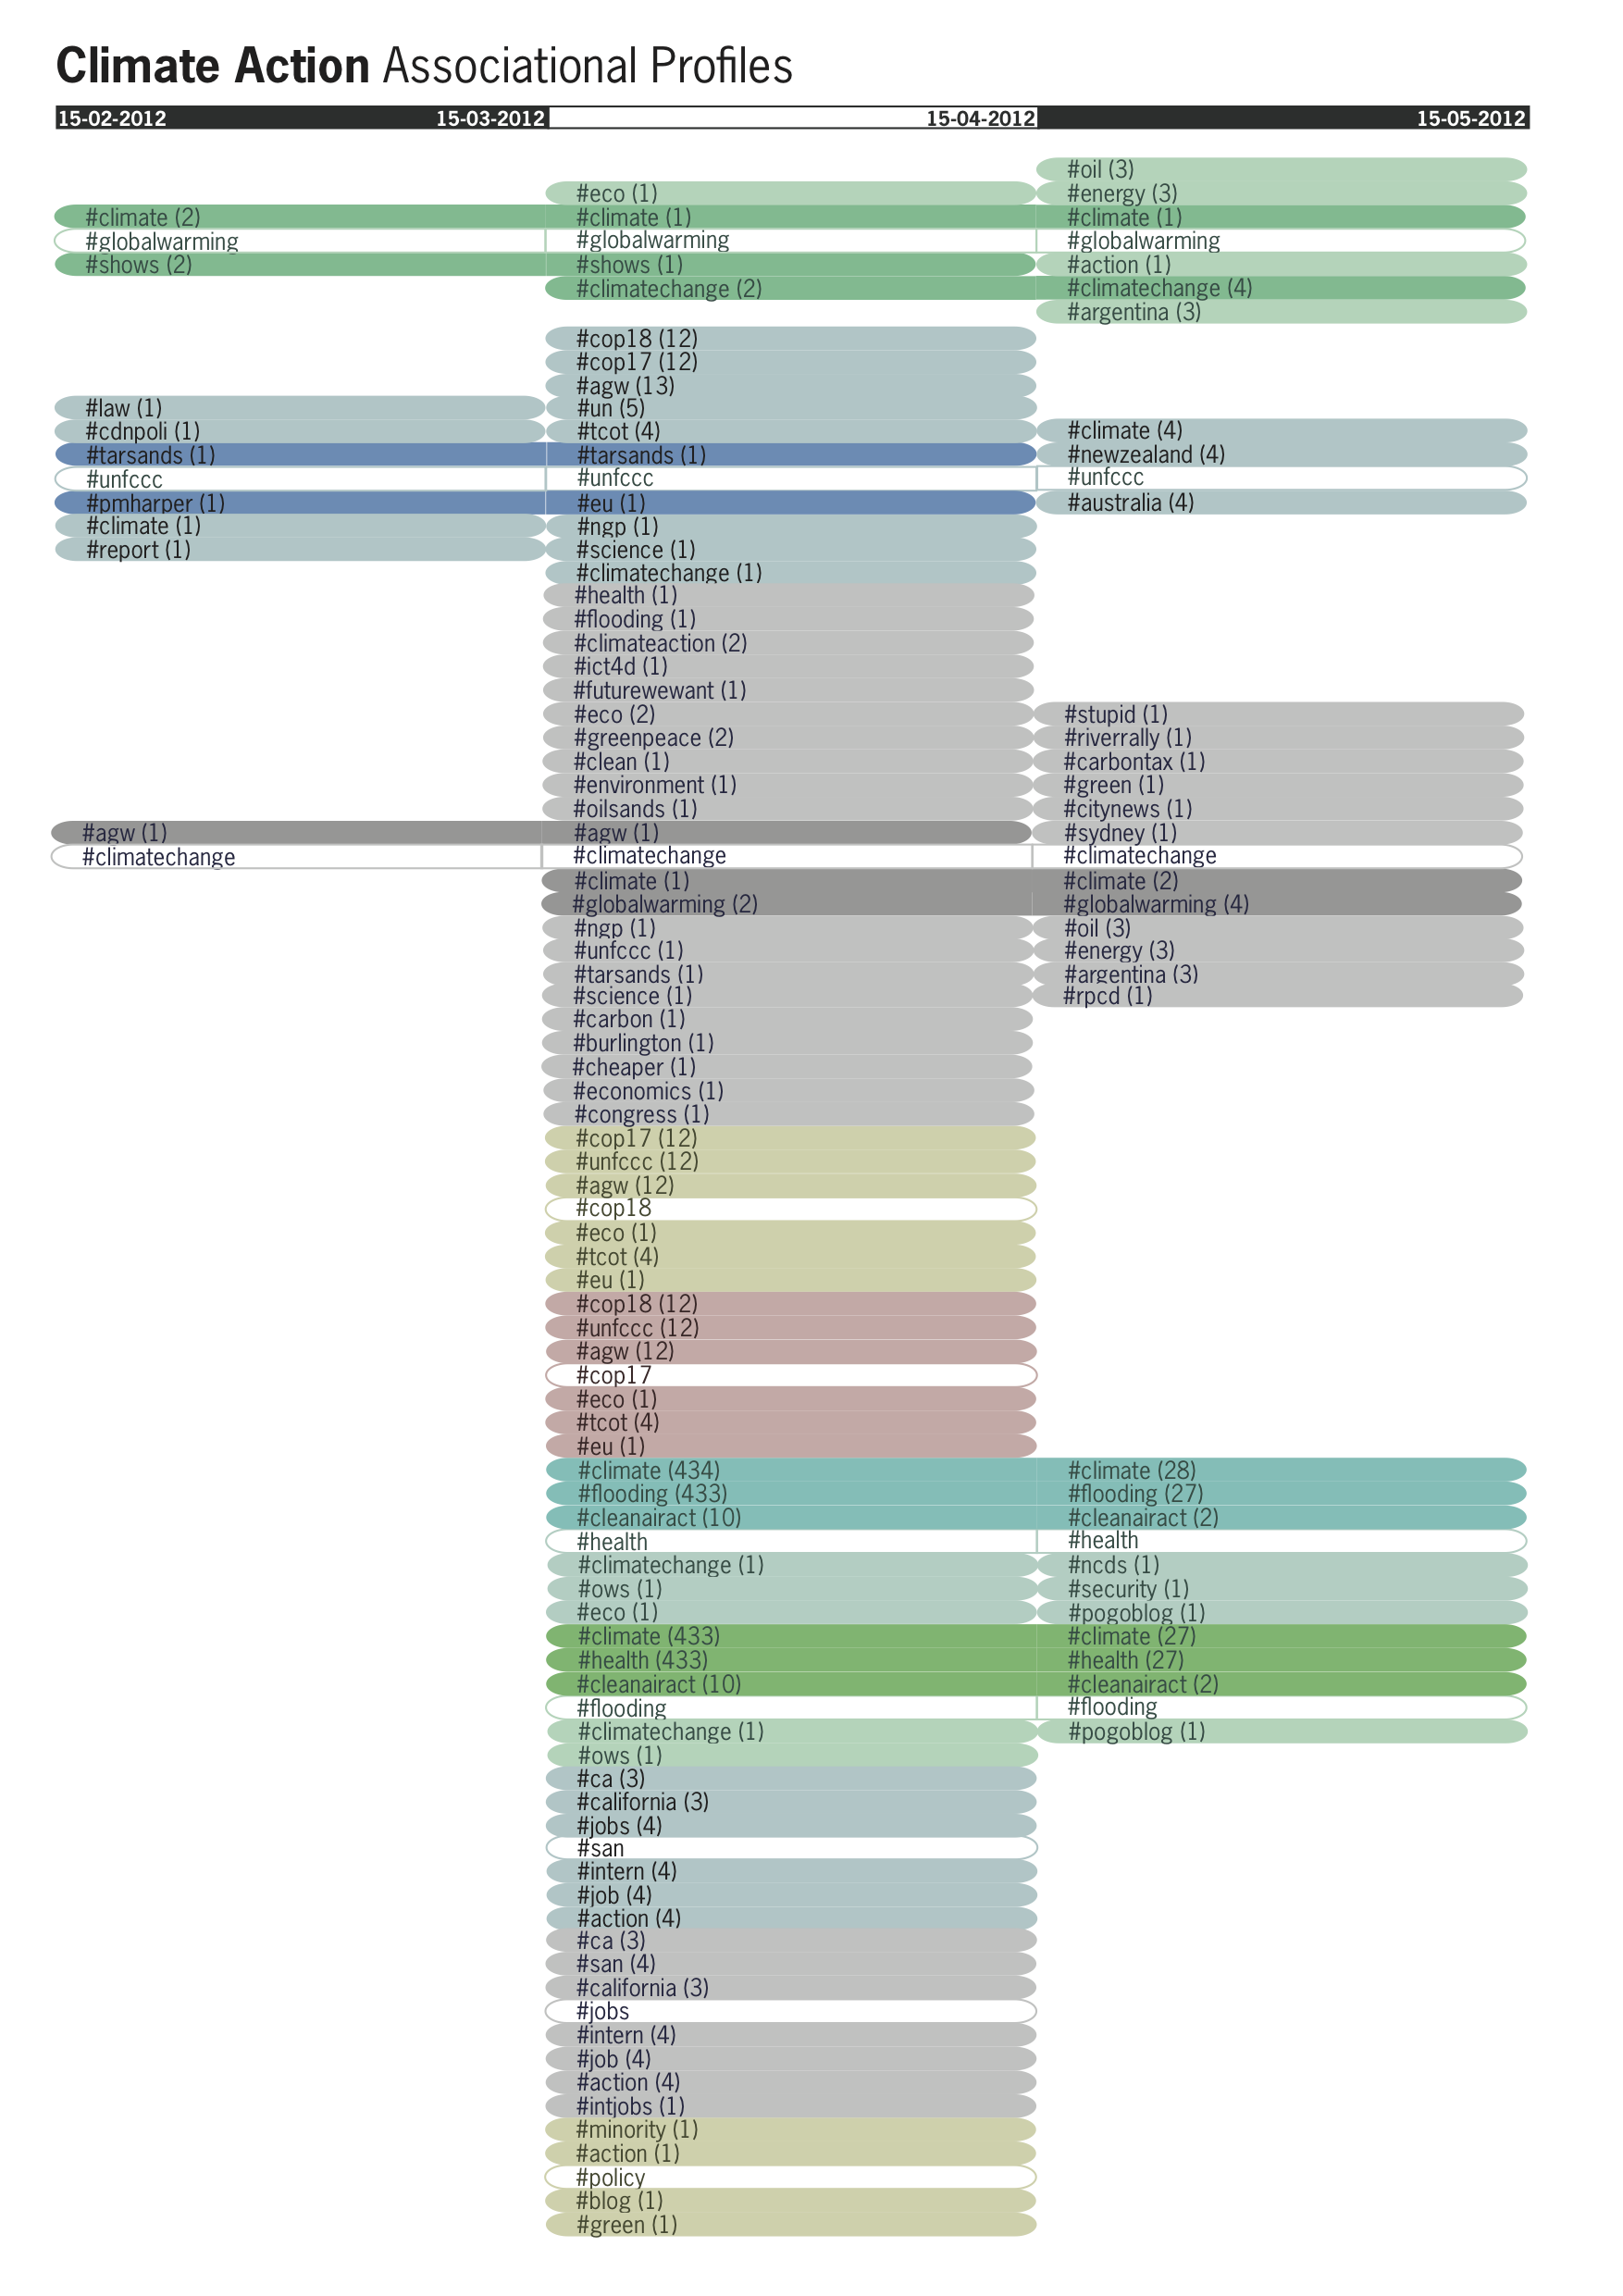
Research Questions
Can we study the liveliness of an issue with co-word analysis? Do hashtags provide a useful heuristic for studying issue dynamics with Twitter? Does the ‘behaviour’ of hashtags over time provide a useful indicator of wider issue dynamics? As mentioned, we are especially interested in the differences between two types of measures for detecting the behaviour of hashtags over time: frequency and co-word. This also extends to their visual affordances: does co-word analysis offer opportunities for visualising the liveliness of issues in a different way?Dataset
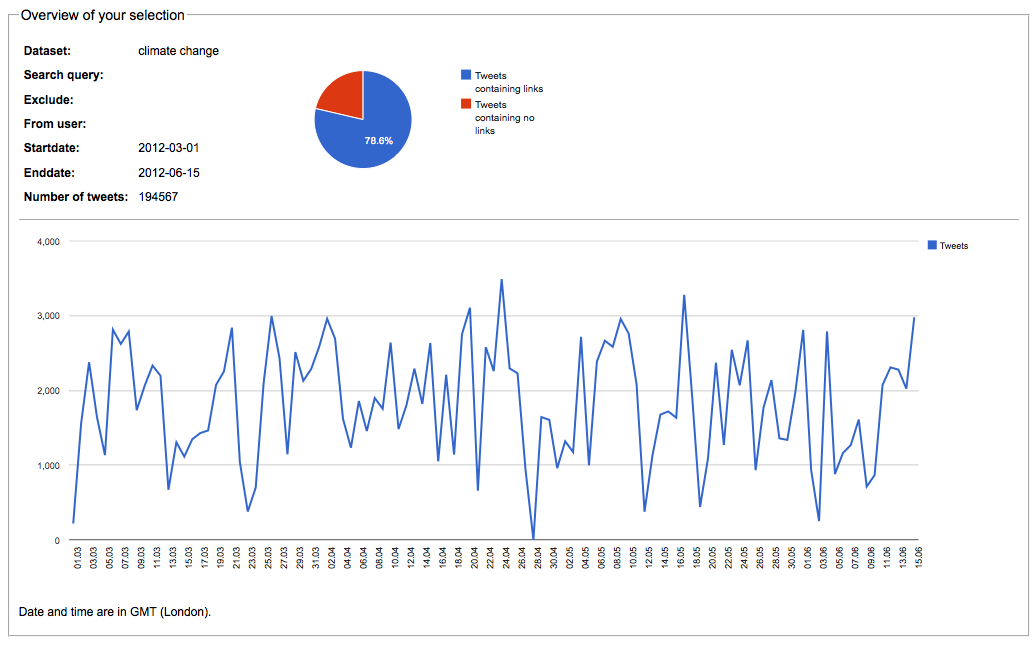
We work with a substantive Twitter dataset: all tweets mentioning ‘climate change’, in the period of March 1st 2012 to June 15, 2012, a total of 204795 tweets. For our analysis, we divide our data into six 2 weeks intervals, though we occasionally rely on other kinds of timelines. We focus our analysis on a selected set of hashtags. Our dataset does not exclude re-tweets.
Methodology
The project combines a variety of measures to determine the liveliness of the climate change issue space on Twitter, with a special focus on profiling key hashtags and users. We used co-word analysis as well as frequency measures to detect the activity of hashtags over time, and relied on different, additional profiling methods to detect user profiles, which we detail below. Finally, we experimented with the visualisation of 'associational profiles' of key hashtags: different ways to display hashtag associations and their changes over time. Our principal steps were as follows: 1. Detect key hashtagsBy frequency and co-word measures (for Co-word: Open results file in Gephi and select key hashtags for instance based on average weighted degree to select the most connected hashtags for further analysis). 2. Determine the URL profile for key hastags
This to explore their actor profiles. To this purpose, extract all URLs with the Harvester & tiny URL expander tool. Decide on URL categorization (color by suffix?) and cloud the results using Wordle. 3. Determine associational co-word profile for each key hashtag for each interval. 4. Map Users: Determine top users and their behaviour profiles (number of mentions, actor type) 5. Explore possibilities of visualisation of rates of change and the variation of associated key words. 6. Analysis.
What are key life signals and how can we detect if one key-word is more lively than others? What are stable, what are lively keywords? Does the study of lifelines of keywords allow to qualify and specify peaks in Twitter activity?How lively is the issue in this space in general?
Findings
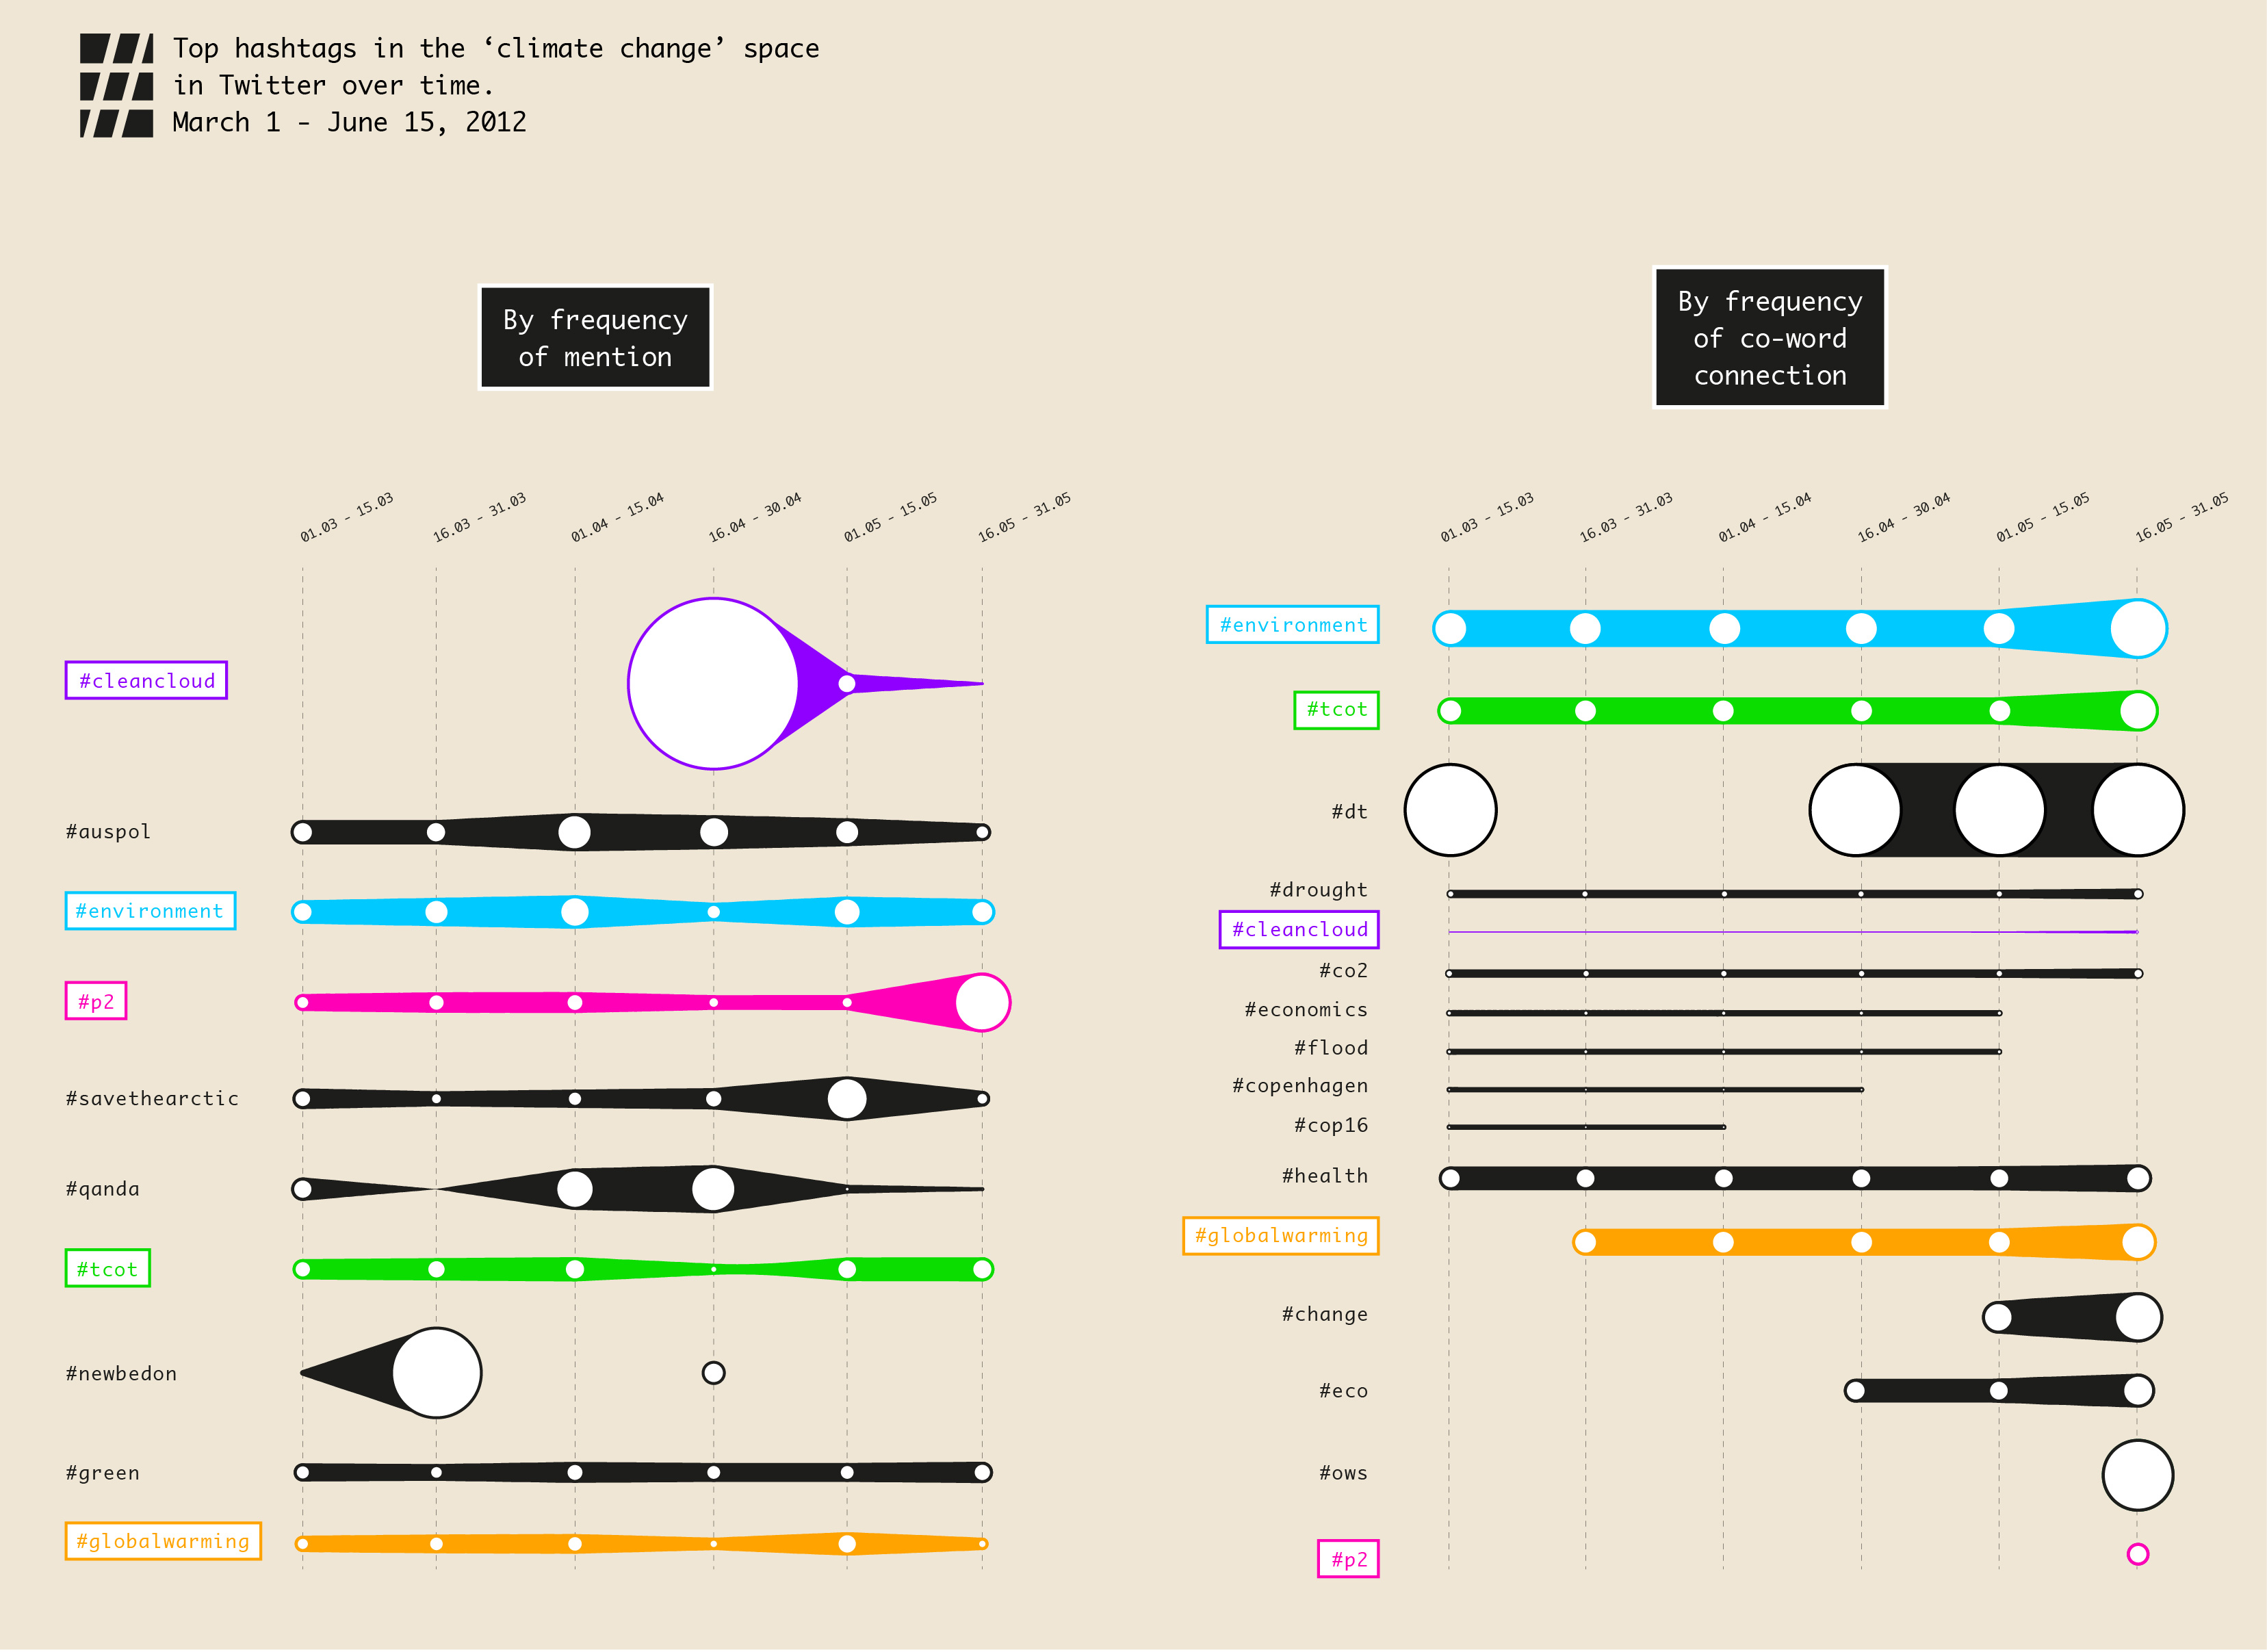
A summary of our initial findings during the summer school project can be found in this presentation. 1. Identification of key hashtags and their behaviour over time Method We wish to compare two different measures for the selection and analysis of 'top' hashtags in the climate change space on Twitter a. Frequency: Which hashtags are mentioned most often in our data set for each interval? How does the set of top hashtags change over time?b. Co-word Analysis: Which hashtags have the most connections to other hashtags in our data set for each Interval (by average weighted degree) ? How does the set of top hashtags change over time? I.e can we detect variation in co-word frequency? For both measures, we excluded the hashtag 'climate change' and 'climate', as these don’t add anything meaningful when it comes to specifying the composition of the climate change issue space on Twitter. The following visualisation shows the top hashtags on the basis of word frequency analysis (left) versus the top hashtags based on co-word relations (right), that is how often hashtags appear in relation with other hashtags.
 Img Top hashtags in the Climate Change space on Twitter over time (March-Jun 2012)].
Initial Findings
The figure provides an overview of the overall composition of the climate change space on Twitter, and it reveals that we gain a different impression depending on which measure we use.
To begin with the first point, hashtag analysis gives an impression of the overall profile of climate change on Twitter: It consists of as hashtags referring to specific institutional formations and events, like #cop16 or #auspol, hashtags referring to campaigns such as #savethearctic, politics as in the relation to #ows as well as a range of sub-issues of climate change, like #flood, #health and #drought.
Speaking generally, the intial figure provides empirical support for the claim that frequency measures are biased towards detecting popularity (hypes and bursts), while co-word analysis brings into view the variability of issues (more extended fluctuations over time).
First, frequency and co-word measures brings into focus different ‘top’ hashtags in our data-set. Co-word presents a more variable set in the sense that more hashtags emerge as active over the course of time. Co-word hashtags appear to be more substantive (economics, flood, co2, health) and hashtags are slightly more ‘twitter specific’ in case of frequency (qanda [question&answer], newbedon), though co-word does brings up dt (donated tweet). (Regarding newbedon, its appearance seems to indicate a twitter specific phenomenon: the term refers to oppositional figures in the united arab emirates who had been stripped of their nationality, and this hashtag was used to raise awareness. The hashtag must have been kidnapped, perhaps by spammers.)
Most importantly, frequency measurements bring out a more ‘bursty’ issue profile, with cleancloud and newbedon booming and than disappearing as notable events, while co-word brings ug hashtags that are present across several intervals (environment, tcot (topconservatives), dt, drought). #p2 is an interesting hashtag, as it s present consistently with high frequency, but is only little connected to other hashtags, whereas #environment is both active and widely connected.
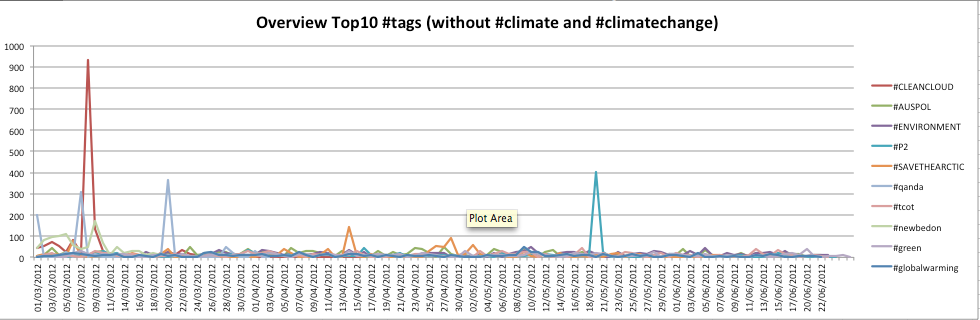
This ‘burstiness’ of top hashtags by frequency is underlined by an overview of tophashtags by day, which reveals a separation of hashtags that reach maximum intensity for a day only to disappear as opposed to these that have a more meandering existence (cumulatively great). The figure also highlights that we may assign temporal profiles to individual hashtags (those that live for a day, a month, …)
Img Top hashtags in the Climate Change space on Twitter over time (March-Jun 2012)].
Initial Findings
The figure provides an overview of the overall composition of the climate change space on Twitter, and it reveals that we gain a different impression depending on which measure we use.
To begin with the first point, hashtag analysis gives an impression of the overall profile of climate change on Twitter: It consists of as hashtags referring to specific institutional formations and events, like #cop16 or #auspol, hashtags referring to campaigns such as #savethearctic, politics as in the relation to #ows as well as a range of sub-issues of climate change, like #flood, #health and #drought.
Speaking generally, the intial figure provides empirical support for the claim that frequency measures are biased towards detecting popularity (hypes and bursts), while co-word analysis brings into view the variability of issues (more extended fluctuations over time).
First, frequency and co-word measures brings into focus different ‘top’ hashtags in our data-set. Co-word presents a more variable set in the sense that more hashtags emerge as active over the course of time. Co-word hashtags appear to be more substantive (economics, flood, co2, health) and hashtags are slightly more ‘twitter specific’ in case of frequency (qanda [question&answer], newbedon), though co-word does brings up dt (donated tweet). (Regarding newbedon, its appearance seems to indicate a twitter specific phenomenon: the term refers to oppositional figures in the united arab emirates who had been stripped of their nationality, and this hashtag was used to raise awareness. The hashtag must have been kidnapped, perhaps by spammers.)
Most importantly, frequency measurements bring out a more ‘bursty’ issue profile, with cleancloud and newbedon booming and than disappearing as notable events, while co-word brings ug hashtags that are present across several intervals (environment, tcot (topconservatives), dt, drought). #p2 is an interesting hashtag, as it s present consistently with high frequency, but is only little connected to other hashtags, whereas #environment is both active and widely connected.
This ‘burstiness’ of top hashtags by frequency is underlined by an overview of tophashtags by day, which reveals a separation of hashtags that reach maximum intensity for a day only to disappear as opposed to these that have a more meandering existence (cumulatively great). The figure also highlights that we may assign temporal profiles to individual hashtags (those that live for a day, a month, …)
 3. Actor profiling of hashtags over time
Plotting the frequency and co-word connections of hashtags over time gives a sense of the relative activity of climate change on twitter, but hashtags may also be analysed to detect liveliness in another sense: are hashtags associated with particular actors (news, organisations, social media), and how do these associations change over time? A diverse actor profile might be an indication of liveliness, and so may changes in actor profile over time.
Secondly, actor profiling of hashtags may also be used to analysis bias in the climate change space on Twitter. We found a number of polarizing hashtags in our top hashtag set: #ows, #tcot, #p2 . Are these hashtags associated with specific actors? And actor profiling may provide an indication of the bias of individual hashtags: are some hashtags associated with particular actors? What is the actor profile of different hashtags? Are there newsy hashtags vs scientific hashtags? Also, do these actor profiles of hashtag change over time? If a hashtag moves from being primarily associated with social media to one identified with organisations, this may indicate quite literal movement of this issue space. Actor profiling is then a way of drilling deeper into the composition of this space, and its variability.
Method
1. Identify key-hashtags for actor-profiling: we focus on polarizing hashtags - tcot and ows- as they might produce interpretable results.
2. For each hashtag, identify associated URLS per interval
3. Manually categorize associated URLS
3. Actor profiling of hashtags over time
Plotting the frequency and co-word connections of hashtags over time gives a sense of the relative activity of climate change on twitter, but hashtags may also be analysed to detect liveliness in another sense: are hashtags associated with particular actors (news, organisations, social media), and how do these associations change over time? A diverse actor profile might be an indication of liveliness, and so may changes in actor profile over time.
Secondly, actor profiling of hashtags may also be used to analysis bias in the climate change space on Twitter. We found a number of polarizing hashtags in our top hashtag set: #ows, #tcot, #p2 . Are these hashtags associated with specific actors? And actor profiling may provide an indication of the bias of individual hashtags: are some hashtags associated with particular actors? What is the actor profile of different hashtags? Are there newsy hashtags vs scientific hashtags? Also, do these actor profiles of hashtag change over time? If a hashtag moves from being primarily associated with social media to one identified with organisations, this may indicate quite literal movement of this issue space. Actor profiling is then a way of drilling deeper into the composition of this space, and its variability.
Method
1. Identify key-hashtags for actor-profiling: we focus on polarizing hashtags - tcot and ows- as they might produce interpretable results.
2. For each hashtag, identify associated URLS per interval
3. Manually categorize associated URLS


 Initial findings
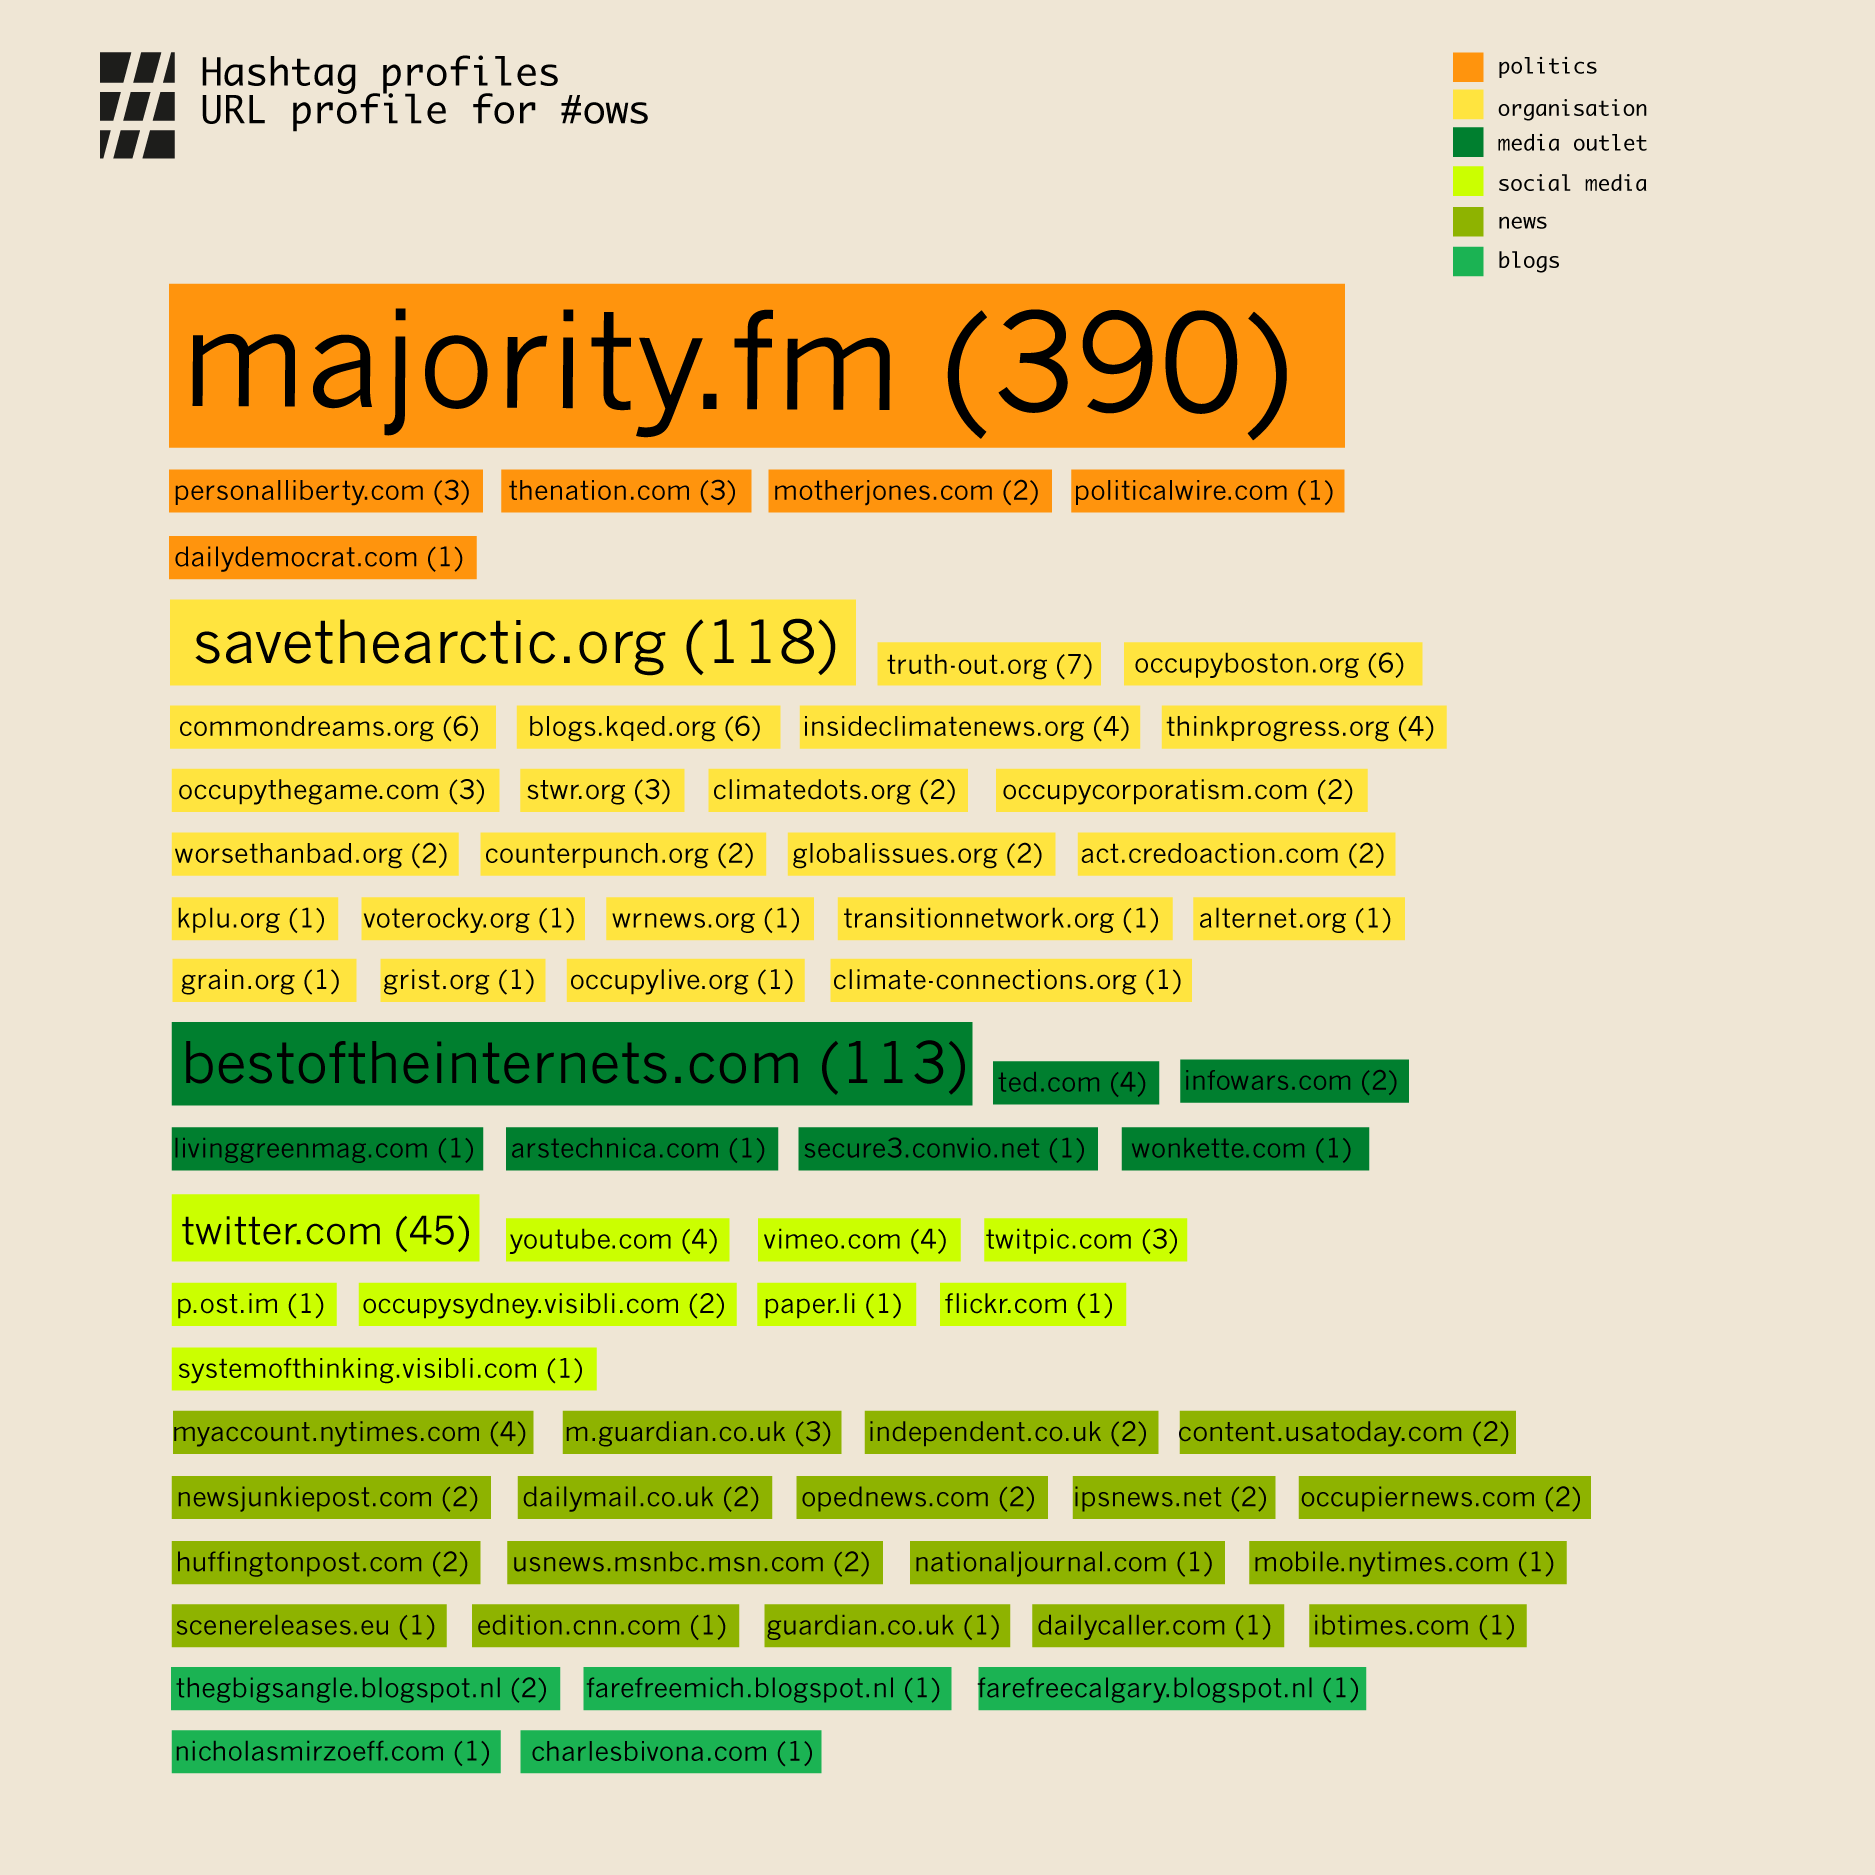
#ows
Initial findings
#owsThe space is defined by political and organisational websites and a series of social media and news outlets. Especially majority.fm and savetheartic.org, a political whistleblowing site and a campaign site feature most prominently.
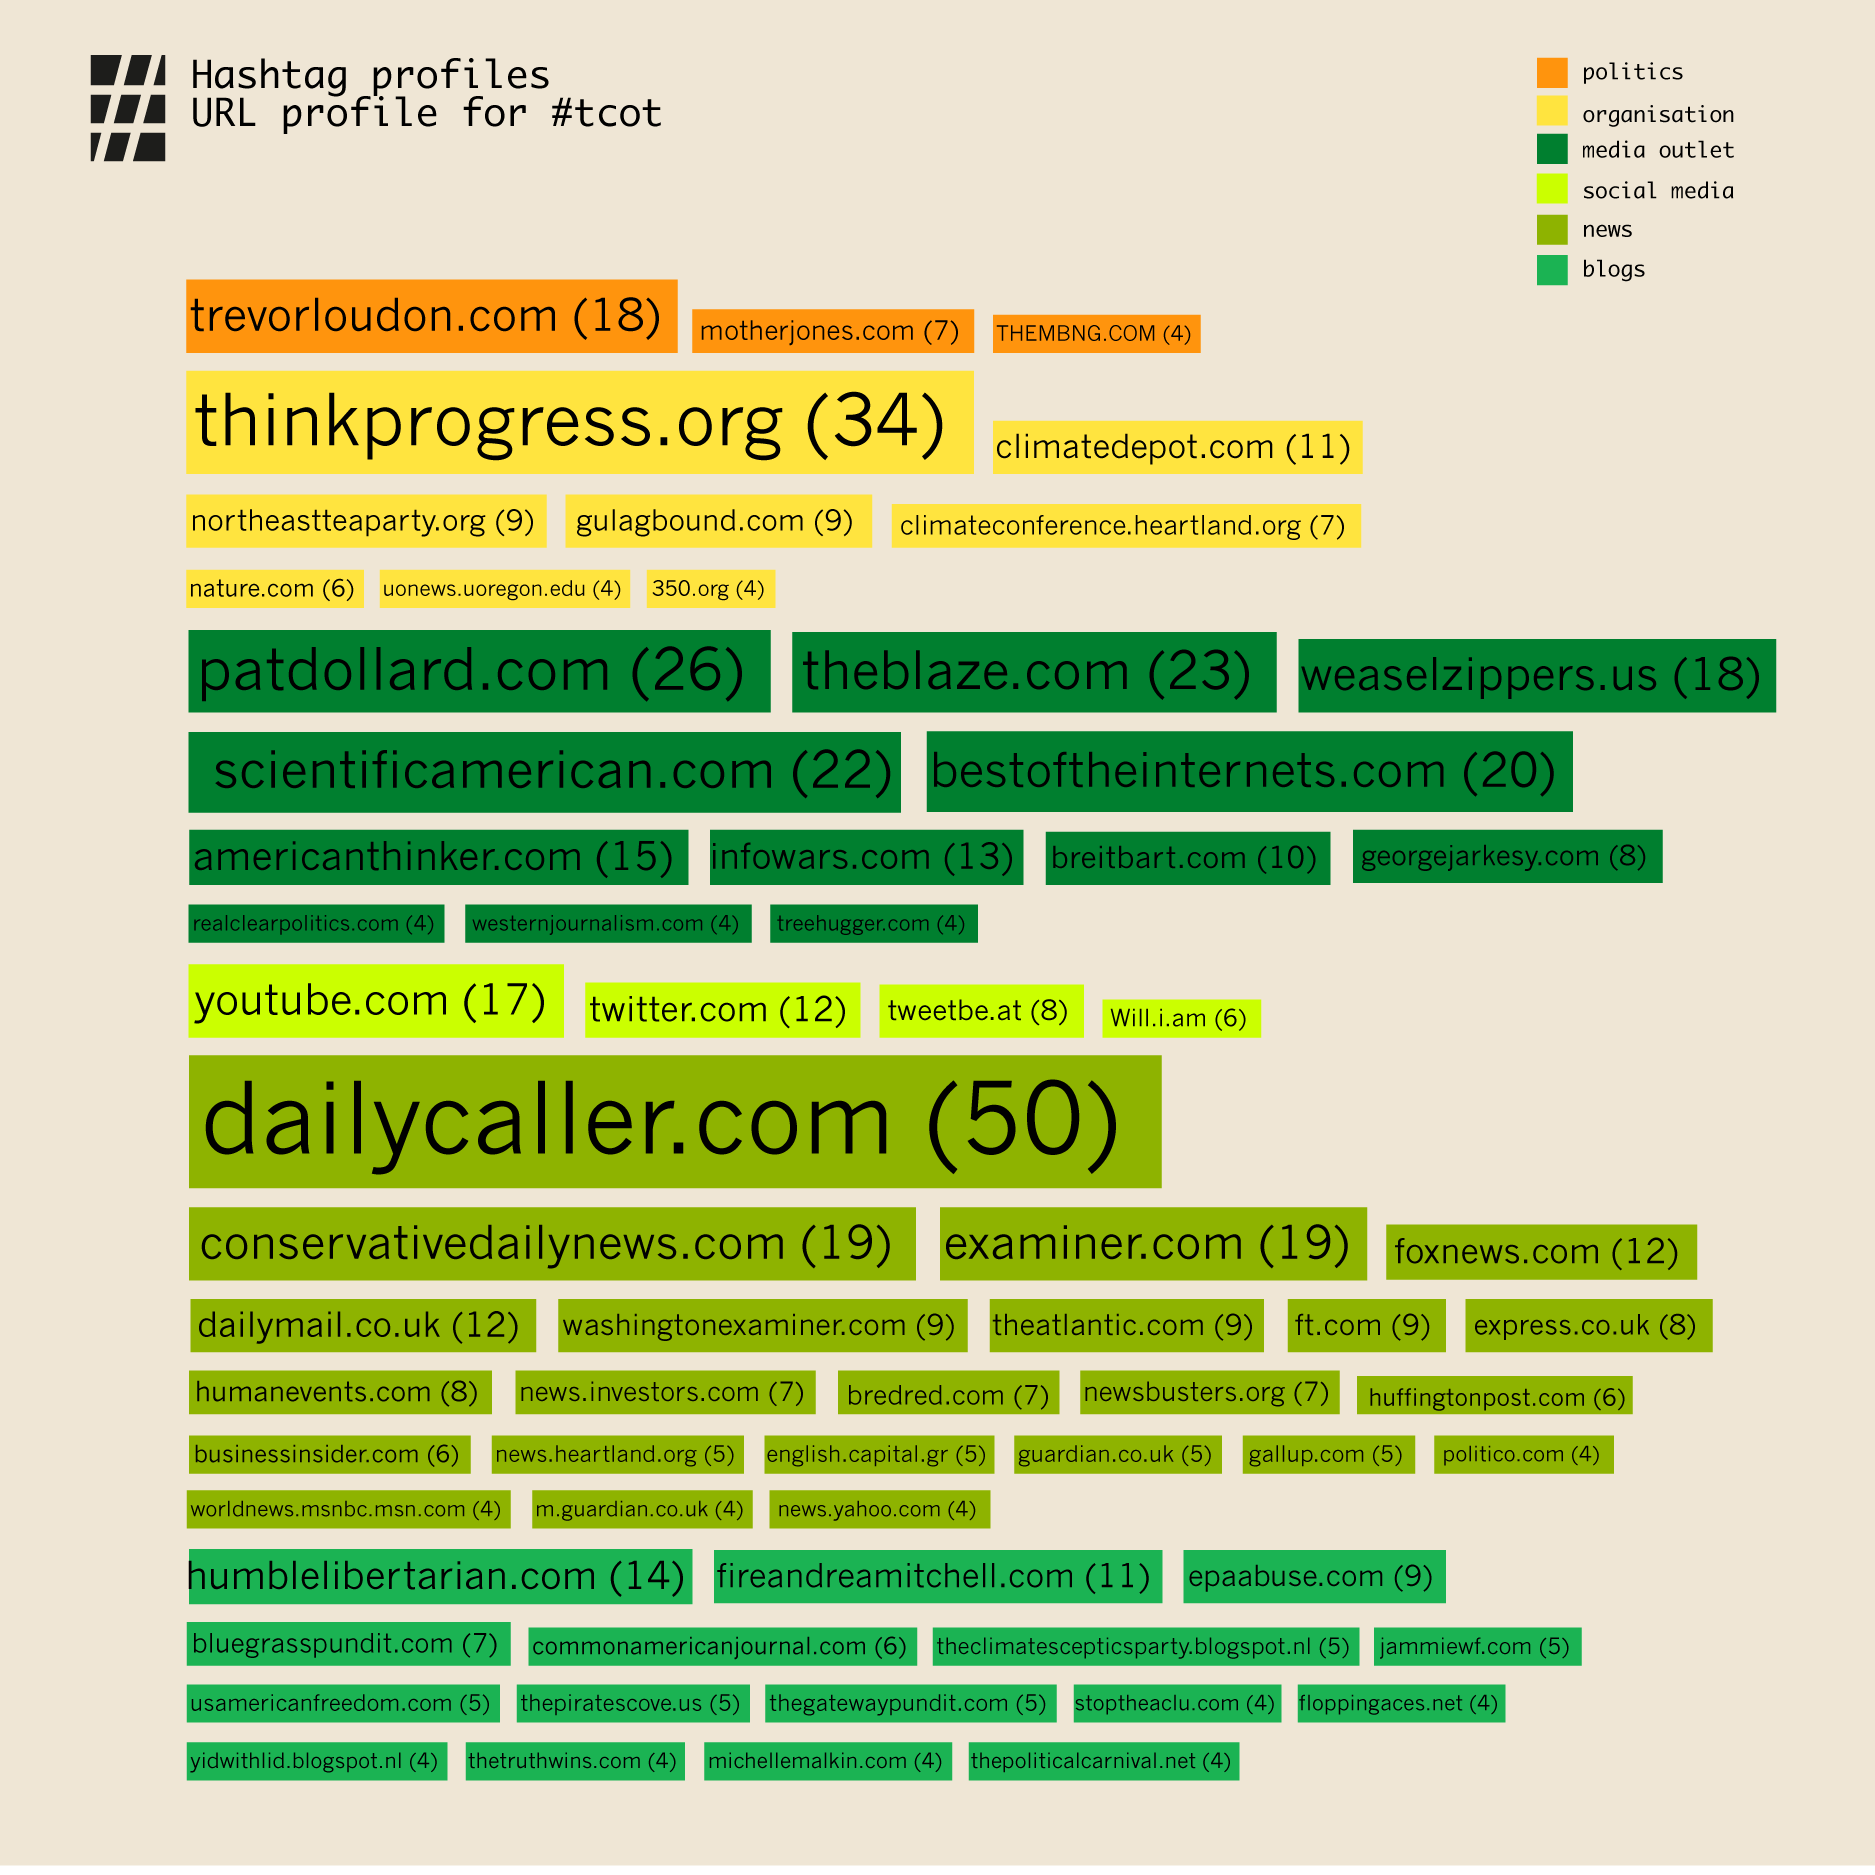
#tcot
main focus on news & general media outlets.
increasingly more blogs and the progressive organisation thingprogress.org
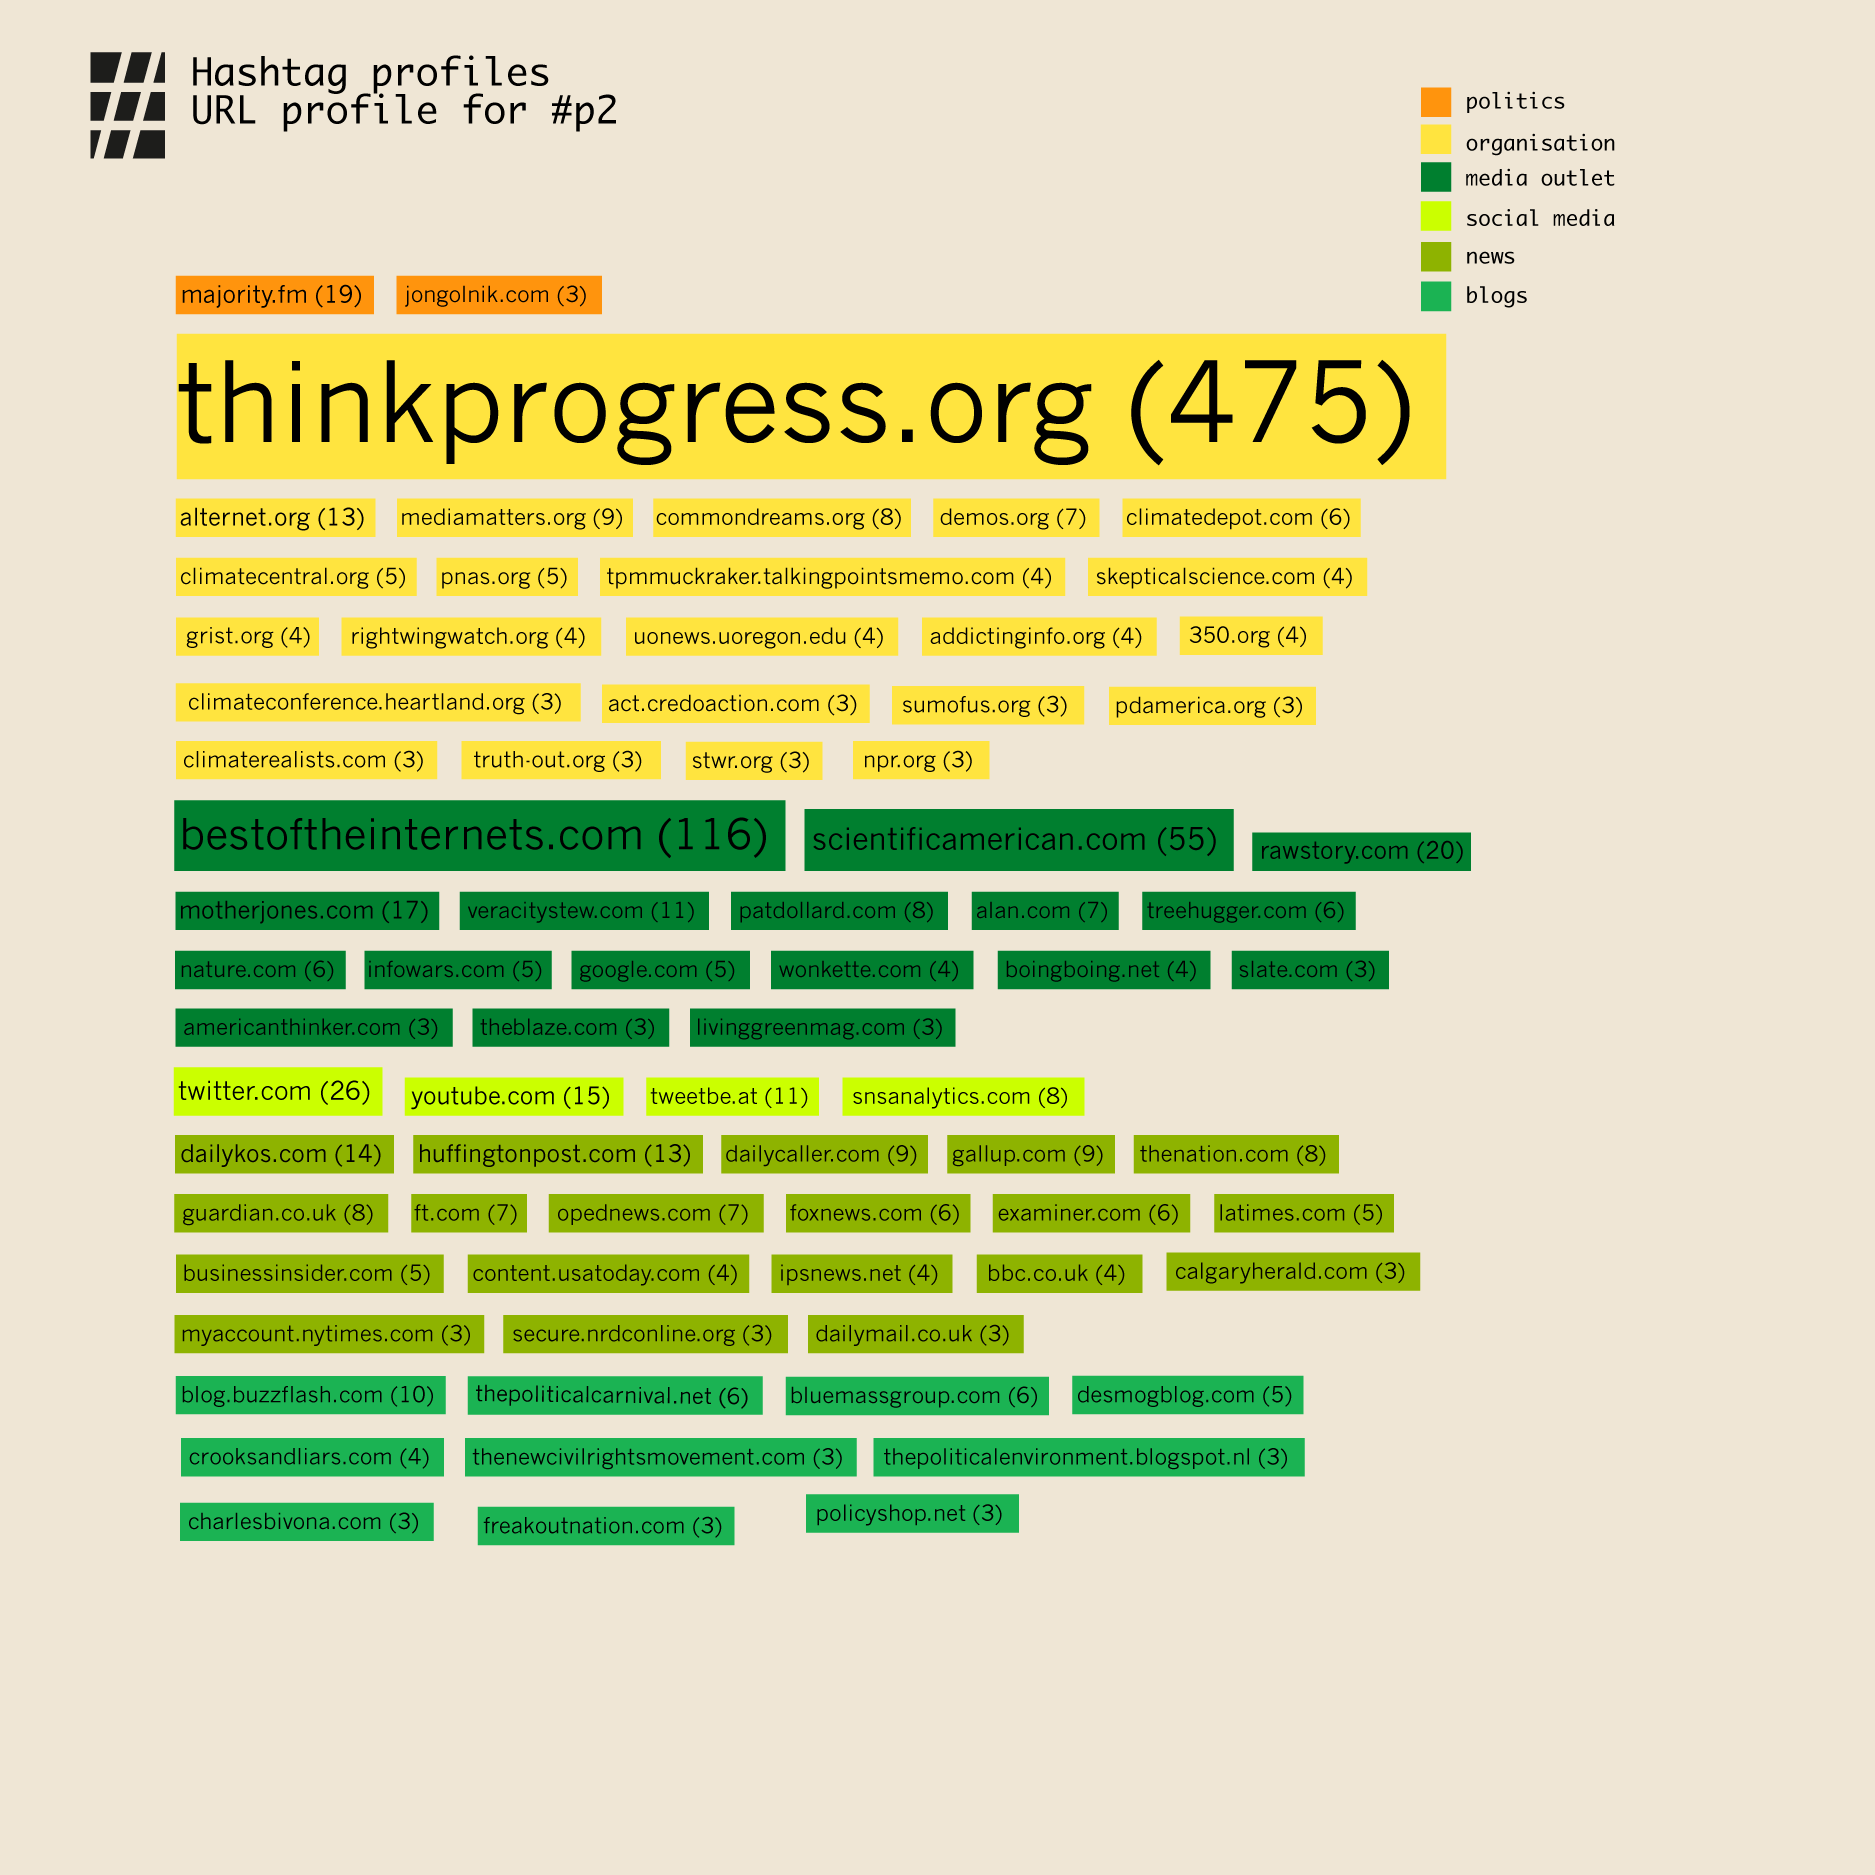
#p2
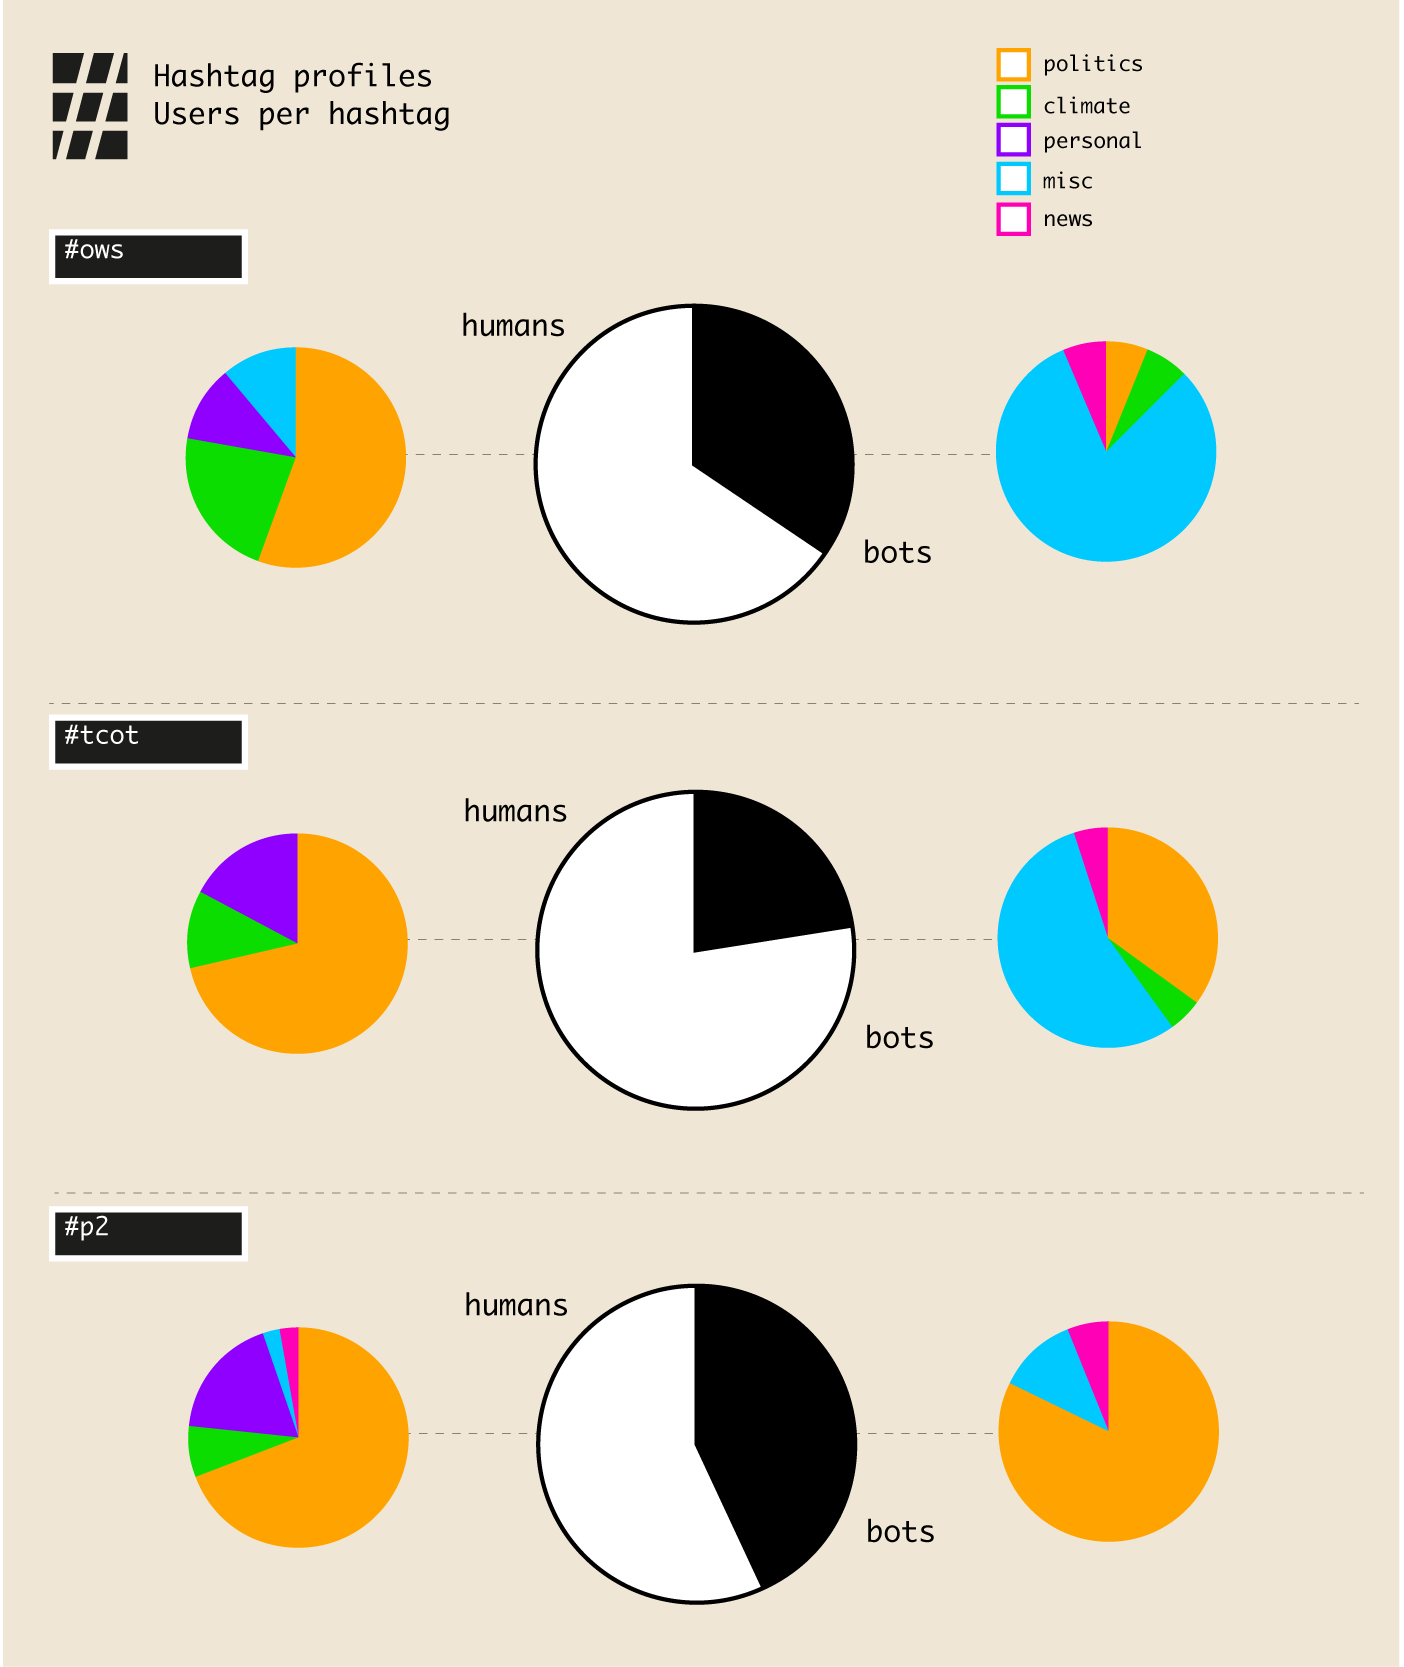
The space for #p2 however, is mainly dominated by organisations, rather than political sites, with thinkprogress.org as most mentioned reference, but is also increasingly heavy on the news and media site. There seem to be especially significant differences between Ows and tcot actor profiles: Tcot seems primarily newsy, ows campaigny; tcot also appears to be more diversified in terms of the sources referenced than ows. Variation in time seems a less significant factor here. 4. User profiles Hashtag profiling can be further specified by looking at the type of users contributing to the use of the hashtag, that is, its distributed production. The pie charts below show the relative proportion of human versus non-human users per hashtag: the percentages of bots and humans creating tweets with the related hashtag. The coloured pie-charts provide a categorisation of the type of user or bot active in relation to the hashtag.
In the case of #ows, around a third of all tweets were produced by bots, which mainly just feature generic bots posting content found of media aggregation sites such as bestoftheinternet.com, while the human or organisational users situate themselves predominantly in the realm of politics or environment.
#tcot features less bots. However, among the bots associated with this hashtag there is a series of profiles which only tweet about politics, besides a large proportion of generic media bots. Among the human users, the majority is focused on politics.
#p2 poses a particularly interesting case as almost half of all tweets originate from bots, which themselves mainly focus on politics. Among the human users is a mixture between political and personal twitters.
More generally speaking, we can conclude that the three hashtags under consideration are mainly used by human/organisational users which are particularly dedicated to politics, allowing politics to to take on a notable role in the twitter issues space of climate change. However, the prominence of rather generic bots in the spaces of #ows and #tcot re-introduce the liveliness of the medium itself, as bots use the relative currency of hashtags to create their own audiences.
 5. Visualising Associational profiles
The association profile is a measure under development which can be used to detect shifts in word connections over time. With which hashtags are our co-hashtags connected in each interval? How do these associations change from interval to interval? The analysis of associational profiles may provide a way to detect the variable composition of issues over time.
Method
1. Select top hashtags for profiling (by av weighted co-word degree)
2. Create associational profiles for each top hashtag using co-hashtag analysis
3. Visualise as streamgraph
5. Visualising Associational profiles
The association profile is a measure under development which can be used to detect shifts in word connections over time. With which hashtags are our co-hashtags connected in each interval? How do these associations change from interval to interval? The analysis of associational profiles may provide a way to detect the variable composition of issues over time.
Method
1. Select top hashtags for profiling (by av weighted co-word degree)
2. Create associational profiles for each top hashtag using co-hashtag analysis
3. Visualise as streamgraph
 Initial findings
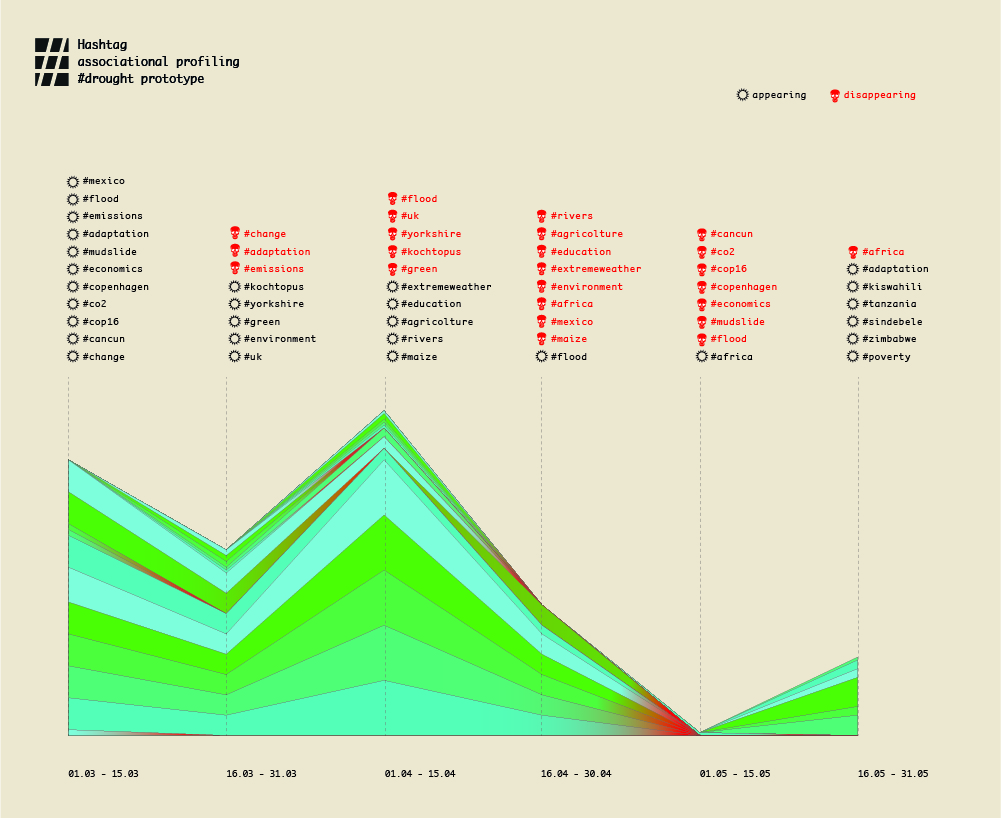
The associational profile of the hashtag 'drought' is suggestive of a number of issue events in the drought space, such as the rise to prominence of the yorkshire flouds in this issue space, and the rise and fall of UN-summit related vocabulary. Perhaps at its most dramatic, we can observe a moment of near-total issue re-composition, as summit-related language makes place for Africa-specific terms in the last interval. While these can be no more than impressionistic observations, the drought prototype figure suggest it may be possible to detect the liveliness of issues through associational profiling.
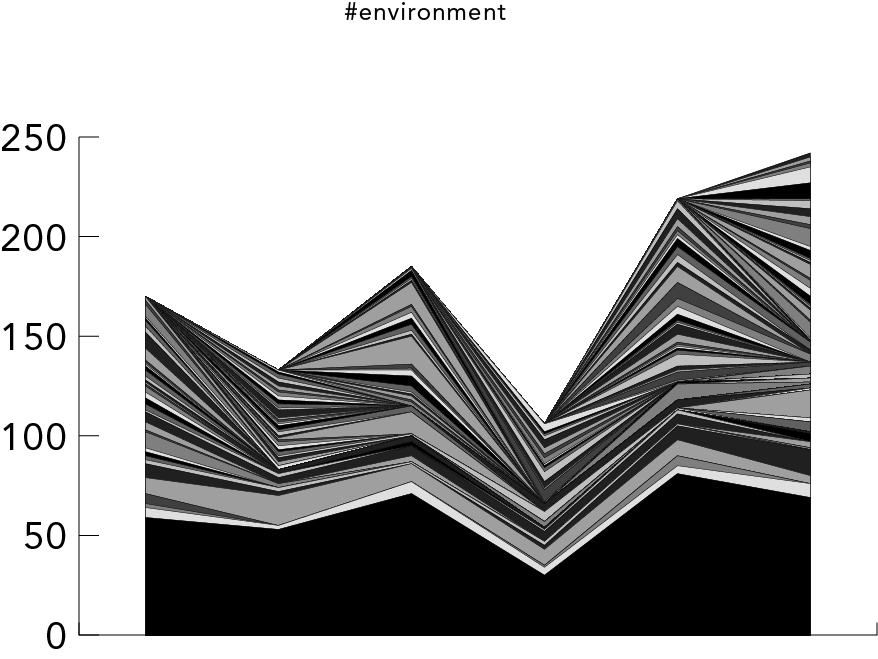
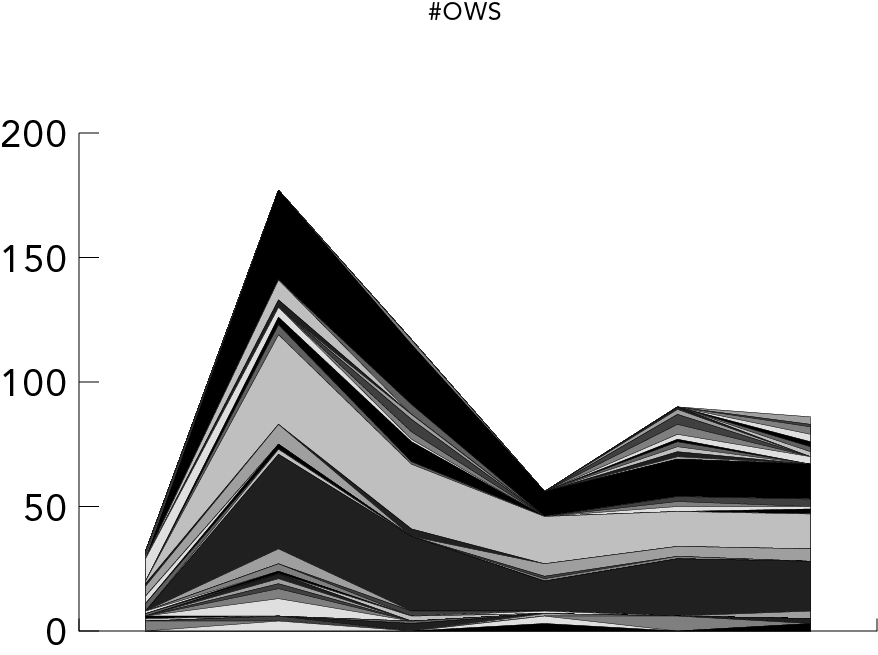
This impression finds further support in a comparative exercise, where we compare the associational profiles of different hashtags with one another. #Environment has a far more diversely composed profile than drought, which many more forking and re-branching. A hashtag like #ows looks relatively more stable than for instance #drought. We arrive at a tentative three-fold: Some hashtags are relatively stable. Some hashtags are bursty. But some hashtags are changeable. The latter would appear of special interest when it comes to detecting liveliness. However, we may also have to consider that some hashtags are more heterogeneously composed than others. We therefore speculate that changeable, heterogeneous composed hashtags denote especially lively areas.
Initial findings
The associational profile of the hashtag 'drought' is suggestive of a number of issue events in the drought space, such as the rise to prominence of the yorkshire flouds in this issue space, and the rise and fall of UN-summit related vocabulary. Perhaps at its most dramatic, we can observe a moment of near-total issue re-composition, as summit-related language makes place for Africa-specific terms in the last interval. While these can be no more than impressionistic observations, the drought prototype figure suggest it may be possible to detect the liveliness of issues through associational profiling.
This impression finds further support in a comparative exercise, where we compare the associational profiles of different hashtags with one another. #Environment has a far more diversely composed profile than drought, which many more forking and re-branching. A hashtag like #ows looks relatively more stable than for instance #drought. We arrive at a tentative three-fold: Some hashtags are relatively stable. Some hashtags are bursty. But some hashtags are changeable. The latter would appear of special interest when it comes to detecting liveliness. However, we may also have to consider that some hashtags are more heterogeneously composed than others. We therefore speculate that changeable, heterogeneous composed hashtags denote especially lively areas.


Conclusion
tbcReadings & Materials
Marres and Weltevrede,Post-social methods: Issues in Live Social Research Post-social methods? Issues in Live Social Research Introductory presentation by Noortje Marres and Carolin Gerlitz A Co-Word Machine? Presentation of Co-Word Lifelines pilot project, by Noortje Marres, Esther Weltevrede, David Moats & Carolin Gerlitz, The Co-word Machine Workshop, Goldsmiths, University of London, May 2012. Borra, Erik and Ingmar Weber (2012) Political Insights: Exploring partisanship in web search queries, submitted Callon, M. et al. "From Translations to Problematic Networks: An Introduction to Co- word Analysis." Social Science Information 22.2 (1983): 191. Danowski, J.A. (2009) "Inferences from Word Networks in Messages." The content analysis reader: 421 - 429. Marres, N. and E. Weltevrede (2012) Scraping the Social? Issues in Real-Time Research, Working Paper prepared for The Device (J. Law and E. Ruppert (Eds), Special Issue of the Journal of Cultural Economy. Rieder, Bernard. forthcoming. The Refraction Chamber: Studying Twitter’s Brand of Publicness.

| I | Attachment | Action | Size | Date | Who | Comment |
|---|---|---|---|---|---|---|
| |
DROUGHT_FINAL_copy.jpg | manage | 1 MB | 23 Jul 2012 - 08:50 | NoortjeMarres | |
| |
Hashtag_Users_Profiles.png | manage | 84 K | 31 Jul 2012 - 14:58 | NoortjeMarres | |
| |
Marres_Weltevrede_dmiSummer2012.pdf | manage | 5 MB | 27 Jun 2012 - 12:52 | NoortjeMarres | |
| |
climate_change_twitter_analytics_data.png | manage | 78 K | 10 Jul 2012 - 14:50 | NoortjeMarres | |
| |
environment_copy.jpg | manage | 862 K | 10 Jul 2012 - 15:19 | NoortjeMarres | |
| |
overview_top_10_hashtags.png | manage | 57 K | 10 Jul 2012 - 15:32 | NoortjeMarres | |
| |
ows_URL_profile_copy.png | manage | 194 K | 31 Jul 2012 - 14:42 | NoortjeMarres | |
| |
ows_copy.jpg | manage | 799 K | 10 Jul 2012 - 15:20 | NoortjeMarres | |
| |
p2_URL_profile_copy.png | manage | 182 K | 31 Jul 2012 - 14:42 | NoortjeMarres | |
| |
tcot_URL_profile_min4_copy.png | manage | 220 K | 31 Jul 2012 - 14:42 | NoortjeMarres | |
| |
tube_topfrequency_copy.jpg | manage | 548 K | 23 Jul 2012 - 08:48 | NoortjeMarres | |
| |
tube_topfrequency_no_lines_copy.jpg | manage | 661 K | 23 Jul 2012 - 10:07 | NoortjeMarres |
Edit | Attach | Print version | History: r15 < r14 < r13 < r12 | Backlinks | View wiki text | Edit wiki text | More topic actions
Topic revision: r15 - 31 Jul 2012, NoortjeMarres
Ideas, requests, problems regarding Foswiki? Send feedback