Amazon’s Choice
An inquiry into Amazon’s Algorithms
Team Members
Alicja Zak, Elise Olthof, Dimitri Koehorst, Ola Bonati, Zdzich Heydel, Aymann KhatibContents
Team Members Contents Summary of Key Findings 1. Introduction 2. Initial Data Sets 3. Research Questions 4. Methodology 5. Findings 6. Discussion 7. Conclusion 8. ReferencesSummary of Key Findings
Briefly describe your most significant findings.1. Introduction
Never before has shopping online been so prevalent. Customers express increasingly more preference for a personalized shopping experience, time-saving and convenience of eCommerce (Forbes). It is not surprising that companies who recognized that tendency and survived the dot com bubble burst are now reaping the benefits of e-commerce trends (Noe & Weber, 2019). As one of them, Amazon has initially started its business in July 16, 1995, as an online book store. Since then the company has expanded to a variety of products focusing mostly on promoting and selling brands. Undoubtedly the company has realized the potential of the online early on and since then has not stopped growing. The success of the company is often tied to its focus on technological advancements and through that improve their personalization features that result in loyal customers. Nowadays, through the use of data and subsequently tracking systems, Amazon is able to customize your search and further cater towards specific needs that reflect your habits. Though Amazon is not the only website using data to improve their e-commerce, the scale on which they operate is far greater than any other online shopping platform. Thanks to that, Amazon, as “the everything store” is dominating the market further pushing away its competitors (https://pure.uva.nl/ws/files/43148965/Van_Dijck_et_al._Reframing_platform_power_2019_.pdf) Thought the company remains widely popular, in the recent years, many compromising claims and cases have come to light. Amazon has been accused of tax avoidance, price discrimination and abusing workers’ rights among other claims. Some of the misconduct is hard to prove especially when it comes to price discrimination as it is directly tied to the ever-changing algorithm that the company constantly updates. Though some of the functions of algorithm used by Amazon like customized shopping feed and more suitable recommendations for shoppers might appear useful, it is important to retain a critical eye when analyzing practices employed by Amazon. As many features of the website are not available for research as the company protects its proprietary inner workings it might be interesting to look at the expansion of Amazon outside of its own site. For that purpose, we decided to focus our attention on the trackers employed by Amazon across different websites. The goal of monitoring the trackers is to see to what extent Amazon is able to personalize search results on their websites based on our activity outside of it. If the site manages to collect more data on the users then previously expected it might indicate that there are new ways in which we should think of the analysis and future methodology when approaching sites similar to this one.2. Initial Data Sets
This research looks at the difference in Amazon search results between two ‘hobby’ profiles; one focused on sports, and the other focused on music. For the music category, we searched for guitars, goth blogs, and music-related topics such as rock and heavy metal songs, while in the sports category the search was oriented towards running clothes and accessories, certain diets and sport lifestyle in general. We chose to do a clean ‘default’ search, a search that involved polluting the browser for an hour, and another that involved using one website with Amazon trackers for approximately 15 minutes. The detailed steps are provided below.2.1 Amazon Clean Data Search
First we made a ‘control profile’, setting up Brave as a clean research browser, with no previous browsing history. We went to Amazon.com, setting our Language to English, currency to US Dollars and shipping location to the Netherlands. We queried five products that we deemed ‘neutral’ and broad enough to not be specifically related to our hobby profiles. We chose the terms [backpack, jacket, shoes, phone case, smart watch], to see if we would find any differences in the results. For every search we captured screenshots of the entire page, showing the results for every Amazon search. We used the AmTrex extension for Brave, from the Amazon Exposed project, creating a specific tag to group the results appropriately. We then downloaded a CSV of the raw data.2.2 Amazon Polluted Data Search
Then we split into two groups of three, one for each subject. All participants started with a clean research browser, then spent about an hour polluting their browser by browsing websites related to their topic. The participants within a group didn’t have identical browsing behavior but did stick to the specific topic. After the search, a new tag was created on the AmTrex extension, and the participants repeated the five searches in Amazon.com, created screenshots, and downloaded the data.2.3 Amazon Second Polluted Data Search
In the second round, we cleared our browser’s history and cookies again and selected four websites that we knew had Amazon trackers. We used the Ghostery extension for Google Chrome to show us which sites had Amazon trackers. We chose the websites The Sun, Wired, IMDB, and Reddit to research. Each of us browsed one specific website, searching queries and browsing topics related to our topic, sports or music. We then repeated the previous steps of querying the five neutral products and recorded the results, recording the screenshots and results of the Amazon search in a CSV. This data was merged into one spreadsheet at the end of the data collection.3. Research Question
To what extent are search results on Amazon influenced by previous browsing history related to two preselected different topics?4. Methodology
The following table shows and overview of the division of the research into 3 phases. Phase one represents the initial data collection on Amazon with a clean browser, phase two represents the two polluted data collection rounds and phase three represents the merging of the data and visualization.4.1 Overview
| Phase | Description | Method |
| 1. Clean browser search in Amazon | Querying 5 items on Amazon with a clean Brave Browser and collect the results. | Query design:
Data collection:
Browser: Brave, Cleaned
Amazon settings:
|
| 2. Pollution of browser outside of Amazon with two different persona’s | The team pollutes their browser by allowing cookies and trackers on their browser and searching for terms that fit their persona’s interests. Three team members search for one persona and three members search for the other
|
Personas:
Browser: Brave, cleaned. Allowing trackers and cookies on every site that is open.
Query design: Using Google both teams search for everything related to their persona.
Data collection:
|
| 3. Data Analysis | Data merging and visualization | After merging all of our data together using Google Sheets, we made visualizations using Google sheets pivot tables and data visualisation tool Tableau in order to reach conclusions. |
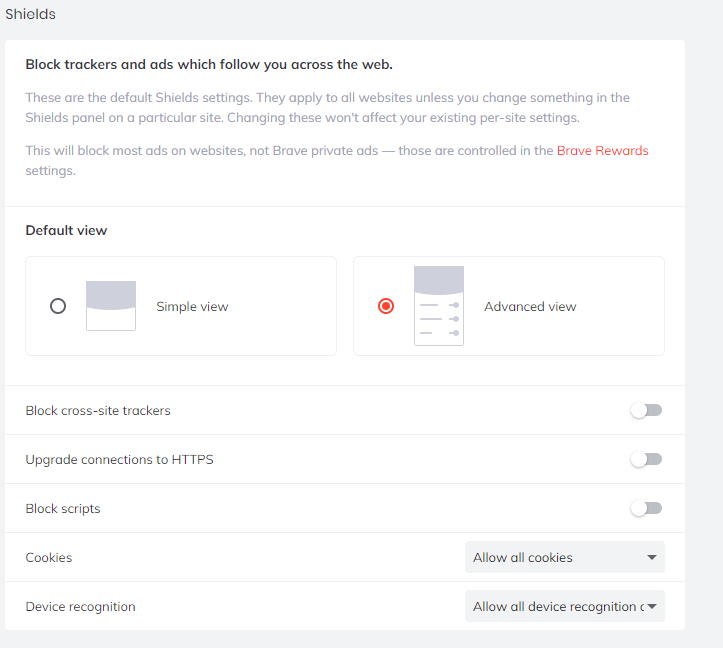 Figure 1. The Brave browser setup.
5. Findings
After collecting our data, two different approaches were used for analyzing the data. The collected data was exported to a .csv file. To make sense of the data more broadly and in order to check some preliminary expected findings, we used the Pivot table function in Google Sheets. To further clarify the data, some visualizations were made using Tableau.Most of our findings are based around a three-way comparison between the clean profile and two opposing variables within our data, such as Mono versus Polluted and Music versus Sports. This was further supplanted with analysis of the screenshots that we made for each different query, which we used both in order to identify anomalies within the .csv file as well as analyze findings that aren’t tracked by the amTREX tool.
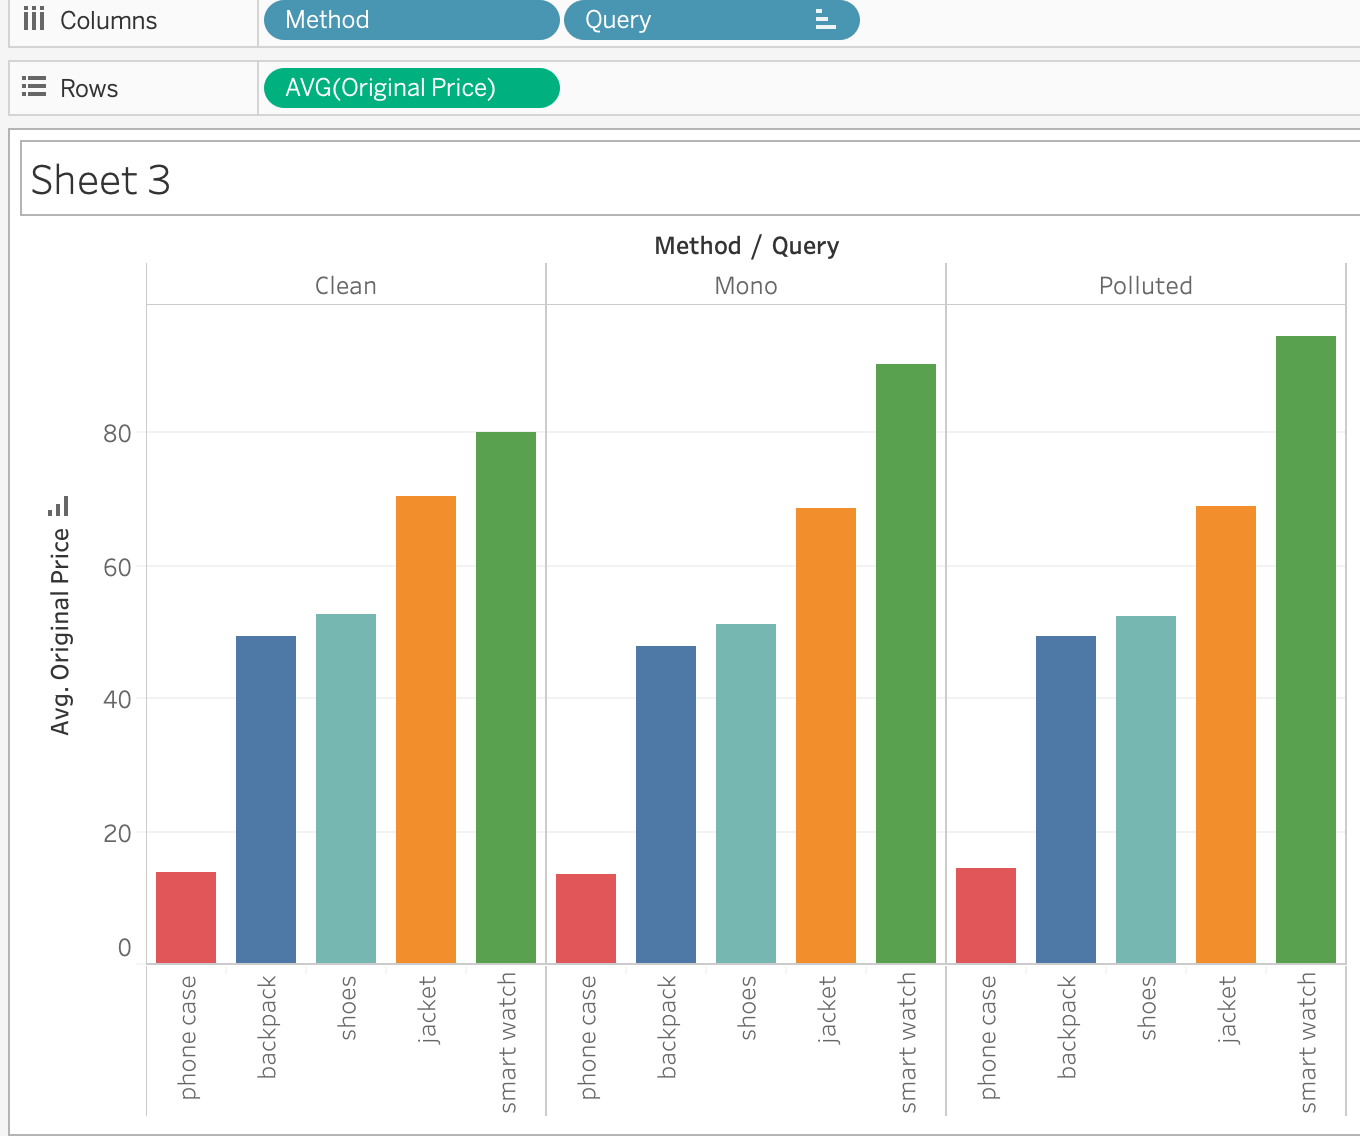 Figure 2. A graph showing the method (clean/ mono/ polluted) and the queries (phone case, backpack, shoes, jacket and smartwatch) versus the average original price (ranging from $13-95)
The first finding that this step shows is the fact that each of the six different participants of our team achieved different average prices for all selected queries, as expected since our specific browsing behaviors were all different. The next step we took was comparing the mono results versus the polluted results, which showed a few different things. First of all, the clean profile always shows the lowest average price results, with the average price increasing slightly for the mono results and even more for the polluted results. This difference in average price is most striking for the ‘smart watch’ query, where for example the average price difference between the mono and polluted results for the Music group was shown to be almost 10% higher for polluted results [See figure 2]. Between the mono and polluted results we also looked at the screenshots we took. From this we show that the amount of advertisements displayed seems to decrease the more data Amazon has of the user, however this result could not be replicated when the clean data was also considered, therefore this result is inconclusive.
Figure 2. A graph showing the method (clean/ mono/ polluted) and the queries (phone case, backpack, shoes, jacket and smartwatch) versus the average original price (ranging from $13-95)
The first finding that this step shows is the fact that each of the six different participants of our team achieved different average prices for all selected queries, as expected since our specific browsing behaviors were all different. The next step we took was comparing the mono results versus the polluted results, which showed a few different things. First of all, the clean profile always shows the lowest average price results, with the average price increasing slightly for the mono results and even more for the polluted results. This difference in average price is most striking for the ‘smart watch’ query, where for example the average price difference between the mono and polluted results for the Music group was shown to be almost 10% higher for polluted results [See figure 2]. Between the mono and polluted results we also looked at the screenshots we took. From this we show that the amount of advertisements displayed seems to decrease the more data Amazon has of the user, however this result could not be replicated when the clean data was also considered, therefore this result is inconclusive.Comparing between the Sports and Music groups, one noticeable variable was the amount of different products offered. This result is significant because we were able to replicate it for both the mono and the polluted dataset. For the ‘jackets’ query, the amount of different products offered to the Music group was slightly higher than the amount offered to the Sports group, while the Sports group got offered more results in the ‘shoes’ query. The amount of products offered for the ‘backpack’ query was identical across both groups, and for the ‘smart watch’ and ‘phone case’ queries the differences were fairly negligible since they only differed from the clean profile in either the mono or the polluted results, but not in both.
The final variable we considered in this phase was the amount of discount offered to the Music and Sports groups. What we found was that the average discount value for queries within the Sports group was slightly higher than the average discount for the Music group. Conversely, the average of the total price of products offered, which is the original price minus any discount, was slightly higher for the Sports group as well, while one might assume that a higher average discount would result in a lower average total price.
6. Discussion
The research project has shown that it is difficult to clearly identify the ways in which Amazon track its users outside of the platform; even the proven presence of Amazon trackers did not influence the findings strongly. Although in our repeated searches, the prices of the products and average discount varied when comparing the results from the clean and polluted browser. This may mean that there is some kind of movement and variables in Amazon’s real-time pricing policy, however it is impossible to track and sketch the shape and mechanisms behind the system, especially when conducting the research in the data-sprint format. Additionally, in our opinion, it may be caused by Amazon’s business privacy policies. Amazon is not the only player that track users online, and its online movements could be scanned and analysed by their competitors trying to understand and copy their business model. When it comes to pricing, the average cost for every product was slightly lower when queried in the unpolluted browser. It may suggest that Amazon sets prices higher for the user that it already knows. It is important to admit that none of the researchers were logged into the platform, thus Amazon could only gather the knowledge on the user based on their previous online behaviour. As discussed in the findings section, the highest difference was noticed when querying [smart watch]. As it was potentially the most expensive and most specific object browsed it is possible that Amazon would show lower prices for a relatively highly in demand piece of equipment that people who are not yet Amazon customers are likely to search for on the internet.While we did find some differences between both the different hobbies as well as the different levels of browser pollution, these differences were not dramatic enough for us to draw conclusions upon. For example, as stated in the results section, the amount of different jackets offered was slightly higher for the Music group compared to the Sports group. It is hard to say that this result shows anything about rock music fans, their variety in fashion sense, or Amazon’s interpretation of it, since the difference could have been caused by any number of factors unbeknownst to us that Amazon ‘hides’ within its platform.
6.1 Limitations
Although the overall time of the search was controlled by the researchers when conducting both the ‘polluted’ and ‘mono’ searches, every individual chose their own speed of browsing, clicked on different items, and spent different amounts of time on different pages. If this was to be done by someone else, the results would most likely differ, since every person brings in their own method of browsing. The group tried to use the same browsing settings, however due to technical differences, the research could never be ‘clean’ because it was conducted on six different computers with different language settings and perhaps even different browser settings. The environment can rarely be 100% controlled. Additionally, there were some issues with setting the Brave Browser into English on a laptop with the operating system running in Polish. Computer’s general settings had to be changed. When collecting data using a browser polluted only in one paged tracked by Amazon, the websites that we chose which did have Amazon trackers did not show whether they target certain websites more than others. For example, Amazon owns IMDB, whereas they do not own The Sun or Reddit, therefore maybe certain websites may have fewer or less active Amazon’s trackers. The research was based on the AmTrex browser extension which is still in development by the researchers who created it, so there were some inaccuracies, sometimes causing the data to be incorrectly processed or copied over. For example, many of the product titles were not accurately copied over and would appear as “Best Seller” or “Learn more about sponsored products”. However, some data was accurately recorded, which is why we did not delete these cells. For example, the thumbnail link did get saved by the extension, so we were able to recreate which products were selected, although this took extra time. Due to the character of the research project and the fast pace of the Data Sprint in general, the team managed to conduct the research steps only once. If the project was repeated and developed, some different or better answers to the research questions would be provided.7. Conclusion
The name of the data sprint group within which the research was undertaken was named ‘Amazon Tracking Exposed, and indeed the idea of the project and its hypothesis was to find and understand how does Amazon track internet users in order to manipulate the prices of their product. Since Amazon is an e-commerce giant and its history is almost as long the public access to the web, it could afford such controversial pricing policy and other tracking activities. In the attempt to solve the algorithmic mystery, specific methodology was set up in order to allow comparison of Amazon’s prices when using a ‘clear’ or ‘polluted’ web browser. Findings of the research show that the presence of Amazon’s trackers may be felt when browsing online. Furthermore, the short research has proven that Amazon manipulates prices, as all the group members had different average prices and discounts. The time span of the data sprint put some time restrictions over the research projects, potentially causing them to be less accurate. As it has a positive aspect of intensive group work and idea sharing. However, the findings of the group could probably have more quality and be more ground-breaking, as the research was to conduct longer and avoiding some of the limitations and errors. However, the research project did do some positive impact, as gathering the Amazon data was possible thanks to the Amazon Tracking Exposed Tool that was created by Claudio Agosti and his team, and conducting a research project using their methods allowed researchers to give some positive and constructive feedback to the developers giving potential to further Amazon tracking research.8. References
Cheney-Lippold, John. 2011. A New Algorithmic Identity: Soft Biopolitics and the Modulation of Control. Theory, Culture & Society 28(6): 164-181. Foucault, Michel. 2007. The Meshes of Power. In: Crampton, J W and Elden, S (eds.) Space, Knowledge and Power: Foucault and Geography. Aldershot: Ashgate, 153-162. Gillespie, Tarleton. 2014. The Relevance of Algorithms. In: Gillespie, T, Boczkowski, P J and Foot, K A (eds.) Media Technologies: Essays on Communication, Materiality, and Society. Cambridge MA: MIT Press, 167-194. Plantin, Jean-Christophe, Carl Lagoze, Paul N Edwards, and Christian Sandvig. 2018. Infrastructure Studies Meet Platform Studies in the Age of Google and Facebook. New Media & Society 20(1): 293-310. Rouvroy, Antoinette. 2013. “Algorithmic Governmentality and the End(S) of Critique” http://networkcultures.org/query/2013/11/13/algorithmic-governmentality-and-the-ends-of-critique-antoinette-rouvroy/ van Dijck, José, and Thomas Poell. 2013. Understanding Social Media Logic. Media and Communication 1(1): 2-14. Zuboff, Shoshana. The Secrets of Surveillance Capitalism. Frankfurter Allgemeine, 2016.This project has received funding from the European Research Council (ERC) under the European Union’s Horizon 2020 research and innovation program (grant agreement No 825974-ALEX, with Stefania Milan as Principal Investigator; https://algorithms.exposed).


| I | Attachment | Action | Size | Date | Who | Comment |
|---|---|---|---|---|---|---|
| |
image2.png | manage | 40 K | 30 Jan 2020 - 09:18 | JedeVo |
Ideas, requests, problems regarding Foswiki? Send feedback