Does Amazon know your wealth?
Tracking perceived purchase power and algorithmic bias on Amazon.com
Team Members
Nicol Cheung, Paul Dunshirn, Qianyu Feng, Ziyi Liu, Josh McDonald, Bryan Steffen, and Zoe Tang
Contents
1. Introduction
2. Initial Data Sets
3. Research Questions
4. Methodology
5. Findings
6. Discussion
7. Conclusion
References
Appendix A
1. Introduction
That online shopping has become ever more popular could be considered a truism. The popularization of the Internet since Web 2.0 has ushered in a boom among Internet users around the globe and the explosion of online shopping platforms. Compared to their traditional counterparts, online shopping platforms offer users multiple conveniences such as ease of purchase, 24/7 availability, and global reach. Among many shopping platforms, Amazon.com is one of the most well-known. Boasting a global user base and with subsidiaries such as Bookdeposit and Goodreads, this US-based conglomerate is ranked the second most popular online shopping platform, after Chinese domestic online shopping platform Tmall (Alexa Traffic Rank, 2019). However, in 2000, a study found that Amazon.com had been offering different discounts to customers who shopped for the same DVDs (Streitfeld, 2000). Despite the company's initial explanation of such differential practices as "random price tests", Amazon.com subsequently labelled them as a mistake and promised to refrain from similar practices in the future (Amazon.com, 2000).
In effect, the controversy above amounts to what is today known as "price discrimination", defined by Howe (2017) as "a method by which retailers segment their market and charge a different price to each segment". Despite its negative perception among customers, price discrimination seems to be a prevalent business practice adopted by online shopping platforms. Moreover, the phenomenon of price discrimination is caused by the general debate around algorithmic recommendations, and researchers in different platform studies have addressed this issue in specific case studies. For instance, Eriksson, Fleischer, Johansson, Snickars, and Vonderau (2019) have conducted research on the streaming music platform Spotify, and discussed how the platform implicitly and explicitly collects user’s interactivity of the service and then pushes notifications to users of its data-driven personalized playlist. Similarly, in Amazon’s case, the commodity changes from music to physical products and visible prices.
There are two challenges for researchers to keep online shopping platforms in check. First, the recent "API-calypse" (Bruns, 2019) has blocked off all access to the APIs and algorithms behind these sites, making back-end study of pricing untenable. Meanwhile, while Amazon.com has officially claimed to have abandoned differential pricing according to user profiling, a study finds that prices for each item on Amazon.com changes every 10 minute on average. So far, the company has refrained from disclosing details of its pricing mechanisms, only describing their pricing to be based on principles of "maintaining competitive prices on everything [they] carry”. This urges academic researchers to testify and explore the pricing mechanism of Amazon.
Building upon previous research, this report aims to determine whether price discriminiation occurs within the popular online shopping platform Amazon.com. We aim to answer the question: how does perceived purchase power influence search results and prices on Amazon.com? The research for this project was conducted during the 2020 Universiteit van Amsterdam data sprint and utilized amTREX, a tool developed by Tracking Exposed that allows researchers to scrape data from Amazon’s platform. After conducting a ‘clean’ baseline search for five search terms, we divided the researchers into two groups: one with high budget preferences, and one low budget preferences. With differently priced items in each respective group members’ shopping cart, we then queried the same five items to determine if Amazon’s search results would reflect the price points of the respective groups. While our report does not provide conclusive evidence that Amazon actively discriminates based on perceived wealth, it does suggest user browsing behaviour influences search results. Furthermore, our findings indicate that items within the shopping cart do not solely determine search result prices.
2. Initial Data Sets
The data was collected with the AMTrex browser extension over two days, namely before and after data pollution. The first set of search results has been collected on 15-1-2020 4pm (GMT +1) and reflects the prices and items listed for 5 search queries at that specific time. After a 2-hour data pollution session the same 5 queries are made on Amazon.com, and a second set of data is collected on 16-1-2020 1pm (GMT +1).
3. Research Questions
RQ: How does perceived purchase power influence search results and prices on Amazon.com?
SQ1: Do items in the shopping cart affect search results and article prices on Amazon.com?
4. Methodology
Since Amazon has been consistently pursuing personalization technology and has the ambition to become the most customer-centric company (Montgomery and Smith, 2009), this research takes a further step into the exploration of the effect on users’ price preferences of certain products on their search results on Amazon.com. An experimental approach combining a designed experiment and data collecting through the Amazon tracking exposed tool allows us to gain some insights into this matter.
The data was collected through the tracking tool amTREX, developed by Tracking Exposed. The tool was created to “expose how tracking and profiling from user data had a negative impact on society” (Tracking Exposed, 2019). The software tracks individual (and collective) search results, and documents factors such as price, potential discounts, order that products are displayed, and the average price per query. This data is then downloaded into CSV format for further analysis. In order to determine if perceived purchasing power influences Amazon search results and prices, we developed a three-phase method (see Chart 1).
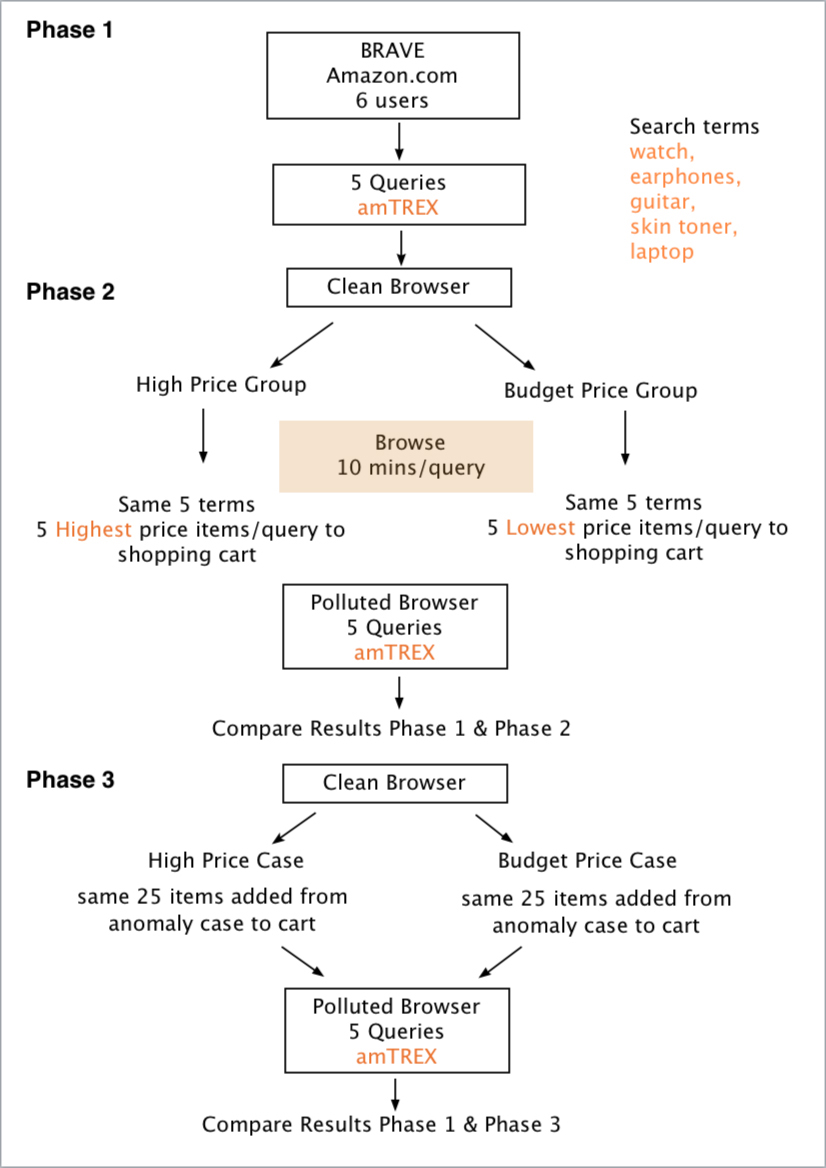
Chart 1: Three phases of the methodology
Phase One
Collectively, our group selected five search terms: watch, earphones, guitar, skin toner, and laptop. The rationale is that these five items each have the potential to demonstrate vast price variations and cover broad product categories (apparel, electronics, health & beauty, etc). Afterwards, six researchers executed the queries at the same time using the web browser ‘Brave’, as well as a ‘clean’ browser (cleared cookies, cache, and history), without logging into an Amazon account. All of the queries were conducted in English with the currency set to USD. After the search results of each item had been scraped, one specific item of each query was picked and the price was recorded (see Appendix A). The browsers were cleared, and the next term was searched. This process was repeated for the subsequent terms. The data collected from this phase was used as the baseline for later comparison and analysis.
Phase Two
At the start of this phase, the six researchers were divided into two control groups, one ‘high price group’ and the other ‘budget price group’ (with three members in each group). The intent was to allow Amazon to collect certain information on each respective group, which we refer to as ‘polluting’ the profiles. Each of the groups searched the same five items, in the same sequence as the previous phase. However, the groups were given ten minutes per search query to add five items to their shopping cart, with the high price group selecting the most expensive items and the budget price group adding the lowest priced items, respectively (see illustration 1).

Illustration 1: Screenshot comparing the shopping carts of the Budget Price Group to the High Price Group. Search query: ‘watch’.
As opposed to the first phase, the browsers were not cleared between searches. At the end of this process, each researcher had five items from each search in their shopping cart, totalling 25 items per person (see Table 1). With these ‘polluted’ profiles and 25 items in each shopping cart, the original five terms, watch, earphones, guitar, skin toner, and laptop, were queried. The search results pages were then saved by amTREX and compared to the results of Phase One. Additionally, each of the researchers found the specific item that was identified during Phase One to determine if the price had fluctuated (see Appendix A).
Table 1: Shopping cart summaries. Prices displayed in USD
Phase Three
This phase was conducted after the initial analysis result from Phase Two indicated that there were two outlier cases (one from each group) that strongly validated our hypothesis, with the remaining four demonstrating negligible differences. As a result, this phase intended to determine if the results from these two anomaly cases could be reproduced. With clean browsers, two researchers (one from each group) added the same 25 items from the anomaly cases to their respective shopping carts. The items were added via hyperlinks directly to the item pages, without the process of browsing. The two researchers then conducted the same five search queries to determine if shopping cart items influence the average price of items on the respective results pages. The data was then collected by amTREX and compared to the results of Phase One.
5. Findings
During Phase One, six researchers conducted five different queries with clean browsers. The average prices of each corresponding category had only slight variations, which indicates a good starting baseline point (see ‘Clean Browser’ results in Graph 1).
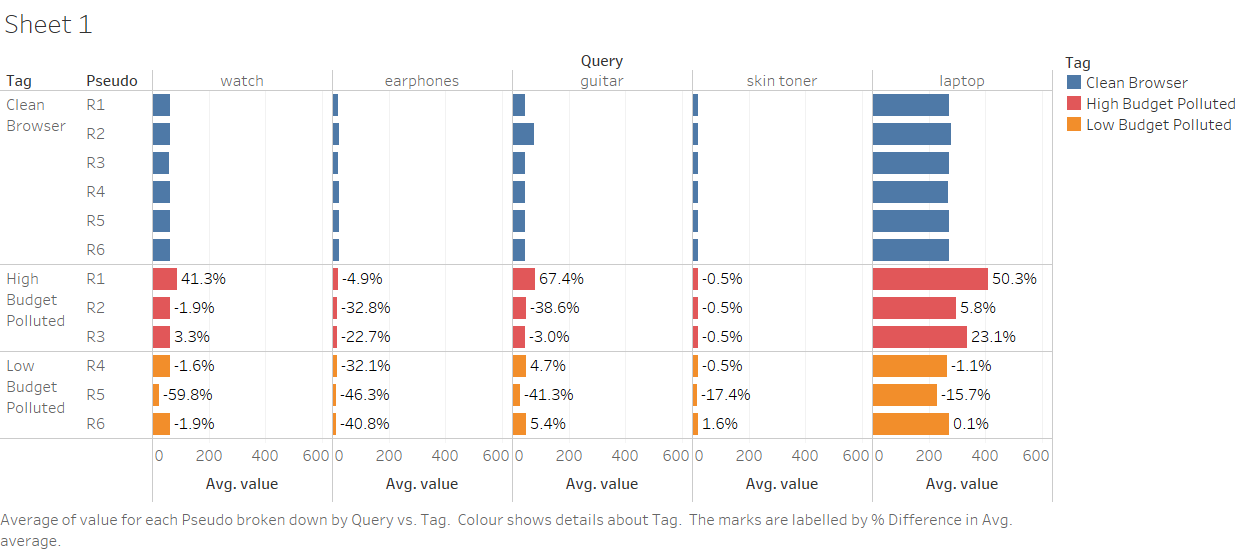
Graph 1: Average value for each researcher broken down by Query vs Tag. The marks are labelled by % difference in average value between Clean Browser and Polluted search results.
In Phase Two, the group was divided into ‘High Budget’ and ‘Low Budget’ groups and the clean profiles were ‘polluted’. Once the same five items were queried, our findings indicate that the average results page price does change, with many indicating notable variations in price. As shown in Graph 1, the red bars indicate the high budget group while the yellow bars represent the low budget group. When looking at the average price change between the researchers (see Graph 2), for the high budget group, the average price of R1 increased by 30.72 percent, R2 decreased by 13.60 percent while there is only a negligible change in R3’s average search result price. As for the low budget group, R4 and R6 slight decreases by 6.12 percent and 7.12 percent, respectively. Meanwhile, R5 demonstrated a dramatic decrease of 36.10 percent.
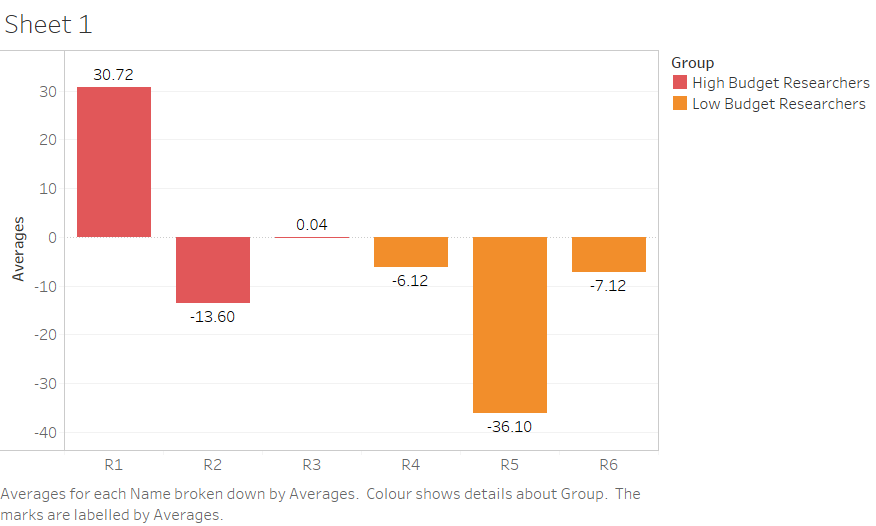
Graph 2: Average change in price between Clean Browser and Polluted search results. Numbers presented in percentages.
While it was hypothesized that purchase power would influence search results, only R1 from the high budget group and R5 from the low budget group show results that reflect our hypothesis. However, the other four do show changes when compared to the results of Phase One, with three showing results in favour of our hypothesis. Additionally, the five specific items selected at the start of Phase One were once again identified (see Appendix A). However, none of the group members from either group noticed a change in price.
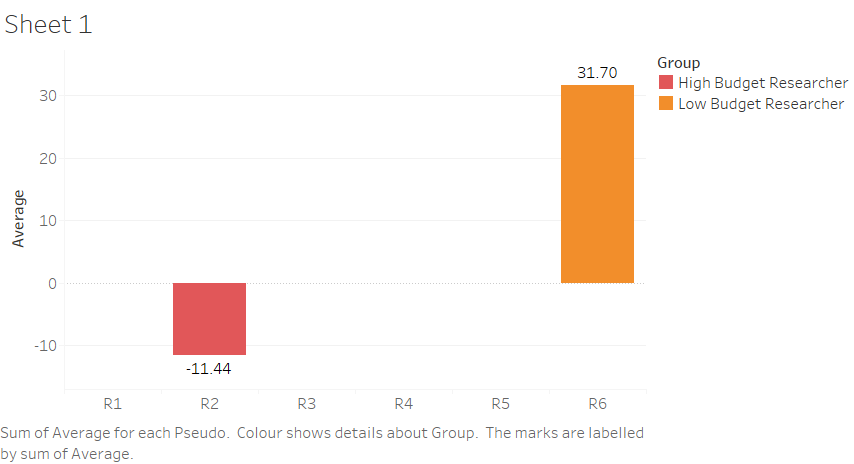
Despite inconsistent findings from the average search results, one researcher in each group showed the expected effect (see R1 and R5 in Graph 2). Since there are many factors that may influence these results, in Phase Three, we conducted another query to either dismiss or confirm one variable: determining whether the items in the shopping cart influence price results. After the exact items from the outlier cases (R1 and R5) were added via hyperlink, our results indicate that there does not appear to be a correlation (see Graph 3).
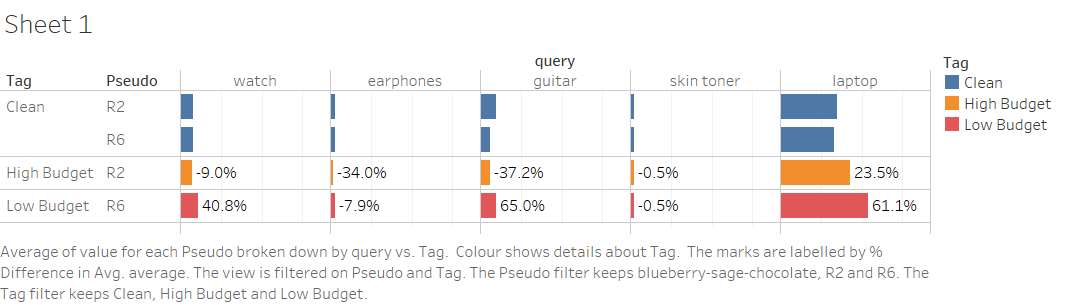
Graph 3: Average value for each researcher broken down by Query vs Tag. The marks are labelled by % difference in average value between Clean Browser and Populated Shopping Cart search results.
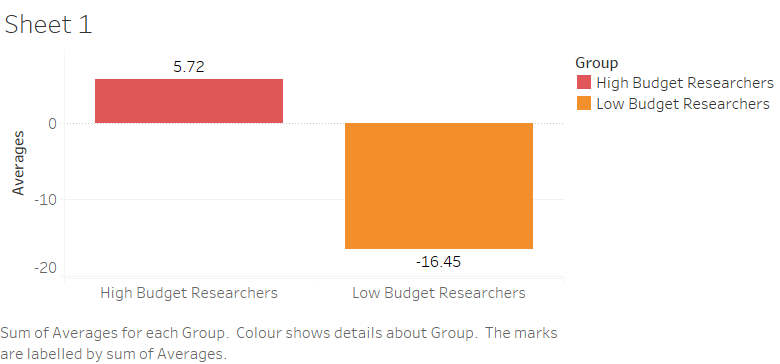
Indeed, for the researcher with 25 low budget items in their shopping cart, we found considerable increases in three of the five queries, with laptop and guitar showing the most significant spikes. Meanwhile, four of the five items decreased in average price for the high budget researcher. When averaged, these results indicate that it is not shopping cart items alone that impact the average value of items on a search result query (see Graph 4).
Graph 4: Average change in price between Clean Browser and Populated Shopping Cart search results. Numbers presented in percentages.
6. Discussion
So what does this research tell us about Amazon’s personalization process when it comes to search results and pricing of individual products?
During the conceptualization of the methodology, we came to realize that there are many potential variables that could be taken into account, first among them being time. As the research was conceptualized, executed and visualized within only a few days, the time to aggregate data was limited, which directly impacted two aspects of our methodology; variable selection and sample size. We decided to focus on examining Amazon through the variable of perceived purchase power and executed a total of 70 queries amongst six researchers, across two days. A larger amount of queries across a longer period of time could not only lead to clearer and more consistent results, but also allow for the tracking of Amazon’s search results and pricing system throughout time and thus circumvent the potential issue of randomized actions by Amazon that can not be predicted.
As outlined in the findings section, the collected data from Phase One (clean browser queries) and Phase Two (polluted browser queries) resulted in two out of six researchers, one out of the high budget and low budget group respectively, supporting the hypothesis that perceived purchase power influences the search results (see Graph 2). One could conclude from these results that perceived purchase power may impact search results. Although not every researcher produced results that reflect the hypothesis, the average price difference across each group (see Graph 5) could suggest that the respective browser pollution of searching, browsing and putting high or low budget items into the shopping cart does have an influence on queries.
Graph 5: Average change in price between Clean Browser and Polluted search results between High and Low Budget groups. Numbers presented in percentages.
From this assumption, the group came up with a new sub-research question in which the variable of perceived purchasing power was separated into two sub-variables: the action of browsing search results on Amazon and putting items in the shopping cart.
In a follow-up test, two researchers replicated the shopping carts that previously showed a considerable and consistent price increase or decrease in the search results averages, but without repeating the search queries and the browsing of search result pages. As seen in Graph 4, the Phase Three test did not deliver results that would align with the results from the previous test. The results from this test suggest that the action of adding high or low budget items to the shopping cart alone, without the action of search result browsing, does not appear to correlate with the average price of search results.
One could attribute the inconsistency in research results to a concept that is called the “cold start” problem, which states that services with recommendation systems can be unable to deliver a proper amount of personalization due to a lack of available data by the service user (Lika et al., 2014). In the framework of this research, this could explain that while we did have results that would support our hypothesis of price personalization based on perceived purchase power, the limited amount of pollution lead to an insufficient amount of data for Amazon’s personalization systems to deliver consistent and considerable results.
Therefore, while the results from all the tests do not allow for concrete conclusions, they do show that there are variables to be researched, which affords for new hypotheses such as: Does search result browsing as an isolated variable influence subsequent results? What if you actually purchased the items? To what extent does personalization speed up if you execute the browser pollution while being logged into an Amazon account? The results from this project give reason to do further research by potentially examining to what degree each of these variables influence the user experience and the methodology that was established in the framework of this project can quite easily be adapted and expanded to a variety of variables.
7. Conclusion
This research project examined the degree of personalization on the level of search results and price of individual items. By posing an initial hypothesis that there could be a degree of price discrimination in the search results and individual items based on perceived purchase power which was simulated by querying for 5 distinct item terms. Using the amTREX browser extension, a methodology based on the AB testing concept was developed to determine to what extent the pollution of a browser affects the user experience and product selection on the website.
With six researchers executing five queries in unlogged states, once on a clean browser and once after polluting the browser, by browsing for and putting either only highly priced or lowly priced items into the shopping cart, the results found in the framework of this test indicate that there is a degree of personalization. Based on these findings, a sub-research question and test were developed to determine if only the act of putting items into the shopping cart as a variable would suffice to achieve similar results as in the first test. The methodology for this test based on the AB test concept stayed largely the same, except that the pollution of the browser only consisted of replicating the shopping carts from the previous test without the variable of search result browsing. The results of this test were found to be inconclusive. Therefore it could be concluded that putting items in the shopping cart alone is not pertinent in the personalization process of Amazon’s systems.
The limitations encountered during this project can largely be attributed to the concept of the “cold start” problem, meaning that the inconsistencies in this project’s findings can be attributed to the fact that Amazon’s personalization systems may not have received enough data through the browser pollution which was executed before the polluted queries. Though we may not be able to establish exactly which variables are used to determine search results, our findings do indicate that Amazon does track users even when in an unlogged state. Comparing the clean results to the polluted (see Graph 2), it is clear that variables are at play, whether this be time spent on pages, number of results pages loaded, scroll speed, or randomization. Using this project and methodology as a starting point, the research on perceived purchase power-based personalization on Amazon can be easily and greatly expanded upon by isolating and testing for different variables and, in the framework of bigger projects, obtain larger data sets and sample sizes.
References
Amazon.com. (2000, September 27). Amazon.com Issues Statement Regarding Random Price Testin [Press release]. Retrieved from https://press.aboutamazon.com/news-releases/news-release-details/amazoncom-issues-statement-regarding-random-price-testing.
Bruns, A. (2019). After the ‘APIcalypse’: social media platforms and their fight against critical scholarly research. Information, Communication & Society, 22(11), 1544-1566.
Eriksson, M., Fleischer, R., Johansson, A., Snickars, P., & Vonderau, P. (2019). Spotify teardown: Inside the black box of streaming music. Mit Press.
Howe, N. (2017, November 17). A Special Price Just for You. Forbes. Retrieved from https://www.forbes.com/sites/neilhowe/2017/11/17/a-special-price-just-for-you/#190c86ab90b3.
Lika, B., Kolomvatsos, K., & Hadjiefthymiades, S. (2014). Facing the cold start problem in
recommender systems. Expert Systems with Applications, 41(4), 2065–2073.
Montgomery, A. L., & Smith, M. D. (2009). Prospects for Personalization on the Internet. Journal of Interactive Marketing, 23(2), 130-137.
Rayna, Thierry, John Darlington, and Ludmila Striukova. "Pricing music using personal data: mutually advantageous first-degree price discrimination." Electronic Markets 25, no. 2 (2015): 139-154.
Streitfeld, D. (2000, September 27). On the Web, Price Tags Blur. The Washington Post. Retrieved from https://www.washingtonpost.com/archive/politics/2000/09/27/on-the-web-price-tags-blur/14daea51-3a64-488f-8e6b-c1a3654773da.
The Top 500 Sites on the Web. (2020, January 27). Retrieved from https://www.alexa.com/topsites. Accessed on January 27, 2020.
Tracking Exposed (2019). A tool for algorithm analysts to look into Amazon's personalization. https://amazon.tracking.exposed/
Appendix A
Five specific items selected for observation
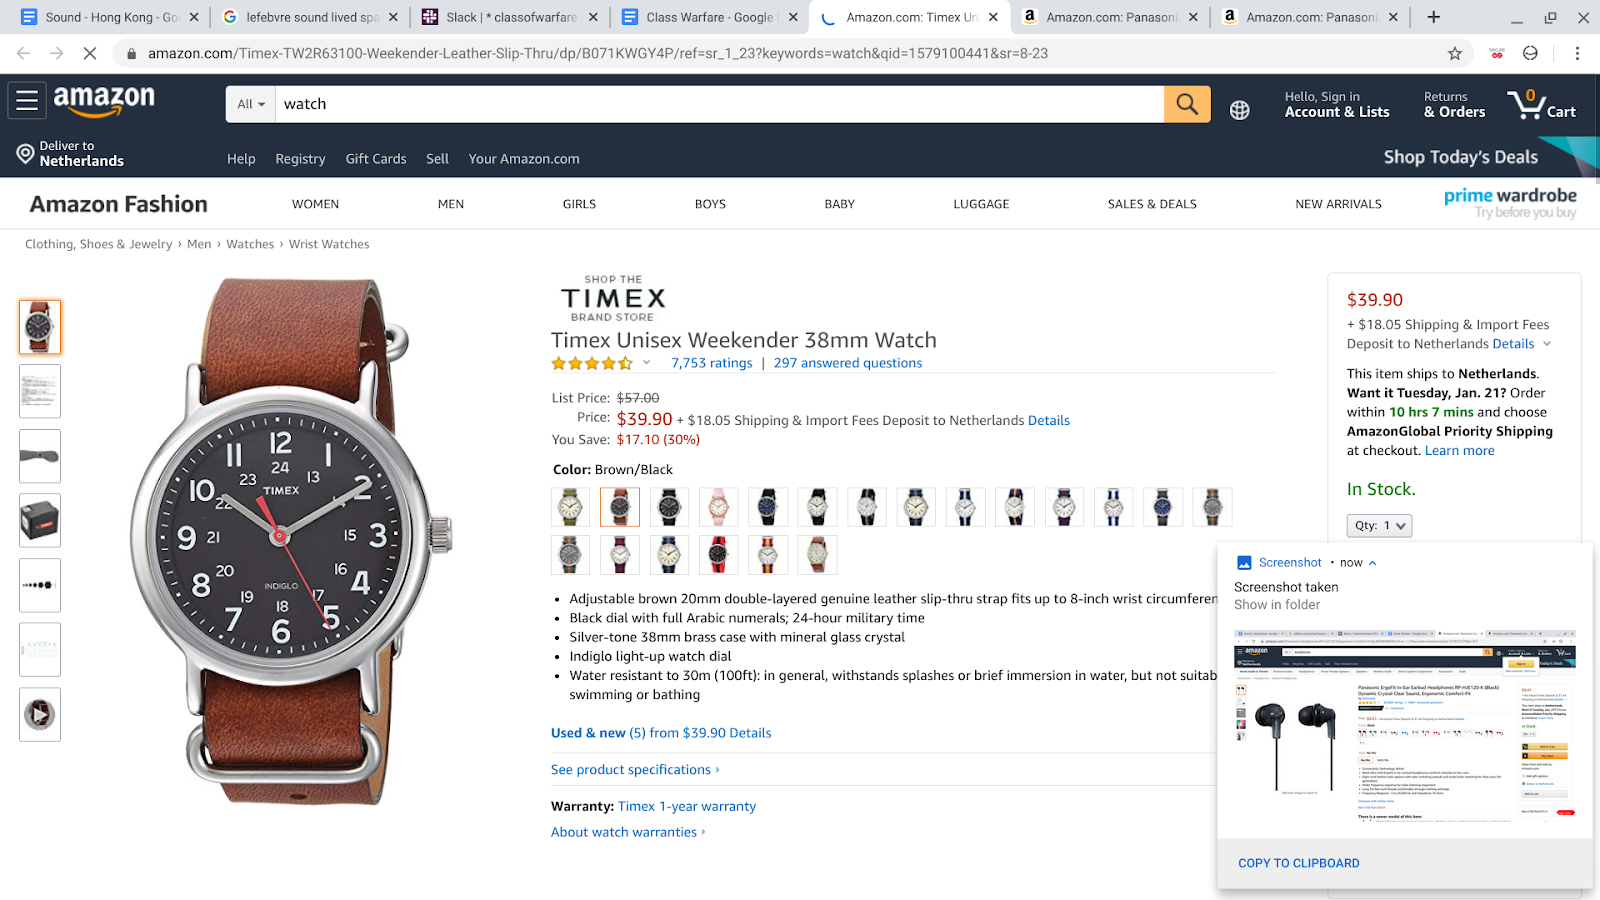
Search: "watch" (16:00)
Item: Timex unisex Weekender 38mm Watch
Price: $39.90USD
Screenshot:
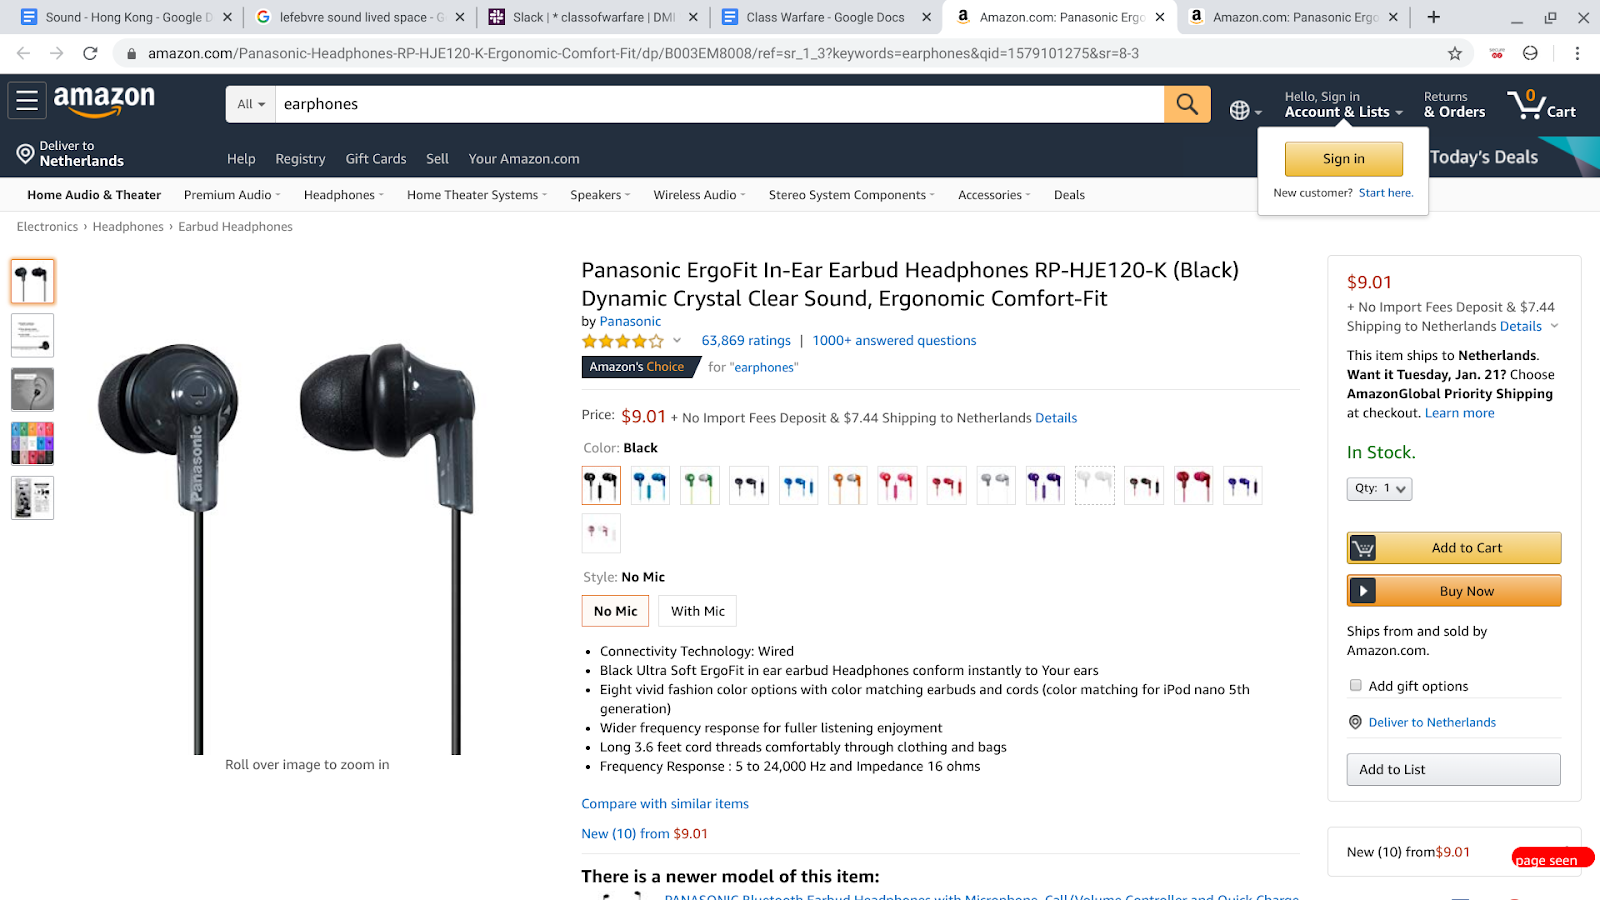
Search: "earphones" (16:13)
Item: Panasonic ErgoFit In-Ear earbud RP-HJE120-K (Black)
Price: $9.01USD
Screenshot:
Search: "guitar" (16:22)
Item: Beginner 30" Classical Acoustic Guitar 6-string Junior Linden Wood Traditional Guitar/ w/ Wooden Fretboard, Case bag, Tuner, nylon strings,
Price: $64.99USD
Screenshot:

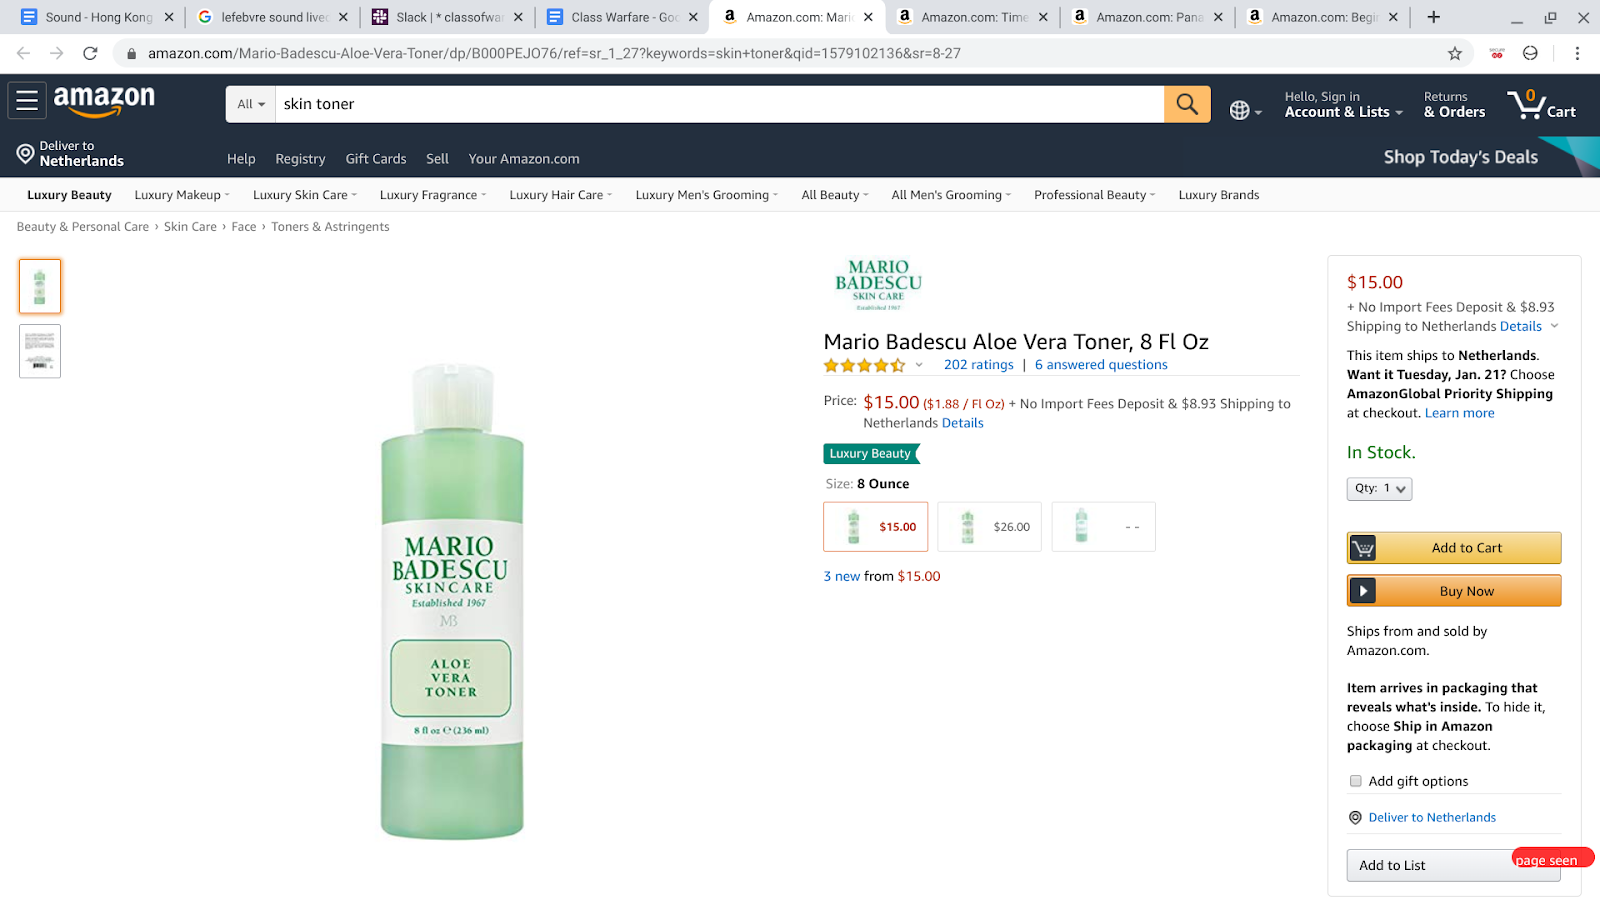
Search: "skin toner" (16:28)
Item: Mario Badescu Aloe Vera Toner, 8 Fl Oz
Price: $15USD
Screenshot:
Search: ‘laptop’ (16:33)
Item: Acer Aspire 5 Slim Laptop, 15.6 Inches FHP IPS, 8th Gen Intel Core i5-826U, 8GB DDR4,
Price: $487.63USD
Screenshot:

This project has received funding from the European Research Council (ERC) under the European Union’s Horizon 2020 research and innovation program (grant agreement No 825974-ALEX, with Stefania Milan as Principal Investigator; https://algorithms.exposed).
Ideas, requests, problems regarding Foswiki? Send feedback