Hot in the City: Where is Everybody?
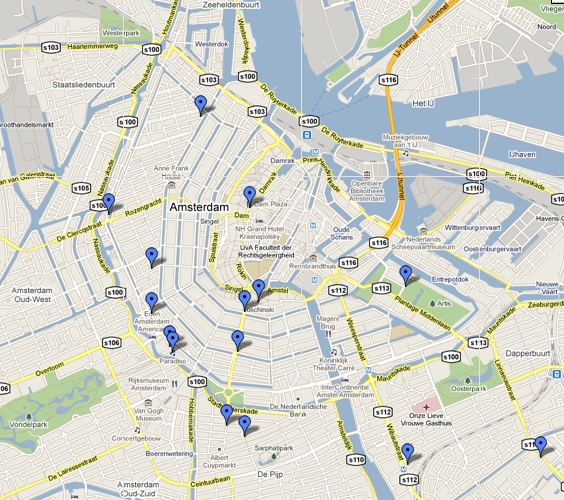
Group Members Erik Borra, Brittney Fosbrook, Magda Olszanowski, Marc Tuters Research Question What's going on? Where is everybody? It's not only tourists who ask themselves these questions when they step out into the world. Social media extends this awareness of which places are 'hot' in real time. Our project takes a live feed from the locative app foursquare, in which users report their current location, to measure the 'heat' of the city. To show us where, as Billy Idol once sang, it is " Hot in the City Tonight". Over half a decade ago, landscape artist Esther Polak, together with the Waag Society, made a work of media art, which in effect launched the field of locative media Real-Time Amsterdam. The project created a map of Amsterdam by giving GPS transponders to its participants (we use this beautiful image as the basemap for our own project). Our project sought to update this pioneering project with a data-set scraped from Foursquare. Though Real-Time Amsterdam anticipated the present moment when location-awareness has been incorporated into mobile devices, that pioneering project was not real-time. Fast-forward a half decade and new realtime data collection methods, and we were able to make a user-generated, real-time map of the city. While the project we displayed in the DMI Summer School used data from the last 24 hours for dramatic effect, the piece was designed to show what was happening in real-time according to Foursquare's significant user base. Method 1. Gathered relevant 'hot spot' locations in Amsterdam:We pulled the the top twenty locations with the most check-ins on foursquare in Amsterdam using both MisoTrendy and Map.pr.2. Created a physical map of Amsterdam with LED lights:
For the map visualization, we printed Esther Polak's map of Amsterdam with inverted colors and plotted LEDs in the locations of our 20 'hot spots'.3. Captured 24 hours of data from Foursquare:
The 20 top check-in locations were scrapped for a twenty-four hour period.4. Programmed micro-controller to light LEDs based on foursquare check-in data:
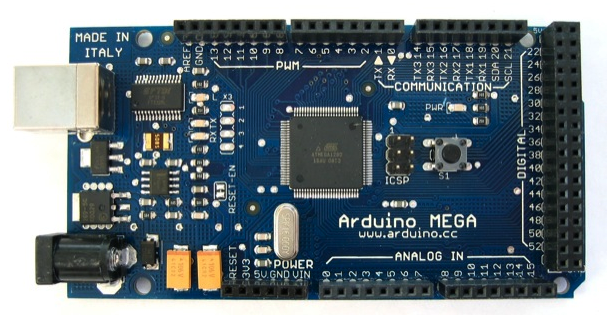
Using Arduino, programmed LEDs to light up locations where the most people are checked in at any one time.Project
 The final project was displayed as an art installation to the attendees of the Advanced DMI Summer School. It comprised a map of 20 LEDs, controlled by an Arduino micro-controller, mounted onto piece of foam-core with a basedmap of the city, based on the data from Real Time Amsterdam, along with a clock running on screen to show the time at which the data were sent.
Next Steps
We could mount a real-time version of this in the UvA as a permanent installation. A future related project might take this research to the Waag Society's Fab Lab where we could use their 3D printing and milling facilities, to create a topographic map of the city according to its use over a period of time.
Movie
DMI Summerschool: Hot In The City from silvertje on Vimeo.
The final project was displayed as an art installation to the attendees of the Advanced DMI Summer School. It comprised a map of 20 LEDs, controlled by an Arduino micro-controller, mounted onto piece of foam-core with a basedmap of the city, based on the data from Real Time Amsterdam, along with a clock running on screen to show the time at which the data were sent.
Next Steps
We could mount a real-time version of this in the UvA as a permanent installation. A future related project might take this research to the Waag Society's Fab Lab where we could use their 3D printing and milling facilities, to create a topographic map of the city according to its use over a period of time.
Movie
DMI Summerschool: Hot In The City from silvertje on Vimeo.

| I | Attachment | Action |
Size | Date | Who | Comment |
|---|---|---|---|---|---|---|
| |
Picture_4.png | manage | 520 K | 20 Aug 2010 - 08:34 | BrittneyFosbrook | Google Map of 20 locations |
| |
Picture_5.png | manage | 339 K | 20 Aug 2010 - 08:36 | BrittneyFosbrook | Arduino |
| |
foursquare_data.csv | manage | 549 bytes | 20 Aug 2010 - 13:15 | BrittneyFosbrook |
This topic: Dmi > DmiSummerSchool > SummerSchool2010 > AdvancedProgramProjects > InTheHeatOfTheCity
Topic revision: 10 Sep 2010, ErikBorra
Topic revision: 10 Sep 2010, ErikBorra
Ideas, requests, problems regarding Foswiki? Send feedback