Stormtalk: Situating adaptation and vulnerability with social media
EMAPS Datasprint: 24 March - 28 March 2014, University of AmsterdamReport by Ezgi Akdag and Inte Gloerich
Subject matter expert: Jerome Duvernoy
Project leaders: Axel Meunier, Bernhard Rieder
Team members: Andreas Birkbak, Inte Gloerich, Ezgi Akdag
Map designers: Giovanni Magni, Giulia de Amicis
Note before reading: some of the visualisations are not finished yet: they still contain some Lorem Ipsum text and fake names of researchers. The actual data that is represented is correct however.
Table of Contents
- Introduction
- How is climate change localised during the 2014 municipality elections in France?
- How are peoples responses to extreme weather events influenced by their proximity to the events?
- What are the differences in language usage between climate change discussions and extreme weather events discussions?
- To what extent are discussions on climate change triggered by specific events?
- Discussion
- Bibliography
Introduction
EMAPS (Electronic Maps to Assist Public Science) is a research project funded by the European Commision. Through intensive weeklong research projects, called datasprints, EMAPS aims to find innovative ways and methods for investigating at the web and its uses for different publics. Partnered with University of Amsterdam, Sciences PO, Politecnico Di Milano, University of Dortmund, Barcelona Media and The Young Foundation, EMAPS has brought professionals and students together since November 2011 to employ digital methods to map out controversial issues such as ageing politics and climate change (EMAPS). This research paper was written to present the results of the project titled Stormtalk as part of the datasprint held in Amsterdam in March 2014, which centred around vulnerability to climate change. Beck lists climate change, as well as financial crises, terrorist attacks, and digital freedom, as some of the global risks that the world faces today (Beck 2013 1). The United Nations Framework Convention on Climate Change defines climate change as a change of climate which is attributed directly or indirectly to human activity that alters the composition of the global atmosphere and which is in addition to natural climate variability observed over comparable time periods. (UNFCC). Yet, the latest IPCC (Intergovernmental Panel on Climate Change) report came up with a different definition, conceptualising it as a change in the state of the climate that can be identified (e.g., by using statistical tests) by changes in the mean and/or the variability of its properties, and that persists for an extended period, typically decades or longer. Climate change may be due to natural internal processes or external forcings such as modulations of the solar cycles, volcanic eruptions, and persistent anthropogenic changes in the composition of the atmosphere or in land use (IPCC). According to Beck, climate change is egalitarian in the sense that, even though its effects are diverse in different regions, it affects the whole world, not a specific part of it. Yet, while climate change affects all countries, not all countries contribute to it in the same degree (2009 37). While currently industrialising and already highly industrialised countries try to maximise their economic profits, their methods create hazardous side-effects that affect nature and subsequently the climate (38). These negative effects are spread around the world, and are in fact most severe in developing countries (37). This means that the countries who are least responsible for the environmental change are actually most prone to its adverse effects. Beside their natural susceptibility to these adverse effects of climate change, they are also least capable of dealing with them financially (37-38). Füssel argues that this means there is a double inequity between responsibility, capability to allocate the resources to fight the adverse effects of environmental change, and vulnerability (597). Similarly, Barnett, Lambert and Fry state that vulnerability also varies according to class, gender, ethnicity, and location as the capacities to cope with environmental change and exposure to risk change (104). Füssel argues that this inequity argument leads to the idea that the countries who are responsible for environmental changes and have the capacity to cope with the adverse effects of climate change, should bear the costs, while these resources should be allocated to the most vulnerable countries (598). As with climate change, vulnerability is defined in various ways, which all have far reaching consequences when it comes to allocating funds (Barnett, Lambert and Fry 103). One of its many definitions is the state of susceptibility to harm from exposure to stresses associated with environmental and social change and from the absence of capacity to adapt (Adger 2). Several projects have focussed on building indices to as sess the vulnerability of countries to climate change since the 1990s. Barnett, Lambert and Fry underline that even though there is not a single formula for measuring vulnerability, most indices consider one or more exposure to risks, susceptibility to damage, capacity to recover and net outcomes (102-103). Yet, Eriksen and Kelly contend that the assessments and the comparing of vulnerability levels of countries gain more importance in allocating funds like the Adaptation Fund, allotted by the United Nations Framework Convention on Climate Change (79). Cutter stresses the need to develop a set of parameters to assess and compare the level of vulnerability of countries for policy making (7). While assessing the level of vulnerability has been gaining importance for distributing responsibilities and resources, the different parameters used for measuring, change the ranking of countries in terms of vulnerability (Füssel 599). However, Eakin and Luers state that making such a comparison between countries is hardened by several factors, including the quality of the available data, the indicators selected for the assessment, presuppositions employed in weighting of variables and the mathematics of aggregation (377). Furthermore, as Klein and Möhner underline, there is no one approach that is systematic and widely agreed upon for measuring the vulnerability of a country (16). Economic, social, environmental indicators are all elements currently employed in different degrees to assess the vulnerability of a country (Birkmann). Our research focusses on the current situation in France. With the above in mind, this is particularly interesting because France is a developed country, and has for instance high emission levels (Burck, Marten and Bals). It is on the other hand not part of the regions of the world that are considered to be most vulnerable to the adverse effects of climate change (e.g. ND-GAIN). In this paper, we start with an analysis of climate change discourses used by politicians in France in the context of the municipality elections, which took place in March 2014. By examining the words used by the candidates when talking about climate change, we will get a sense of local concerns related to this topic. The second part of our project is geared towards the analysis of the resonance of climate change as a topic in France. We aim to analyse this with the assistance of the GASPAR database,[1] which provides detailed information about natural catastrophes that have taken place in France. Our point of departure is the hypothesis that natural disasters will increase the discussions related to climate change. To find out to which degree this is true, we will analyse comments made by users on Facebook pages of selected French newspapers. To do this, we will use Netvizz[2], built by Bernhard Rieder, and its accompanying search tool[3]. These tools allows us to extract observational data from Facebook. This means that we are able to analyse peoples behaviour directly, without having to rely on their own accounts of it, which are often subject to various filtering or altering factors (Rieder 347). By looking at the differences between talking about concrete weather events, such as extremely violent storms, and the broader, abstract concept of climate change, we aim to understand whether there is a correlation between them. In short, our project aims to answer the following research question: Do extreme weather events put climate change on the agenda in France? This is operationalised using the following sub-questions: (1) How is climate change localised during the 2014 municipality elections in France? (2) How are peoples responses to extreme weather events influenced by their proximity to the events? (3) What are the differences in language usage between climate change discussions and extreme weather events discussions? and finally (4) To what extent are discussions on climate change triggered by specific events? The following sections will be grouped according to these sub-questions.How is climate change localised during the 2014 municipality elections in France?
Climate change is an inherently political affair; while individual people can make changes in their lives to accommodate for a lifestyle that leaves smaller footprints on the ecological health of the world, the problem we are facing is of such vast proportions, the consequences are so incredibly entangled on a global scale, that the real stage for action seems to be that of (international) politics. While the largest part of our research answers questions that relate to user engagement with the abstract topic of climate change, the municipality elections that took place in France on 23 March 2014 allow for an insight into the issuefication of climate change on a (local) political level that acts as a backdrop behind the comment analysis on Facebook that we will introduce in the next section. It is for this reason that we will present our findings for this part of the research before continuing with the method of the second part. For the occasion of the elections, the Reseau Action Climat[4] conducted interviews with political candidates in nine of the main cities of France. The interviews highlight different views on climate change and the way politicians address and take action against it. We compiled the interviews into city-specific lists to localise the types of concerns related to climate change across France. This means that politicians in one city from different parties were grouped to allow for the discovery of local concerns, rather than party concerns. Each list was subject to textual analysis: the climate change related words, such as vélos, bio, and jardins, were selected and counted within each city-sphere. Subsequently, these words were grouped into the categories Milieu, Place, Concept, Organisation, Object, Operation, and Political Action. This resulted in an overview of accumulated language usage as it differs between the cities in France answering the question what do politicians turn climate change into when they speak?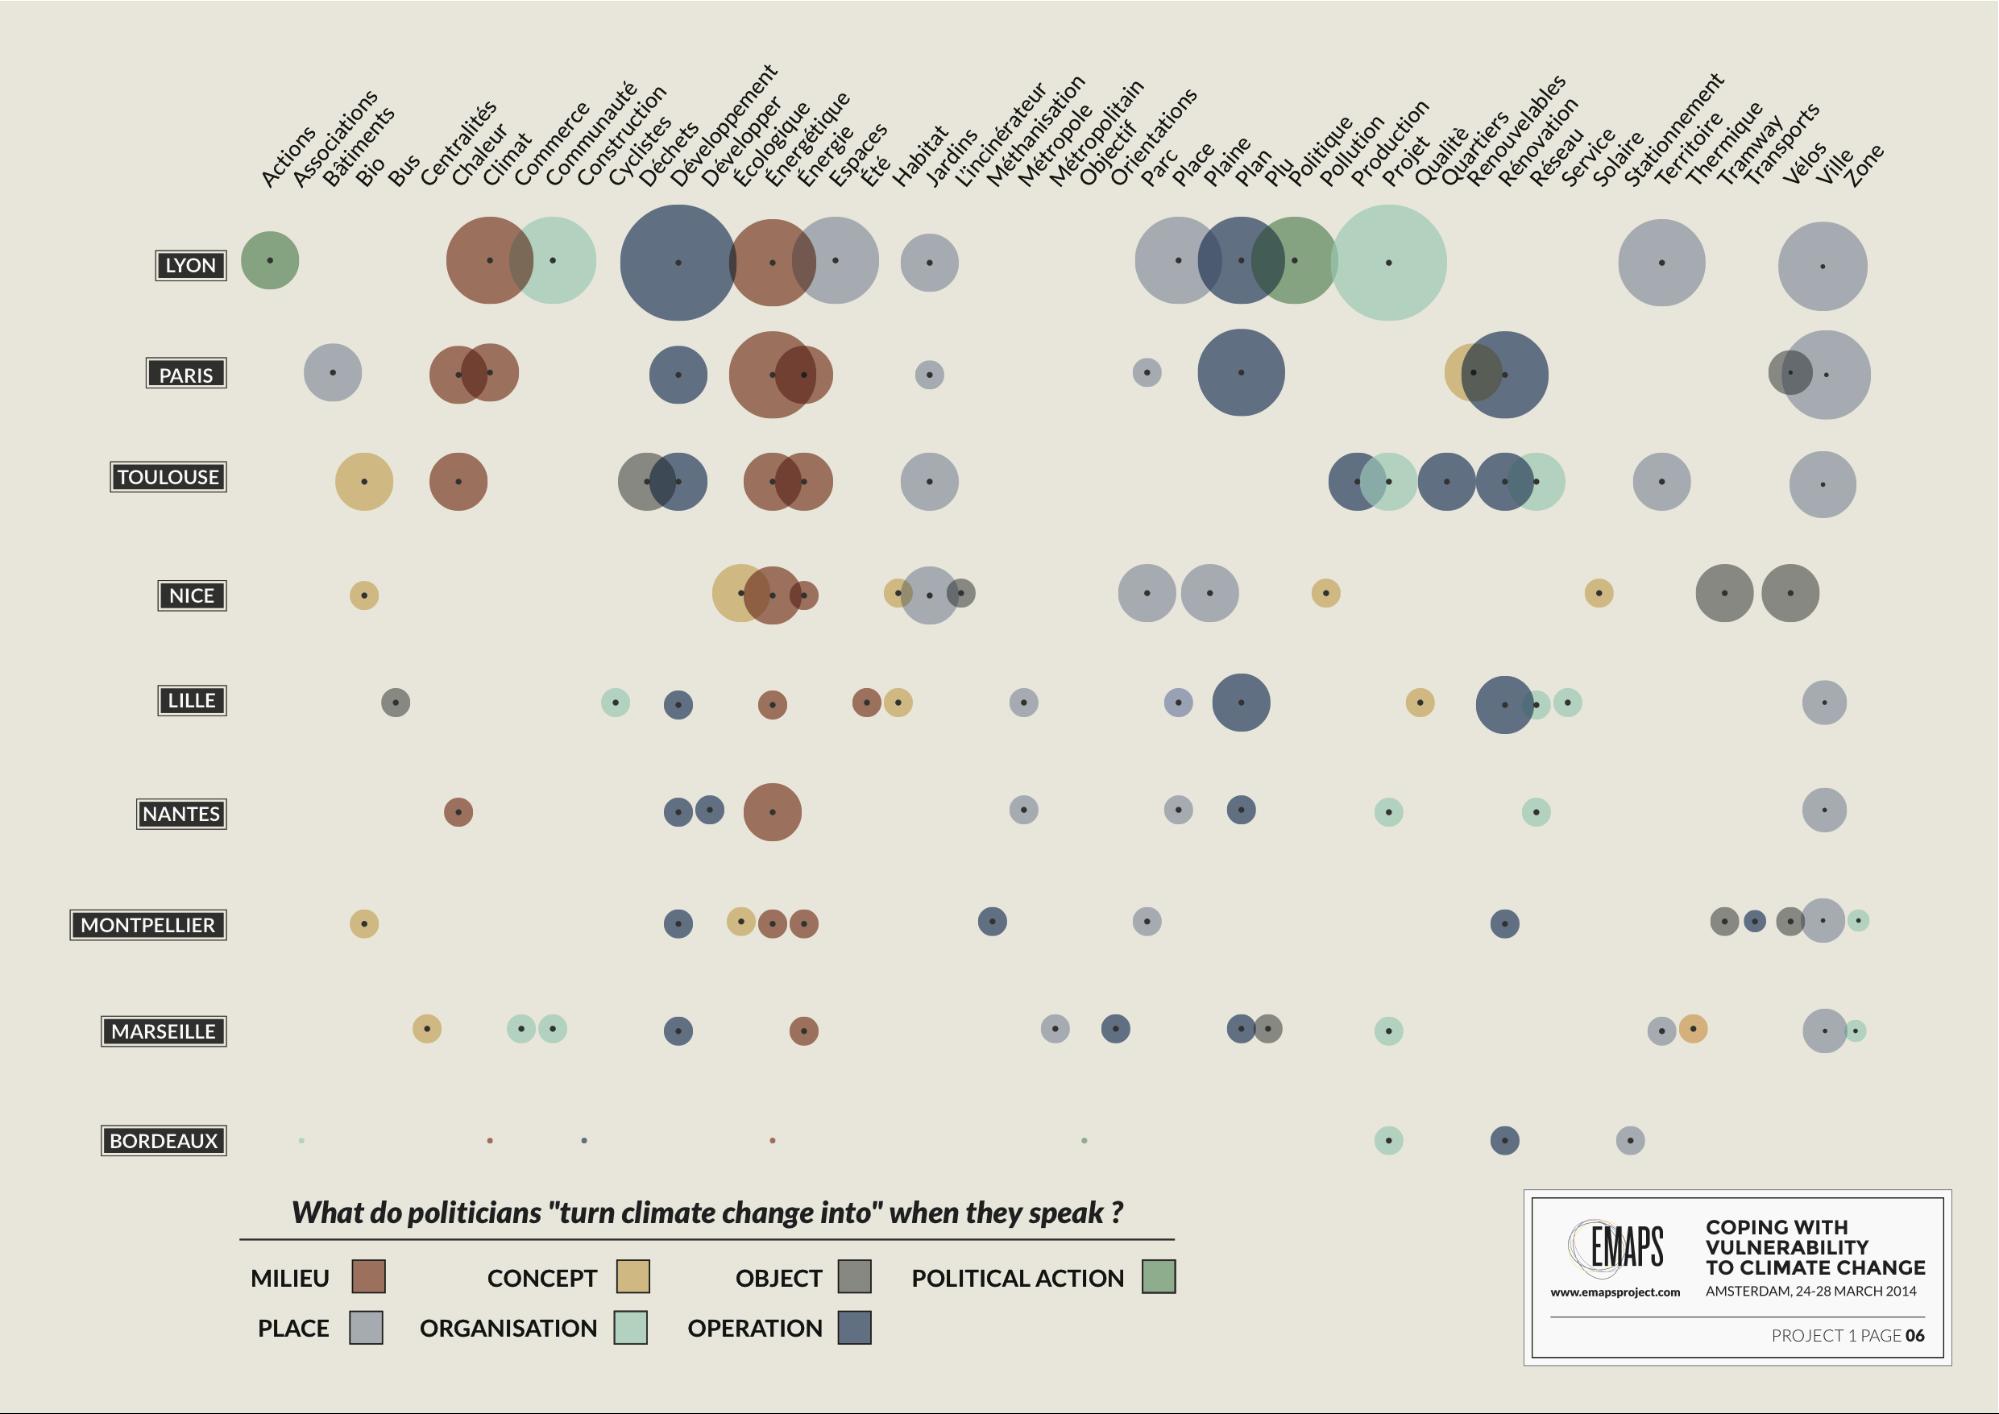
How are peoples responses to extreme weather events influenced by their proximity to the events?
The recent history of extreme weather in France
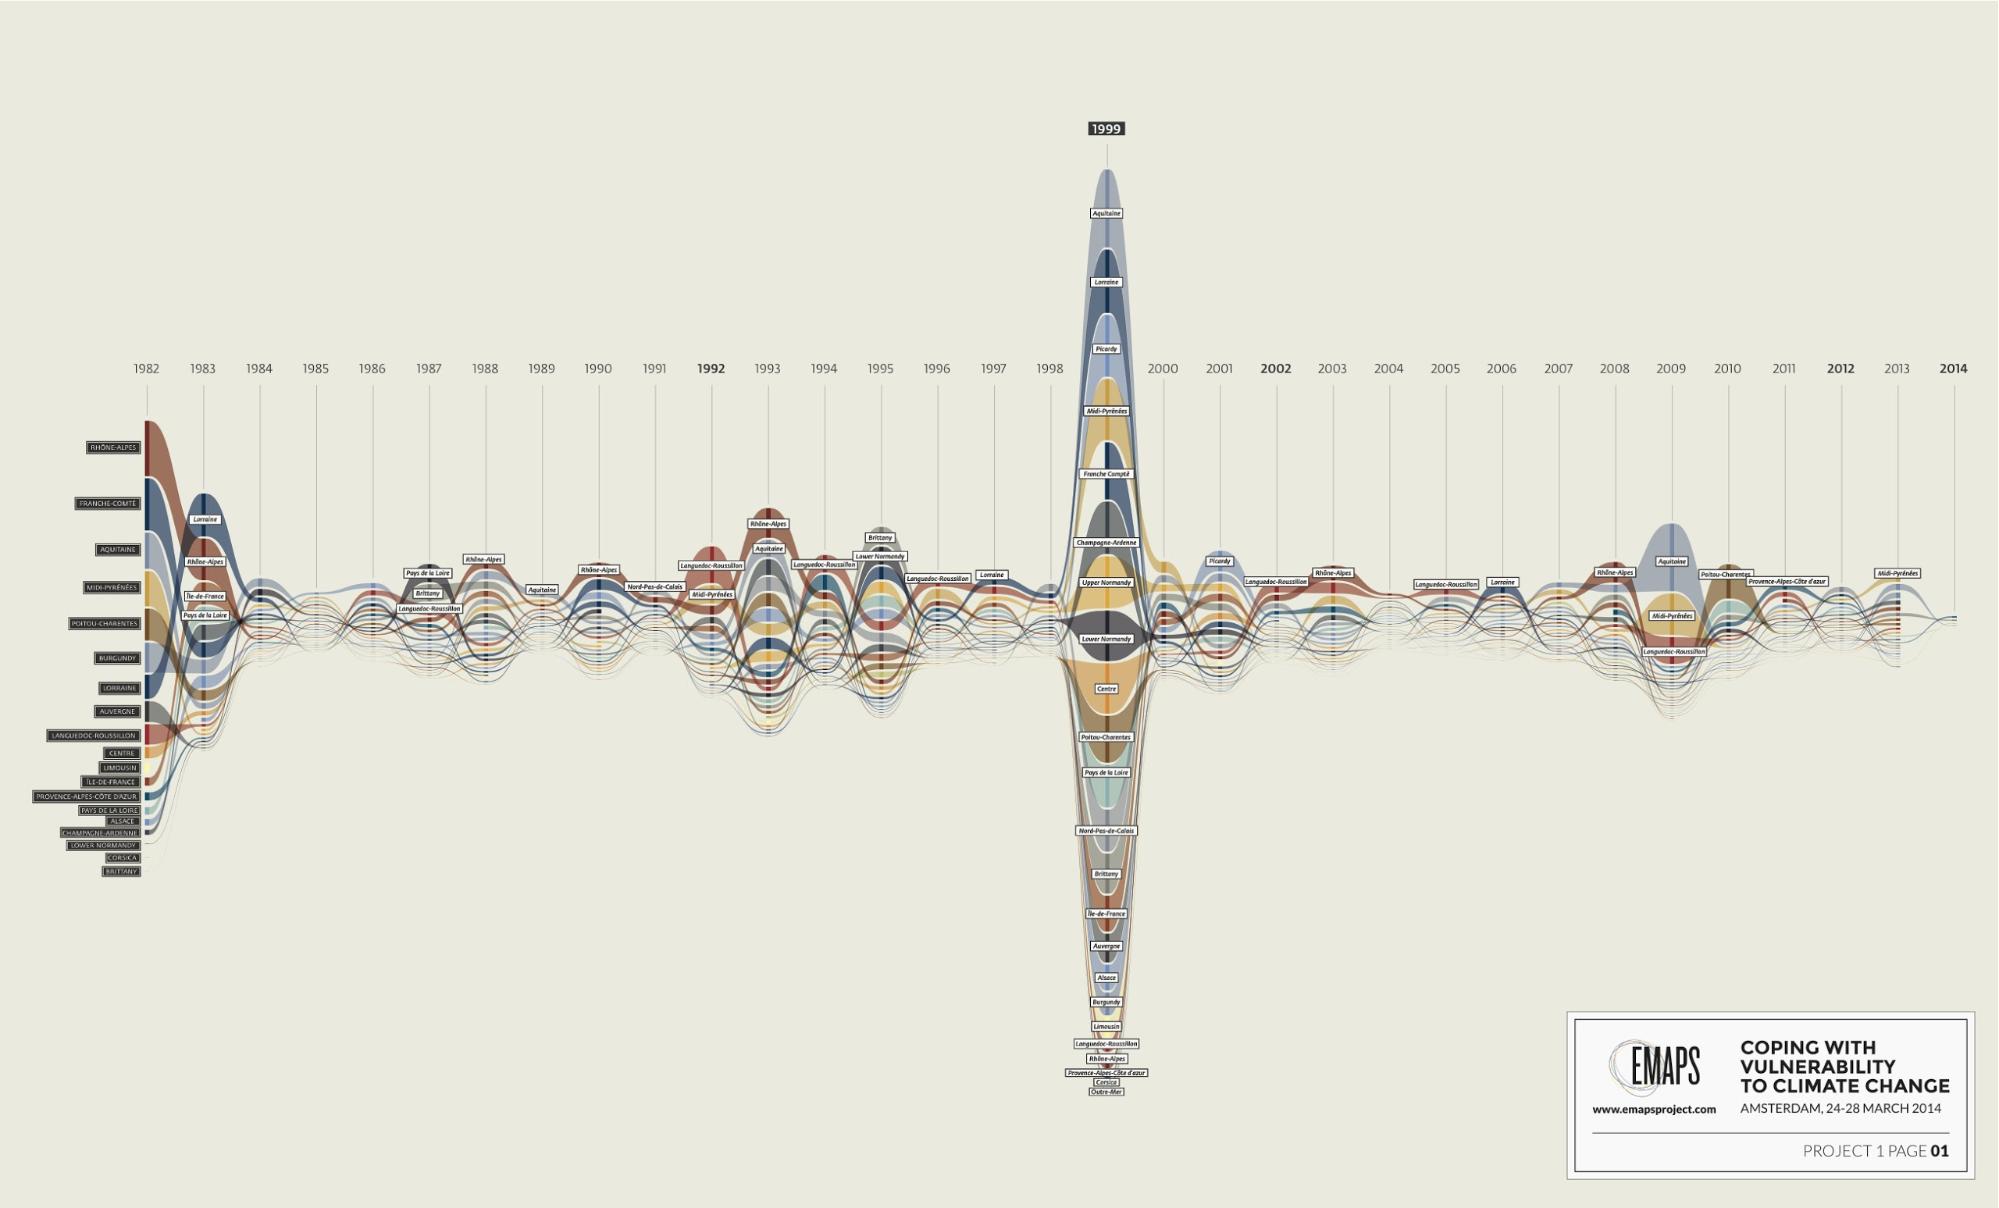
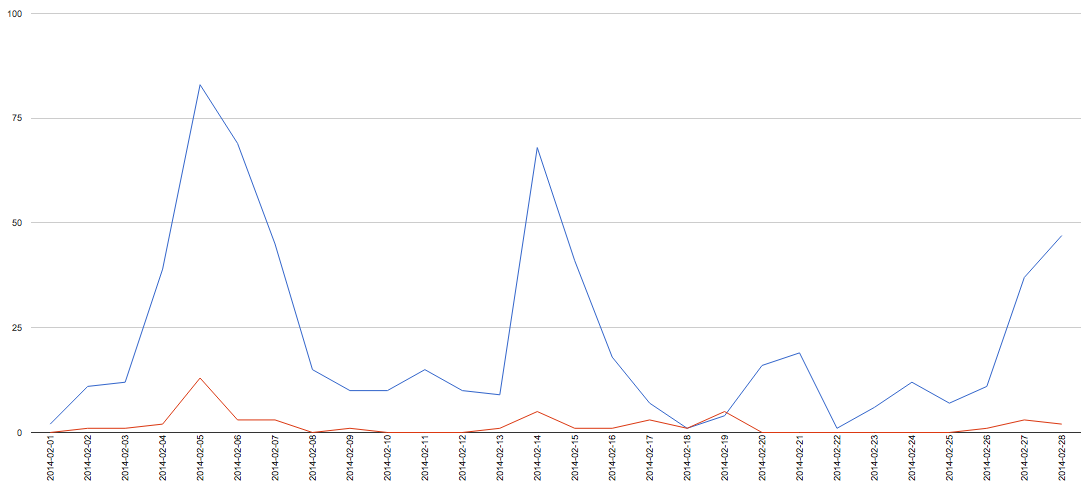
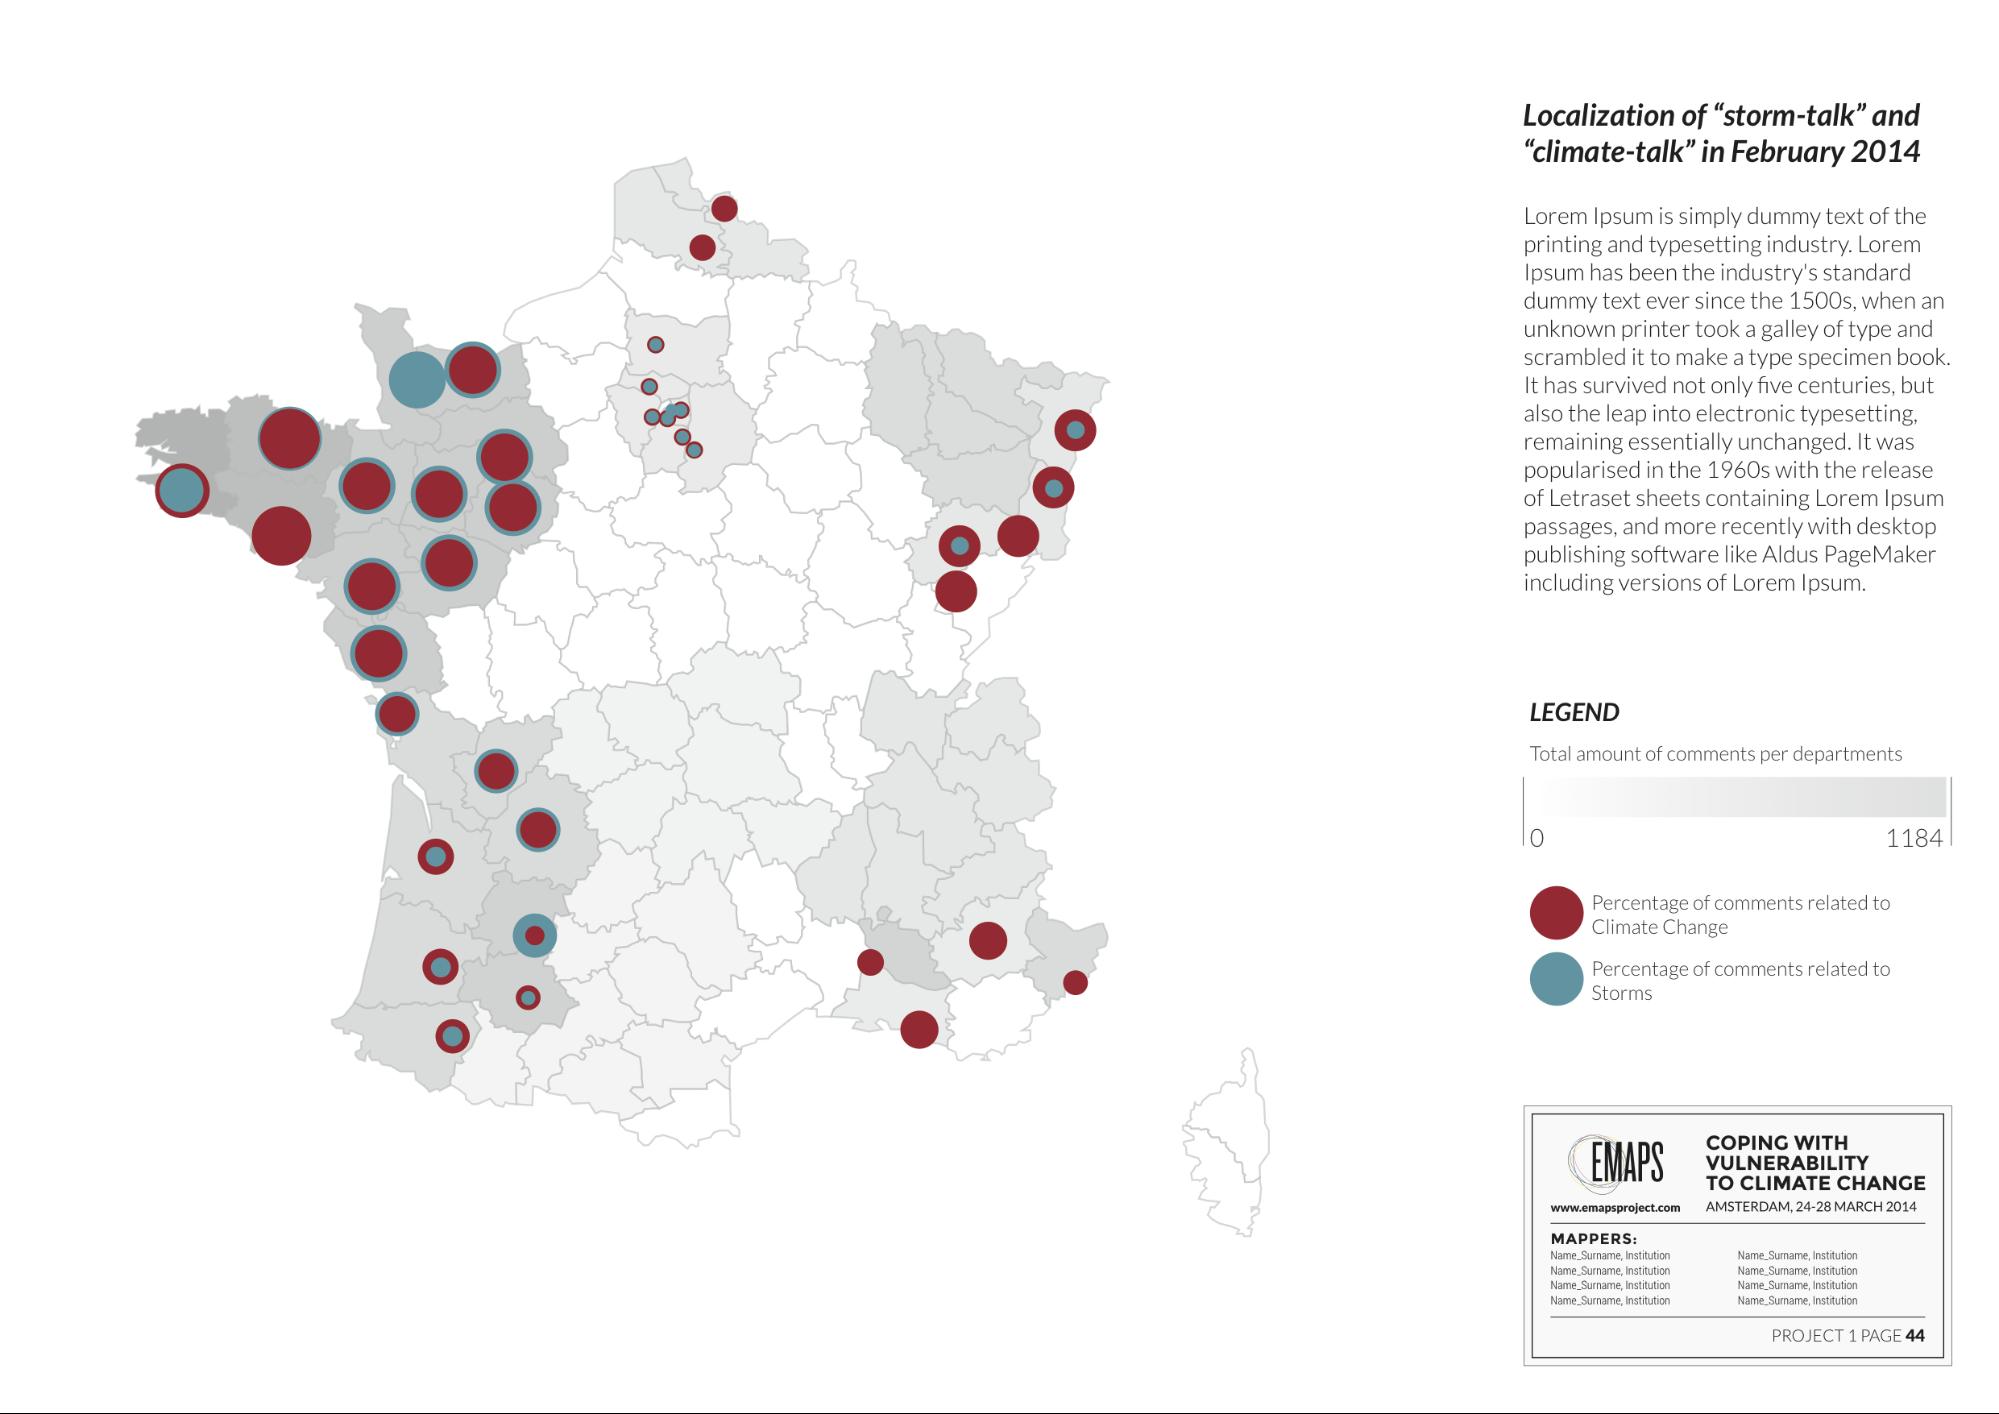
A last prerequisite before looking into the comments on news pages on Facebook is to understand the recent history of extreme weather events in France. To get a sense of the historical cases of extreme weather in different regions in France, we used the GASPAR database which contains data from 1982 on. GASPAR uses official claims to create a list of natural disasters and instances of extreme weather and categorises them according to their character. In our case, the database provides a reliable account of the weather situation in different parts of France during the two earliest months that are the subject of our research: February 15th 2010 to March 15th 2010 and September 2013. Although the GASPAR database is updated regularly, the data on February 2014, the most recent month subject to our project, was not available yet at the time of research. As the focus of our research was motivated by the storms on the Atlantic coast of France in February of 2014 (Garric), we took the Gaspar categories of phénomènes meteorologiques and the often related inondation as input to create a map of relevant events. The occurrences of these events were accumulated for each month and each département.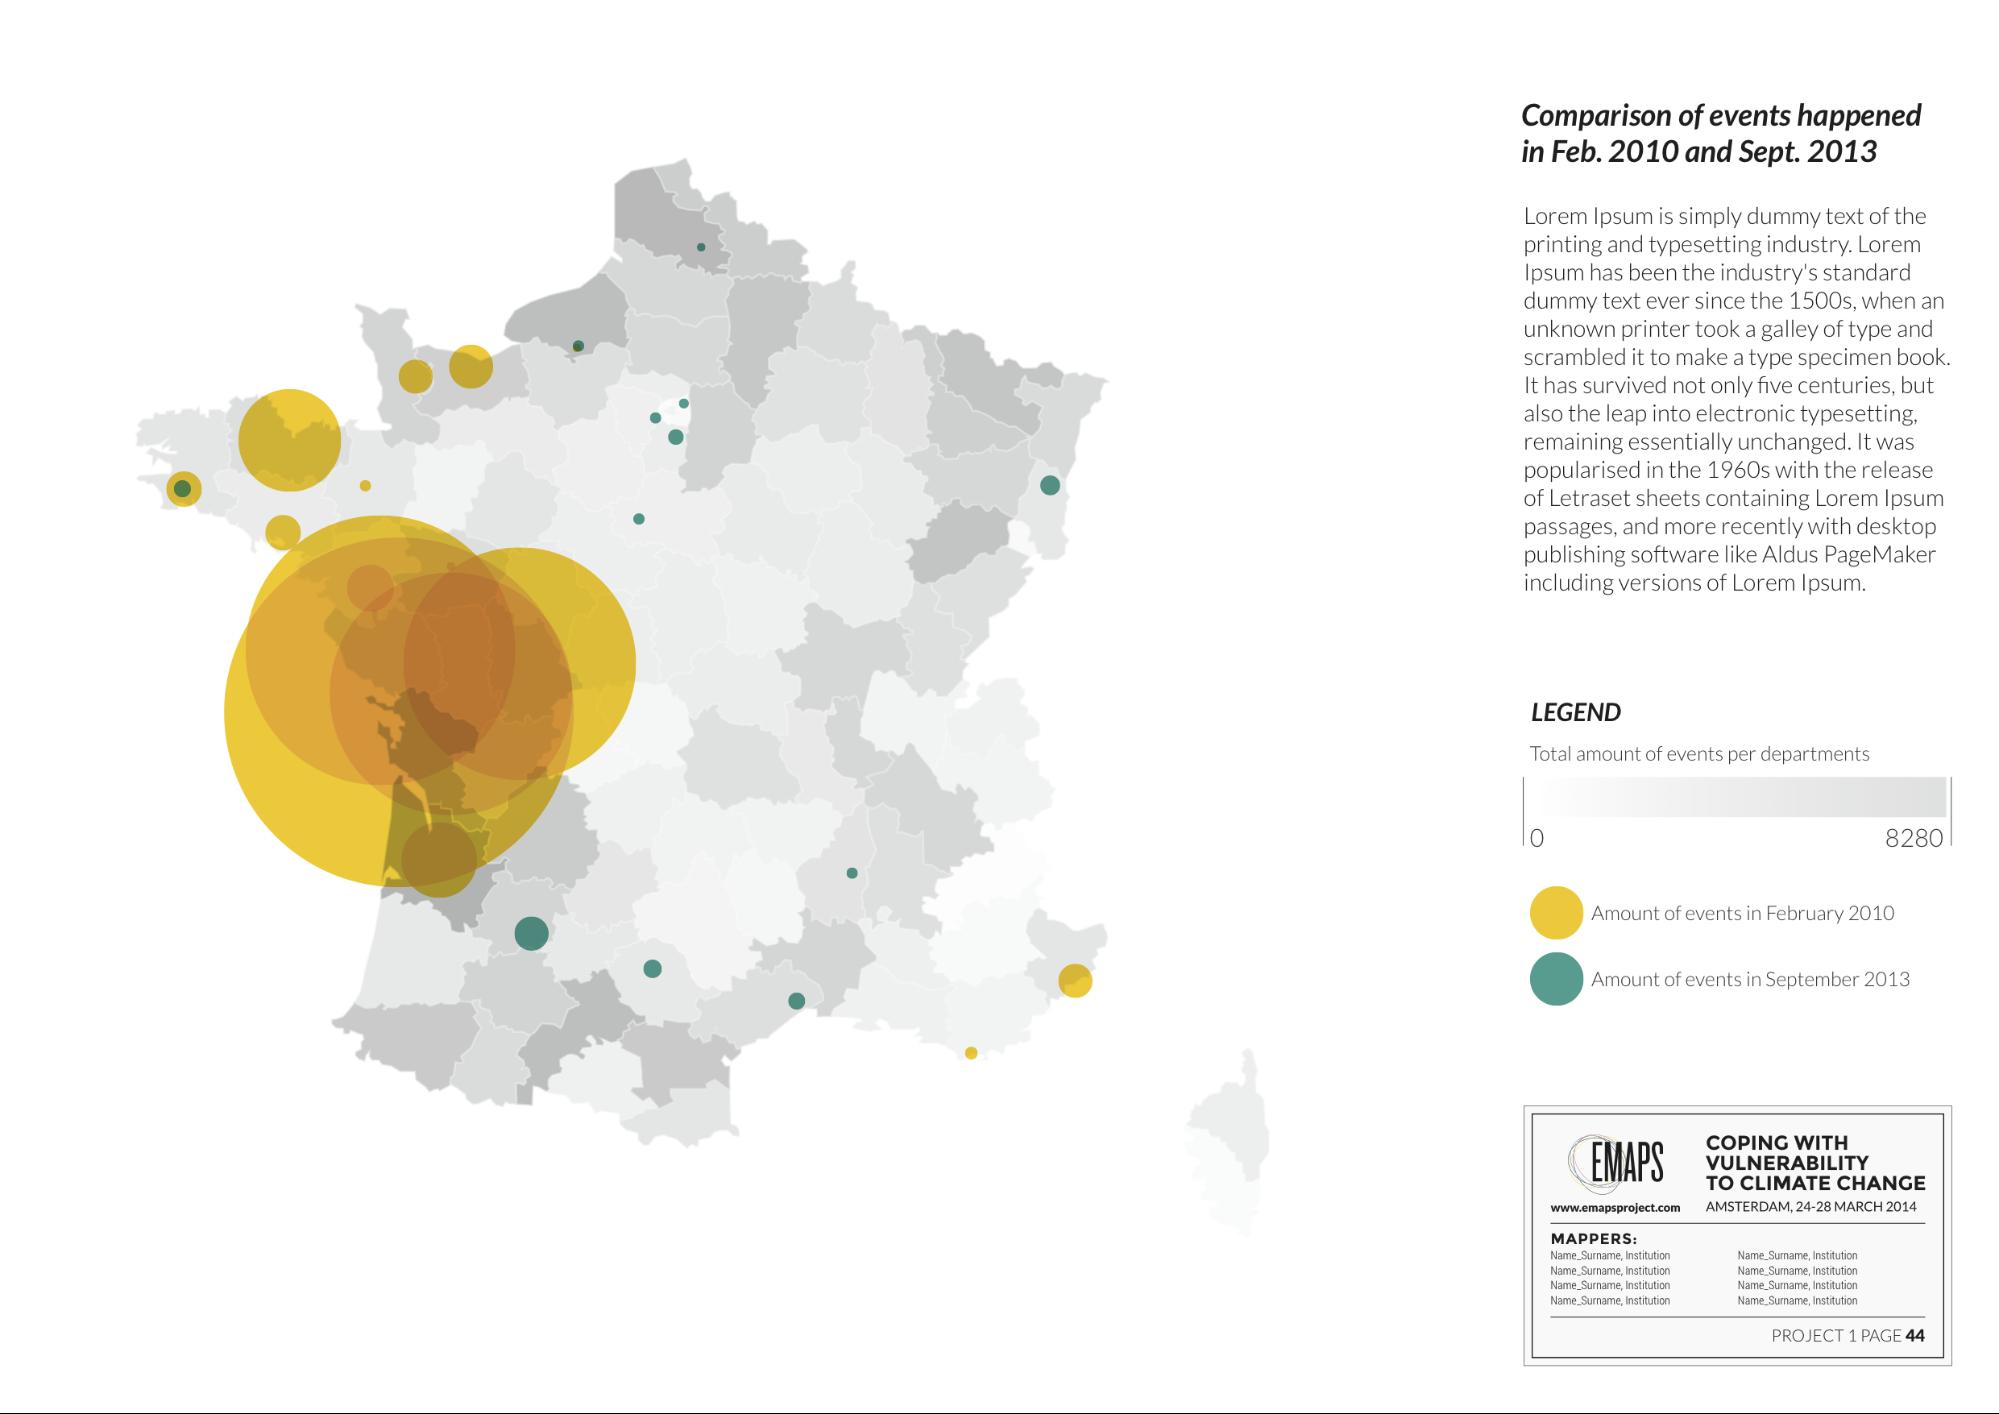
L ocating comments on Facebook newspaper pages in France
To understand if and how people relate storms and other concrete weather events to the more abstract notion of climate change, we looked at user comments on Facebook posts by French newspapers. Table 1 shows the list of national and local newspapers that were subject to our investigation. Although the local newspapers reach audiences across various regions in France, it is beyond the scope of this research to cover each département.| National newspapers | Local newspapers | Regions reached by local newspapers |
| Le Monde | Le Telegramme Brest | Finistère |
| Le Figaro | Le Telegramme Quimper | Finistère |
| Libération | SudOuest.fr | Charente, Charente-Maritime, Dordogne, Gers, Gironde, Landes, Lot-et-Garonne, Pyrénées-Atlantiques |
| Le point | Ouest France | Vendée, Sarthe, Orne, Morbihan, Mayenne, Manche, Maine-et-Loire, Loire-Atlantique, Ille-et-Vilaine, Finistère, Côtes-d'Armor, Calvados |
| L'express | Le Telegramme | Finistère, Morbihan, Côtes-d'Armor |
| Le nouvel Observateur | Le Dauphiné Libéré Grenoble | Ain, Hautes-Alpes, Ardèche, Drôme, Isère, Savoie, Haute-Savoie, Vaucluse |
| La Croix | La Montagne | Puy-de-Dôme, Allier, Corrèze, Cantal, Creuse, Haute-Loire, Haute-Vienne |
| 20 Minutes | La Voix du Nord | Nord, Pas-de-Calais |
| Rue89 | La Dépêche du Midi | Ariège, Aveyron, Haute-Garonne, Gers, Lot, Hautes-Pyrénées, Tarn, Tarn-et-Garonne, Lot-et-Garonne, l'Aude |
| L'Alsace | Haut-Rhin, Bas-Rhin, Territoire de Belfort, Doubs, Haute-Saône | |
| Le Parisien | Oise, Paris, Hauts-de-Seine, Seine-Saint-Denis, Val-de-Marne, Seine-et-Marne, Yvelines, Essonne, Val-d'Oise | |
| Nice-Matin | Alpes-Maritimes | |
| La Provence | Bouches-du-Rhône, Vaucluse, Alpes-de-Haute-Provence | |
| Le Républicain Lorrain Metz | Moselle, Meurthe-et-Moselle, Meuse, Vosges |
- [tempete]
- [climat OR rechauffement]
What are the differences in language usage between climate change discussions and extreme weather events discussions?
While the concern of the previous method was to localise the resonance of talk about storms and the climate, the method we will discuss in this section is aimed at facilitating a more textual analysis. The basic method of data collection is similar to the previous one; we queried the Comment Analysis tool with [tempete] and [climat OR rechauffement] to get two sets of data surrounding the two main concepts. The tool has a functionality that returns words that are used in close proximity to it. This is the basis for the following analyses. After looking at the lists of words that the tool created with this functionality, we decided on four categories to group the words into: Weather, Climate, (Inter)national/Politics, and Personal/Local. Figure 9 maps the most frequently used relevant words for each dataset grouped according to these categories. The most striking difference between the two data sets is the size of the Personal/Local and (Inter)national/Political categories. While the stormtalk comments, on the right side of the map, are dominated by personal and local words like dégats, courage, and espoir, the climatetalk side of the map is dominated by international and political words like gouvernement, négociation, and responsabilité. It has to be noted that a part of the words in this category are irrelevant: they relate to the political situation in the Ukraine, and were included in this data set because of the usage of terms like climat politique. Notably, the climatetalk data set only contains one weather related word, while this category is the second biggest in the stormtalk dataset.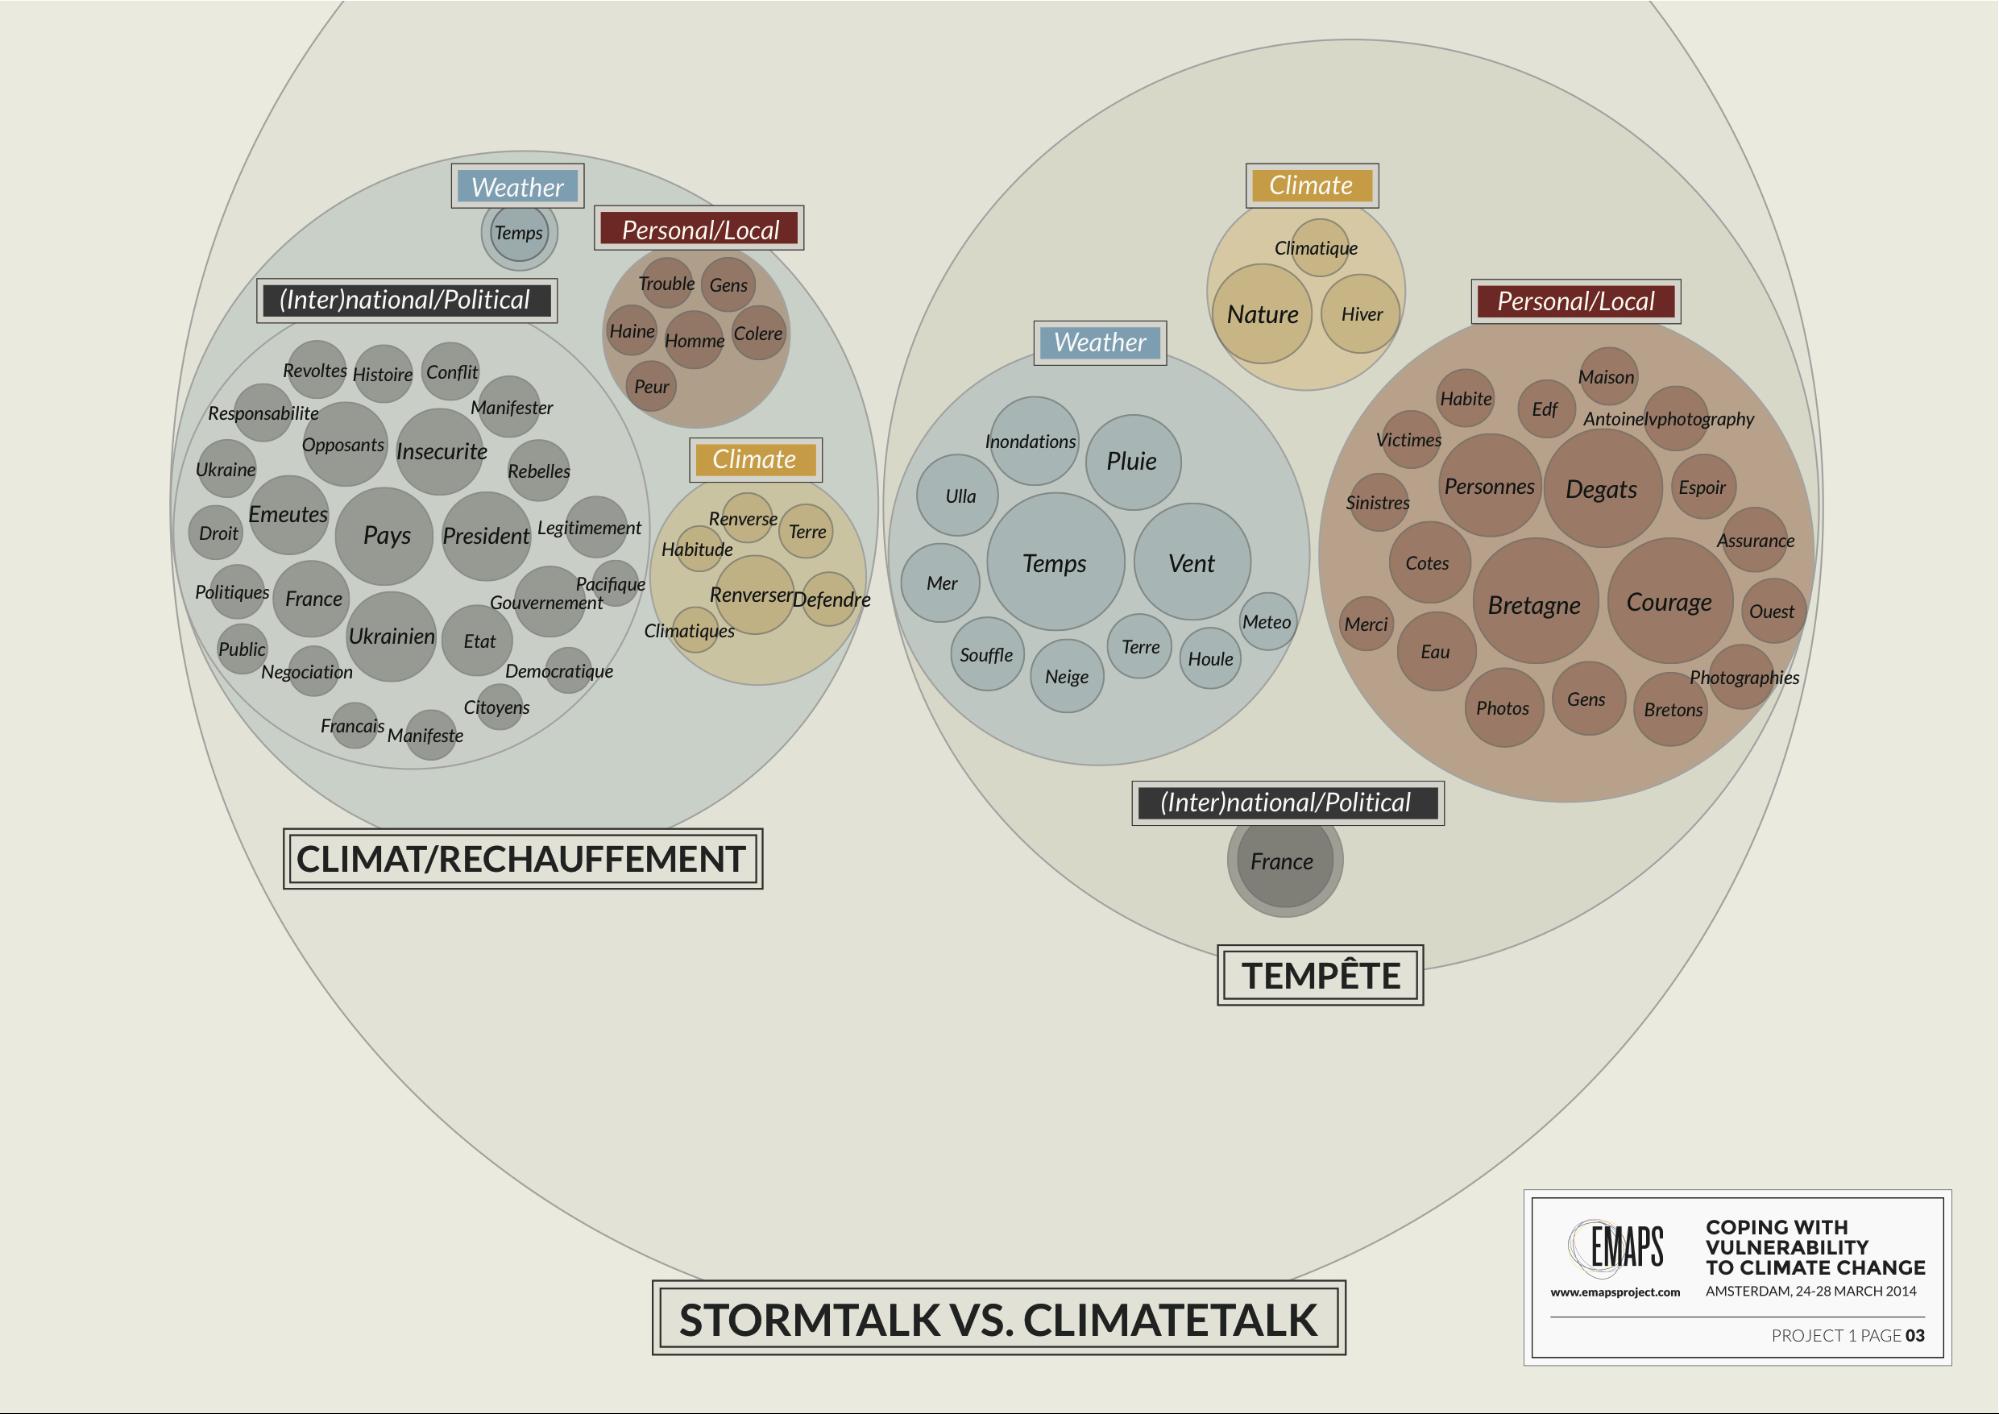
To what extent are discussions on climate change triggered by specific events?
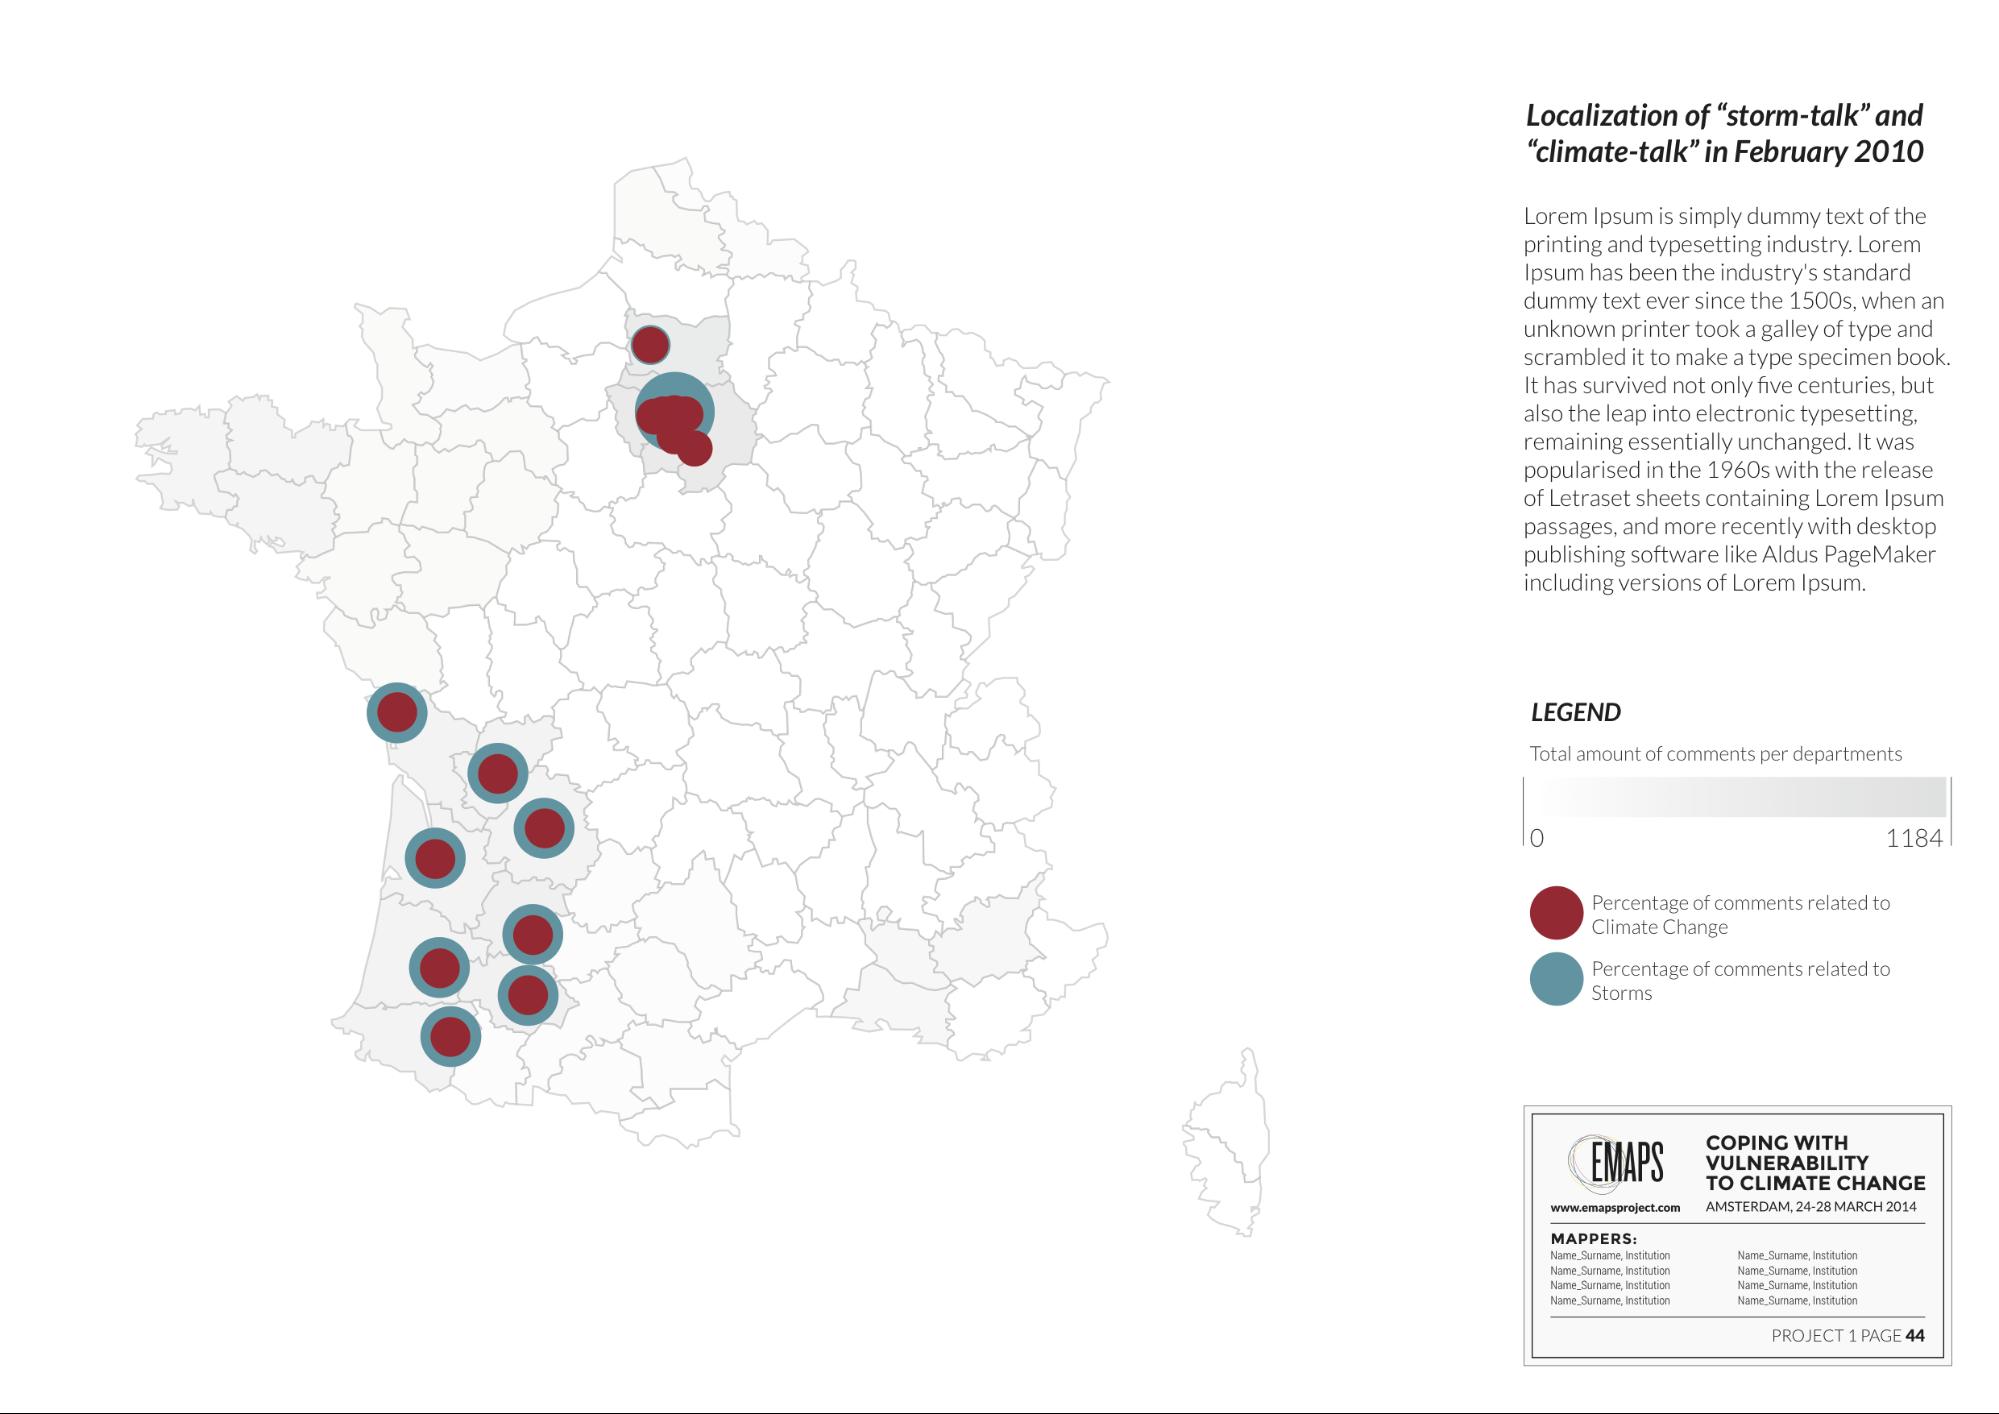
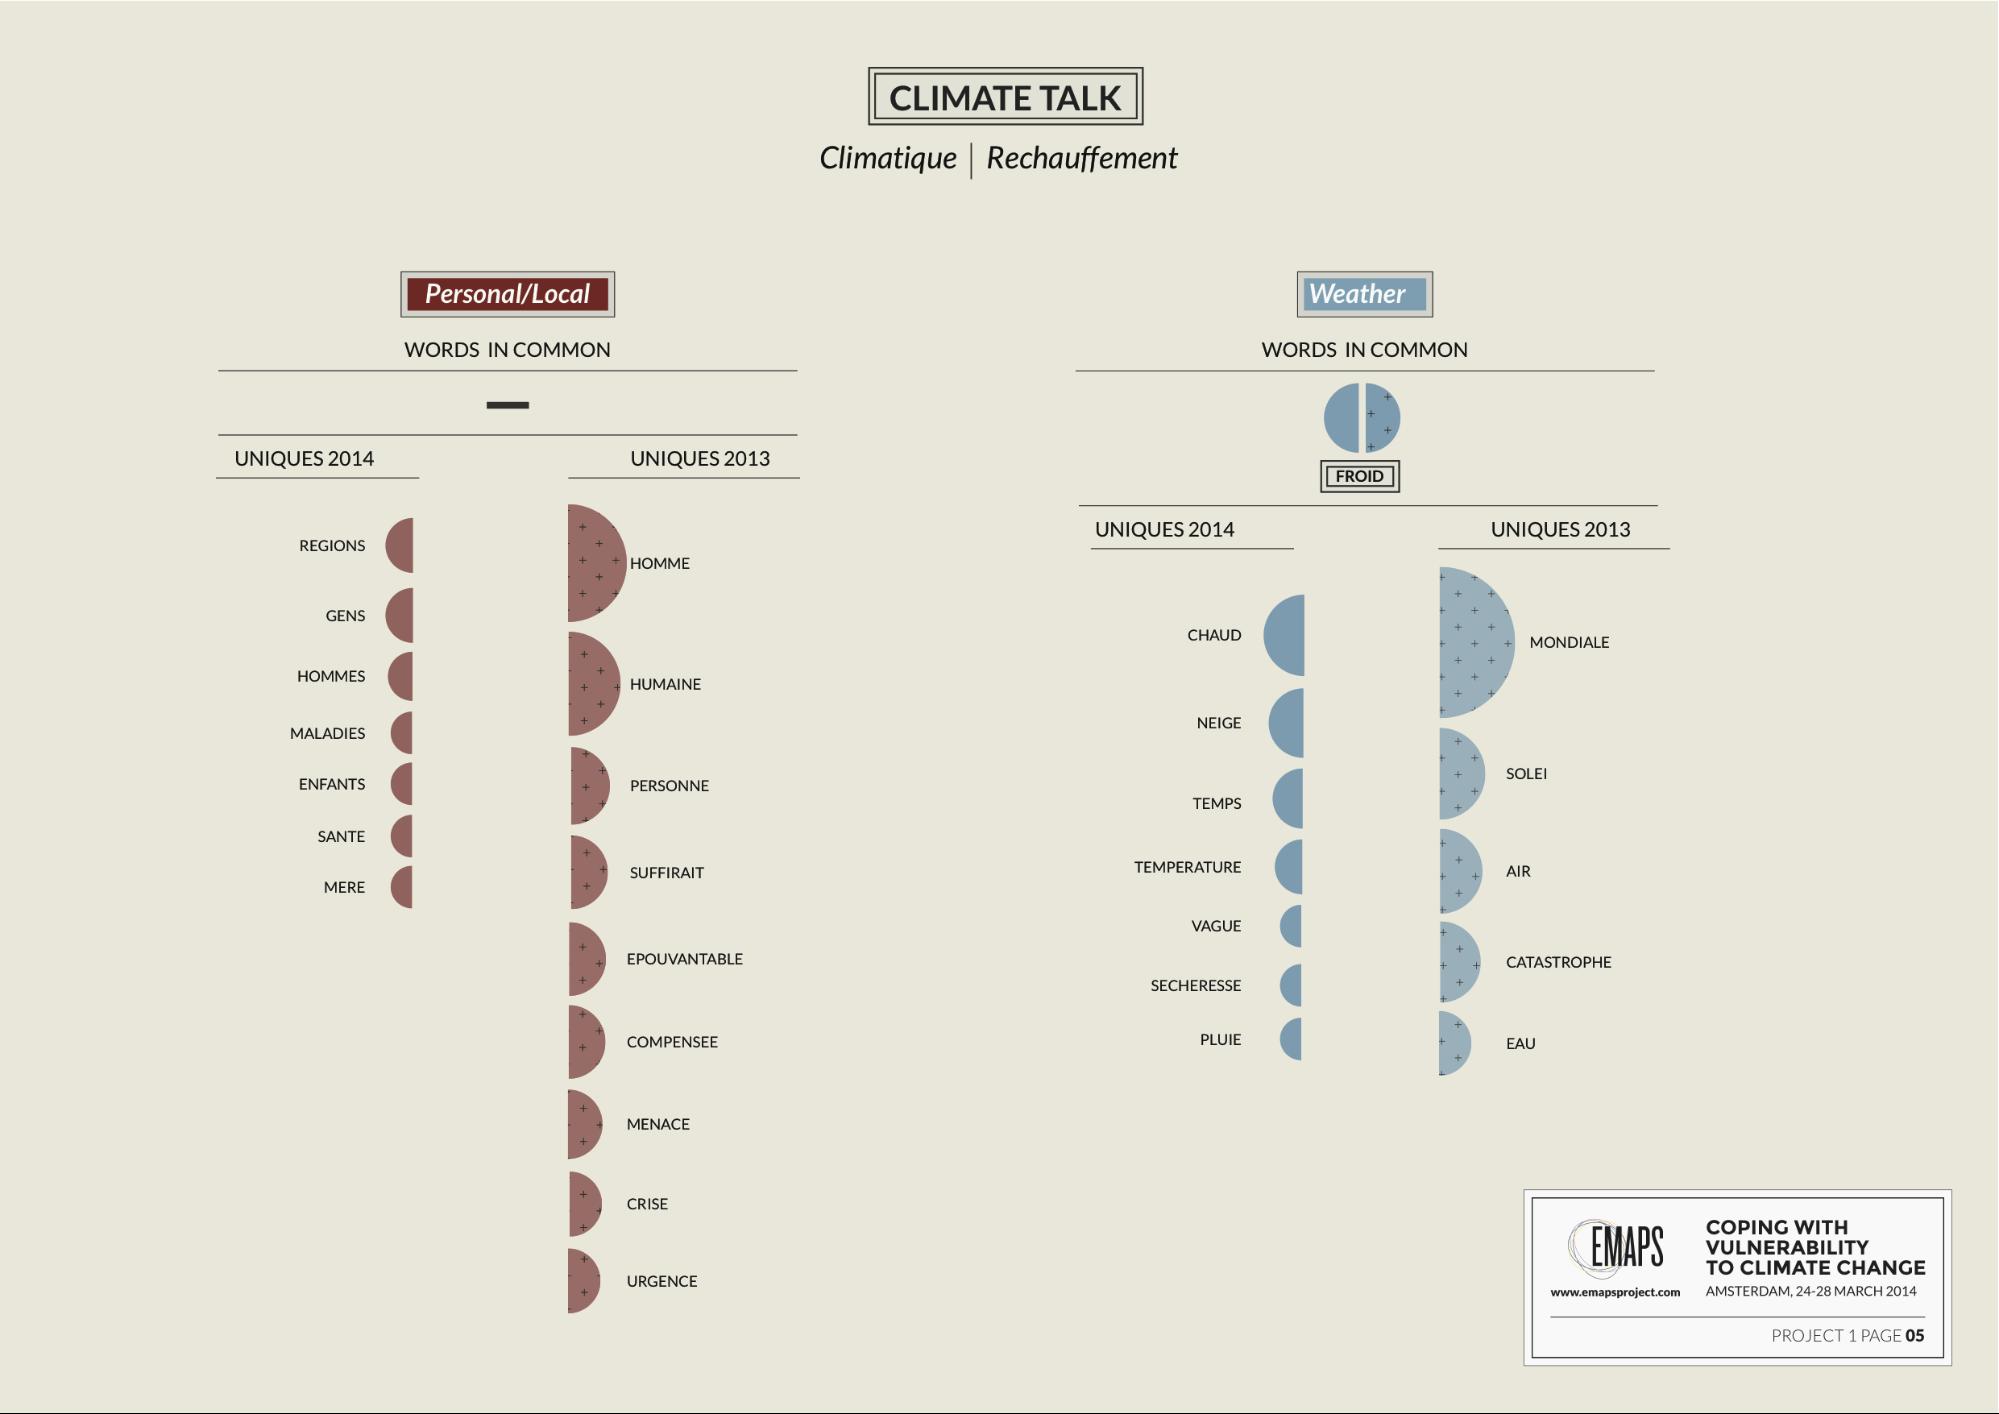
The next map shifts our focus from stormtalk to climatetalk. The map shows the shared and unique words that occur in the climatetalk of September 2013 and February 2014 in the national news sphere. These words and their frequency were again gathered using the Comment Analysis tool, this time only querying [climatique OR rechauffement]. This query was slightly changed from climat to climatique to lose the overrepresentation of the Ukraine in the earlier dataset. The map in figure 11 and 12 shows the overwhelming presence of unique words. Only five words are shared between the two time frames in all categories combined. This indicates that discussions on climate change do not consist of a large base conversation. The individual words indicate that the conversation is driven by the influence of particular events, such as the publication of the IPCC report or explorations in outer space. The Climate category within this climatetalk map has the largest number of individual words and can thus be seen as the most discussed subtopic.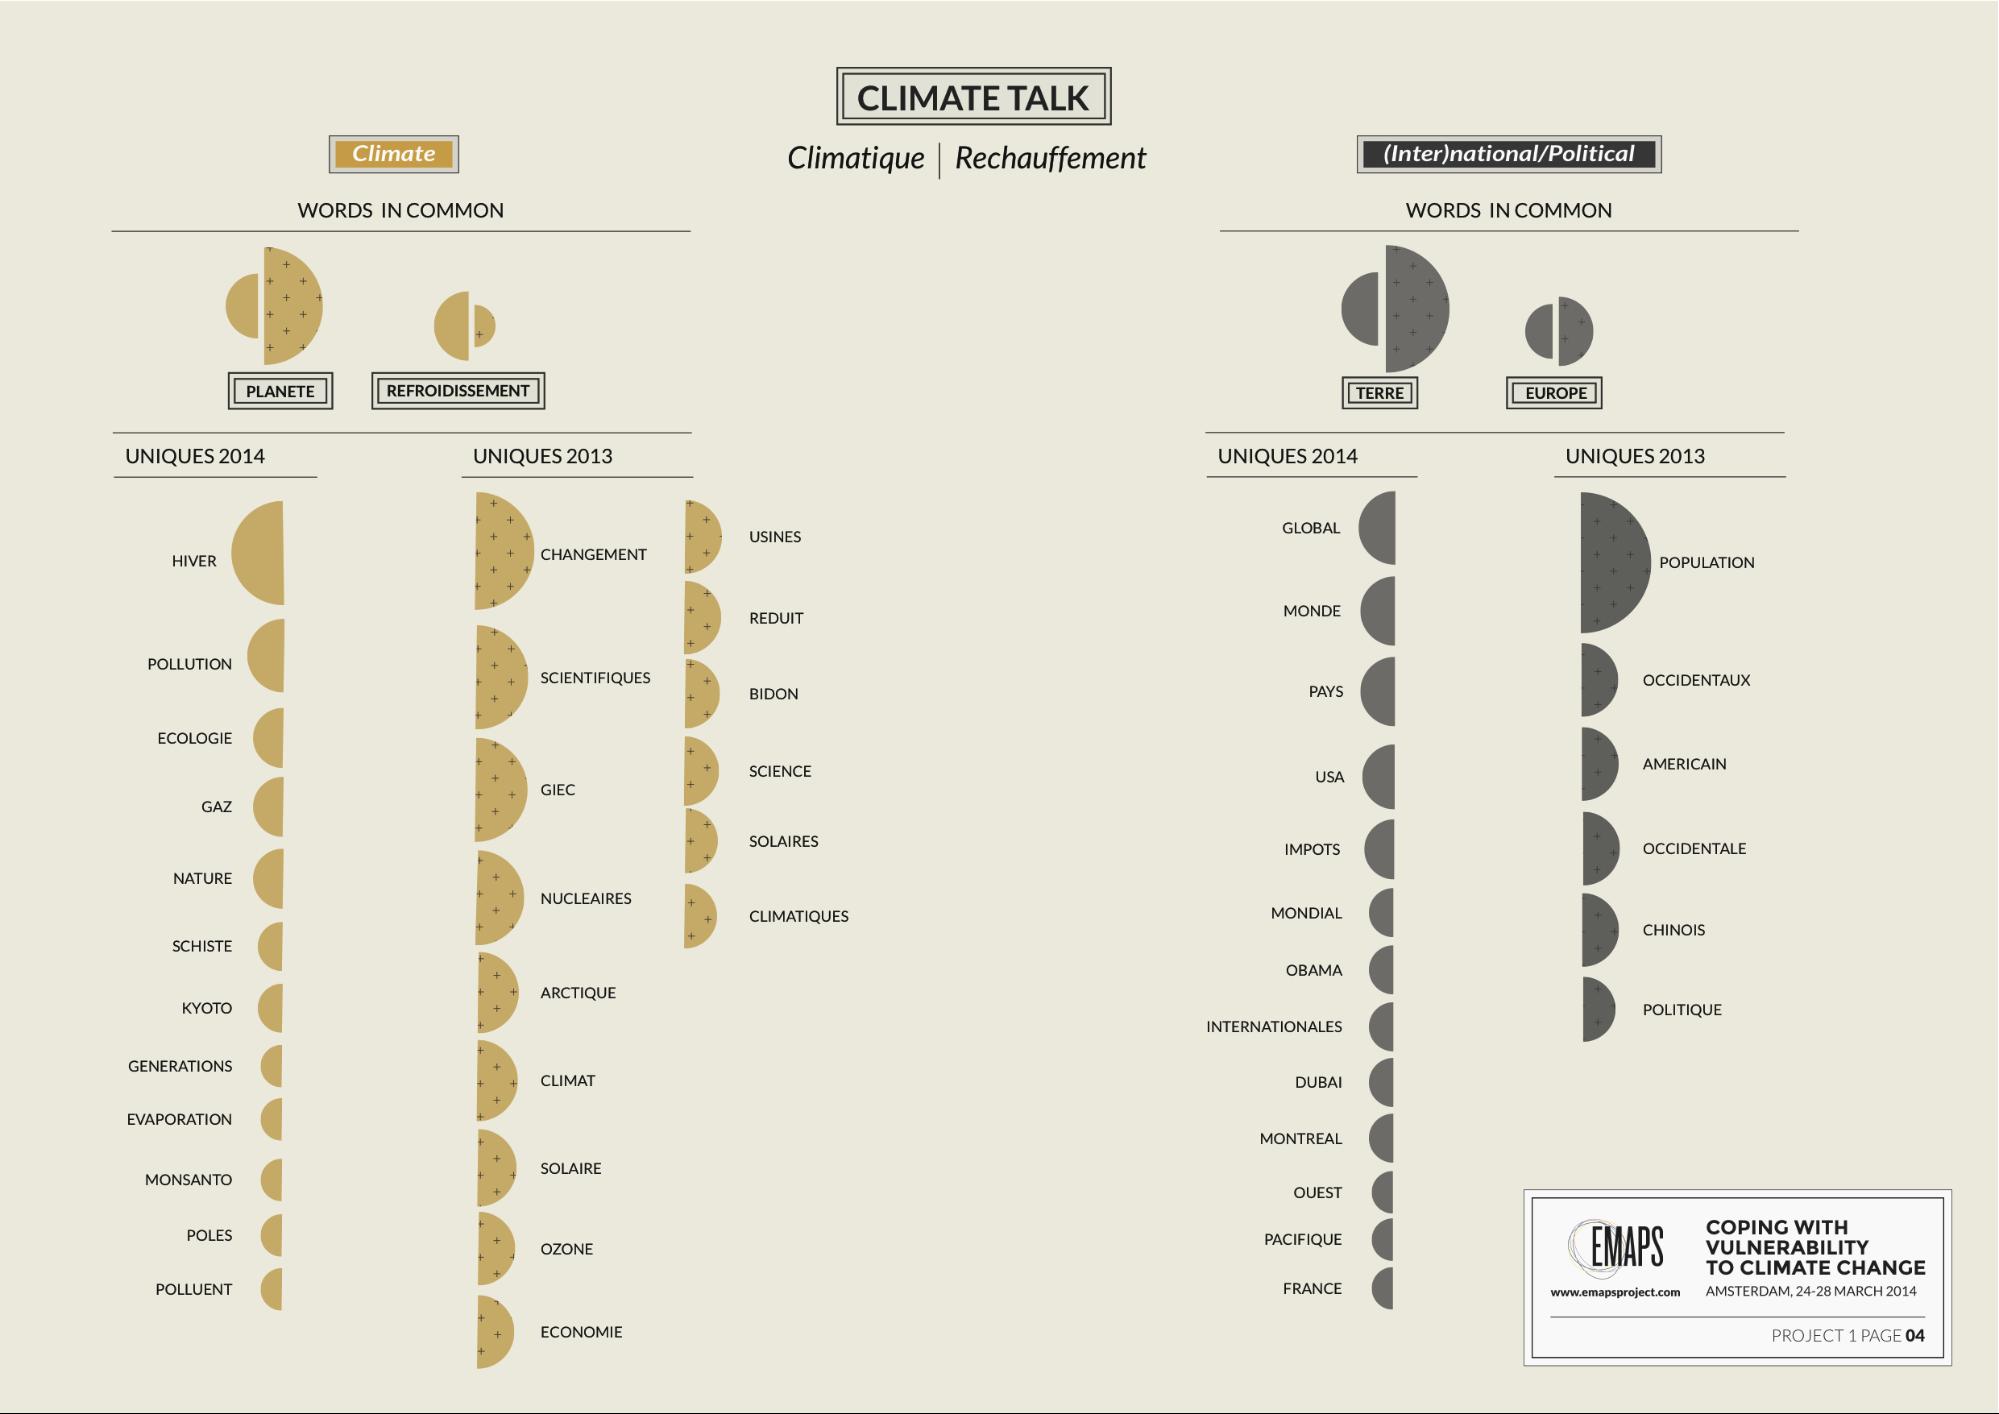
Discussion
In this project, we examined climate change discourses used by political candidates of municipality elections in 2014. Additionally, we attempted to analyse the perception of vulnerability to climate change when exposed to natural disasters. By examining stormtalk and climatetalk in the comments posted on Facebook pages of national and local newspapers we found a way to look at this perception of vulnerability. The words chosen by politicians illustrate that climate change is conceptualised in a highly localised manner. Although some words are shared between many of the cities, none are shared across the board. Even more telling is the amount of words that is shared only between a small number of cities, or in fact is unique to one specific city. Another way of interpreting this localised manner of speaking about climate change is by looking at the types of words used. While the category of Concepts is among the least used, the highly local category of Places is among the most used. This insight into the political conceptualisation of climate change as a local concern proves interesting when looking at how Facebook users deal with the topic. Our initial hypothesis, which assumed that the natural catastrophes increase the discussions about climate change was indeed falsified by our research. The findings indicate that people do not necessarily link natural catastrophes to climate change; climatetalk was stable across an eventful and a quiet month, and climatetalk was relatively more present in regions that were not affected directly by the natural catastrophes than in those that were. Through our textual analysis of climatetalk and stormtalk we found there is a great difference in language usage between the two; while climatetalk uses more words related to large, abstract concepts like international politics and the climate, stormtalk uses more words that are personal, local, and directly weather related. This indicates that in fact, the two discussions are not intrinsically linked or interconnected. Extreme weather events do not cause affected people to express feelings of being more vulnerable to climate change. When zooming in on climatetalk, we found out that the language differs greatly between two months. This leads us to the conclusion that the discussion is not ongoing, but rather triggered by events. The nature of these events do not strictly have to be related to climate change or extreme weather, as the discussion in September 2013 illustrates. In this research project we focused on a specific type of natural event, namely storms, to understand whether there is an established link between occurrences of extreme weather and occurrences of discussions on climate change. While we could not find a clear link between climatetalk and stormtalk, it is possible that other types of natural catastrophes do trigger conversations about climate change. As our inquiry only focussed on this specific weather event, it is not possible to claim that natural catastrophes do not have any effect on climate change perception or discussion. To be able to analyse the relation between natural catastrophes and climate change perception more extensively, the question of whether other types of natural catastrophes trigger climate change talk should be explored in future research. Secondly, as our data set for the issuefication of climate change among politicians consisted of one database of interviews, it is certainly feasible and interesting to extend the methods we used to a larger data set. Future research in this direction could answer questions related to political perceptions of climate change, and comparisons between this and the perceptions of the public or action groups.Bibliography
Adger, W. Neil. "Vulnerability." Global environmental change 16.3 (2006): 268-281. Article 1: Definitions.United Nations Framework on Climate Change.Web. 31 March 2014. < http://unfccc.int/essential_background/convention/background/items/2536.php.>. Barnett, Jon, Simon Lambert, and Ian Fry. "The hazards of indicators: insights from the environmental vulnerability index." Annals of the Association of American Geographers 98.1 (2008): 102-119. Beck, Ulrich. World at risk. Polity, 2009. [.....]. The Digital Freedom Risk: too fragile an acknowledgment. Open Democracy Accessed on 04 Apr. 2014. < http://www.opendemocracy.net/can-europe-make-it/ulrich-beck/digital-freedom-risk-too-fragile-acknowledgment>. Birkmann, Jorn. "Indicators and criteria for measuring vulnerability: Theoretical bases and requirements." Measuring vulnerability to natural hazards: Towards disaster resilient societies (2006): 55-77. Burck, Jan, Franziska Marten and Christoph Bals. The Climate Change Performance Index. Germanwatch.org. Germanwatch and CAN Europe, 2014. Web. 04 Apr. 2014. < https://germanwatch.org/en/download/8599.pdf>. Cutter, Susan L. The vulnerability of science and the science of vulnerability. Annals of the Association of American Geographers 93.1 (2003): 1-12. Davies, Lizzy. "Fatal Storm Sweeps through France." Theguardian.com. Guardian News and Media, 28 Feb. 2010. Web. 31 Mar. 2014. < http://www.theguardian.com/world/2010/feb/28/gale-force-winds-sweep-france>. Eakin, Hallie, and Amy Lynd Luers. Assessing the Vulnerability of Social-Environmental Systems. The Annual Review of Environment and Resources. 31 (2006): 365-394. Eriksen, S. H., and P. Mick Kelly. "Developing credible vulnerability indicators for climate adaptation policy assessment." Mitigation and Adaptation Strategies for Global Change 12.4 (2007): 495-524. Fifth Assessment Report. IPCC-Intergovernmental Panel on Climate Change. Web. 31 March 2014. < http://www.ipcc.ch/report/ar5/index.shtml>. Füssel, Hans-Martin. "How inequitable is the global distribution of responsibility, capability, and vulnerability to climate change: A comprehensive indicator-based assessment." Global Environmental Change 20.4 (2010): 597-611. Garric, Audrey. "Tempêtes, Pluie Et Chaleur: L'hiver De Tous Les Records En France." Le Monde.fr. Le Monde.fr, 04 Mar. 2014. Web. 31 Mar. 2014. < [http://www.lemonde.fr/planete/article/2014/03/04/tempetes-pluie-et-chaleur-l-hiver-de-tous-les-records-en-france_4377153_3244.html]]>. Klein, Richard JT, and Annett Möhner. "The political dimension of vulnerability: implications for the Green Climate Fund." IDS Bulletin 42.3 (2011): 15-22. "ND-GAIN Index." ND-GAIN Index. Notre Dame Global Adaptation Index, n.d. Web. 04 Apr. 2014. < http://index.gain.org/>. "Objectives." EMAPS. EMAPS, 2012. Web. 01 Apr. 2014. < http://www.emapsproject.com/blog/objectives>. Rieder, Bernhard. Studying Facebook via Data Extraction: The Netvizz Application. University of Amsterdam. (2013): 1-10. Storms Death Toll Rises. BBC.co.uk. B BC. 29 Dec. 1999. Web. 31 Mar. 2014. < http://news.bbc.co.uk/2/hi/europe/581564.stm>.[1] Information on the Gaspar database can be found at: http://macommune.prim.net/gaspar/visualisation.php [2] Netvizz is a tool that allows the user to gain insight into (user interaction with and organisation on) Facebook. The tool can be found at: https://apps.facebook.com/netvizz/?fb_source=search&ref=ts&fref=ts [3] The Comment Analysis tool, also built by Bernhard Rieder, allows the user to query Netvizz files and gives overviews of the resonance of that query over time. The tool can be found at: https://tools.digitalmethods.net/netvizz/facebook/netvizz/commentsearch/search.php [4] The Reseau Action Climat is the French association concerned with the action taken by various other actors to counter climate change. Their homepage can be found at: http://www.rac-f.org/. The interviews used in our research can be found here: http://www.rac-f.org/Elections-municipales-2014.
This topic: Dmi > VulnerabilityClimateChange > EmapsAmsterdamSprint2014Project2StormtalkSituatingAdaptationAndVulnerabilityWithSocialMedia
Topic revision: 11 Apr 2014, InteGloerich
Topic revision: 11 Apr 2014, InteGloerich
Ideas, requests, problems regarding Foswiki? Send feedback