Display of Urban Health Lifestyles on Instagram - What is considered healthy where?
Team Members
Jonathan Albright, University of Auckland; Stefano Bandera, University of Bologna; Robert Gutounig, University of Applied Sciences Graz; Daniël Landman, University of Amsterdam; Lisa Langenkamp, University of Amsterdam; Bjarke Osmundsen, IT University of Copenhagen.
Keywords
Instagram, Instagram scraper, Gephi, secondary cities, Image Plot, health movements, food trends, urban, Pinterest.Introduction
The original project idea was to study food choices on secondary social media. Our reseach interest was to find out whether healthy food choices are shown and whether commercial interests can be located. What health choices are shown there? Are these private, commercial or do they show issue-based interests? And can any influences or patterns be found? Our focus was on display of food choices, so our first approach was to study the hitherto understudied platform Pinterest. The limitations of the Pinterest API, however, forced us to focus our research on another important image platform. We chose to emphasize the perception of healthiness on Instagram only and to characterize the kind of health dispayed there. Instagram is highly relevant, also because 20% of global internet users between ages 16-64 have an Instagram account (expandedramblings.com/index.php/important-instagram-stats).
The Instagram Scraper proved to be one of our main tools to get the data from. To narrow down our research, we chose to pay attention to different locations and compare them. The general topic of this years Summer School being secondary social media, led us to the idea of emphasizing secondary cities. The choice of secondary cities was subsequently done on basis of language expertises among the team members and Wikipedias list of secondary cities. The cities that were chosen to do research on are: Rotterdam, Utrecht, Denver, Graz and Aarhus and Milan. We thought it would be good to include the two Dutch cities, Rotterdam and Utrecht, to see whether there are interesting findings when it comes to one country as well as comparing the countries together as a whole.Research Questions
-
What constitutes health on Instagram for the home citiesof our group members?
-
Is there a difference in the perception of health amongst these cities?
-
Can new health movements (e.g. food) be defined by analysing the health related Instagram posts?
Methodology
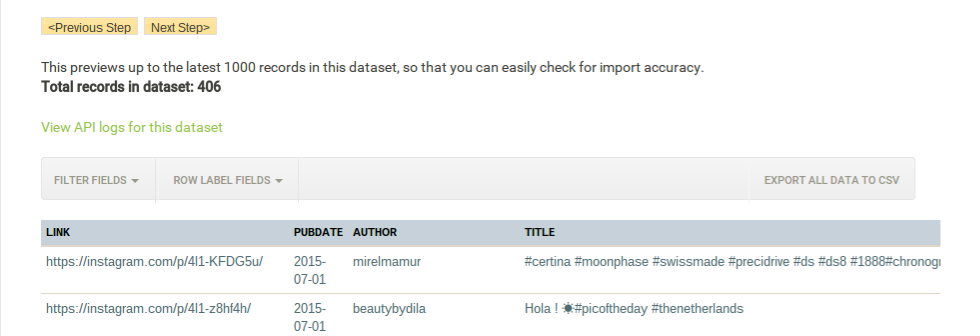
The Instagram Scraper allowed us to get data from a specific geographical location. The coordinates of the cities were retrieved by using the Geo Coordinates Tool of the Harvard University. We set the radius to 5.000 metres, the maximum amount of posts was 10.000 for each city. In the end we had 60.000 posts collected. Instagram videos were included in the dataset, but were not used in the analysis itself (excluded from dataset).
-
Once we got the data for all of the cities with the Instagram Scraper, we imported the CSV files in Google Spreadsheets.
-
For each city we made a frequency count of all the hashtags and selected manually individually the ones that are health related.
-
Then we looked at how far from the top health related hashtags occur and we coded them. This allowed us to filter health related hashtags in order of occurance.
-
The health related hashtags were put in a separate sheet, which we discussed all together to agree on them applying a triangulation process within the group (e.g. coffee or wine were excluded for example because they do not appear to be healthy).
-
To see how health oriented the city is, we calculated the proportion of health related tags for all cities in respect to the total number of hashtags used.
-
Afterwards, we characterized the kind of health for each city. Is it more focussed on food or fitness for example?
Netlytic also allowed us to scrape data from a specific location, however it took too much time to reach a thousand posts per city. We also had some problems with the geolocation when using the Instagram Scraper; Milan for example (another city of one of the groupmembers) gave us a lot of duplicates. Therefore, we had to exclude this city from our analysis after trying multiple times.
Visualizations
We visualized the data for each city in Gephi. We deleted the city- and countrynames (and frequently used variations), as it doesnt give us much information on whats going on in the city. In order to visualize the look of health, we used ImagePlot.
Findings
The frequency lists showed us how popular health related hashtags or posts are when it comes to using Instagram and what is posted on Instagram in general. Even more interesting for our research is to see what exactly is being posted about health for each of the cities. It appeared that #eatclean is the most popular food trend at the moment for Aarhus, Denver and Graz. In Utrecht and Rotterdam #vegan is most popular.
| City | Most popular food trend | Most popular food item hashtag | Most popular fitness hashtag |
| Aarhus | eatclean | sushi | fitfam |
| Denver | eatclean | freshwater | fitness |
| Graz | eatclean | smoothie | fitness |
| Rotterdam | vegan | strawberry | fitness |
| Utrecht | vegan | chicken | fitness |
Table 1. Most popular health related hashtags on Instagram for Aarhus, Denver, Graz, Rotterdam and Utrecht.
The following figure shows an overall display of the the top health related hashtags for each city:
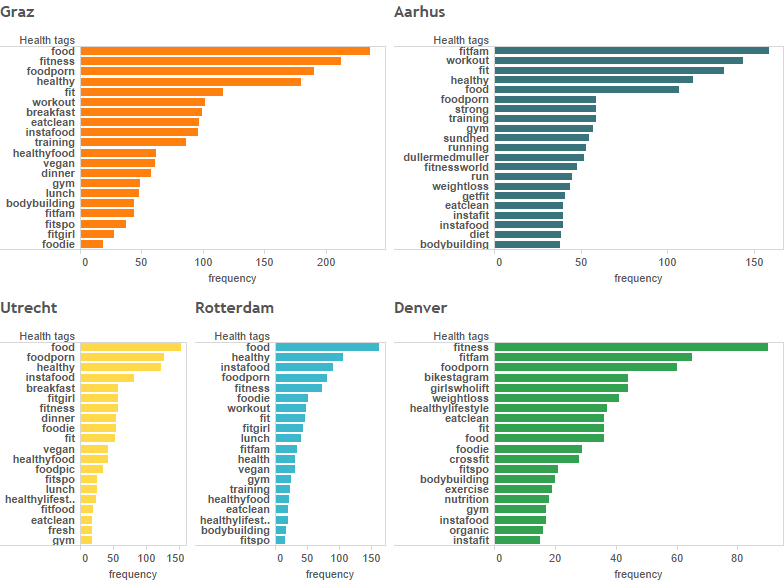
Figure 2. Top health related hashtags for Aarhus, Denver, Graz, Rotterdam and Utrecht.
In Gephi we could see different clusters of health related posts and get a feeling of what is considered healthy in a specific city when we looked closer at the health cluster. To give an example, the following is a display of the health cluster of Utrecht - this is what weve done for all of the cities.
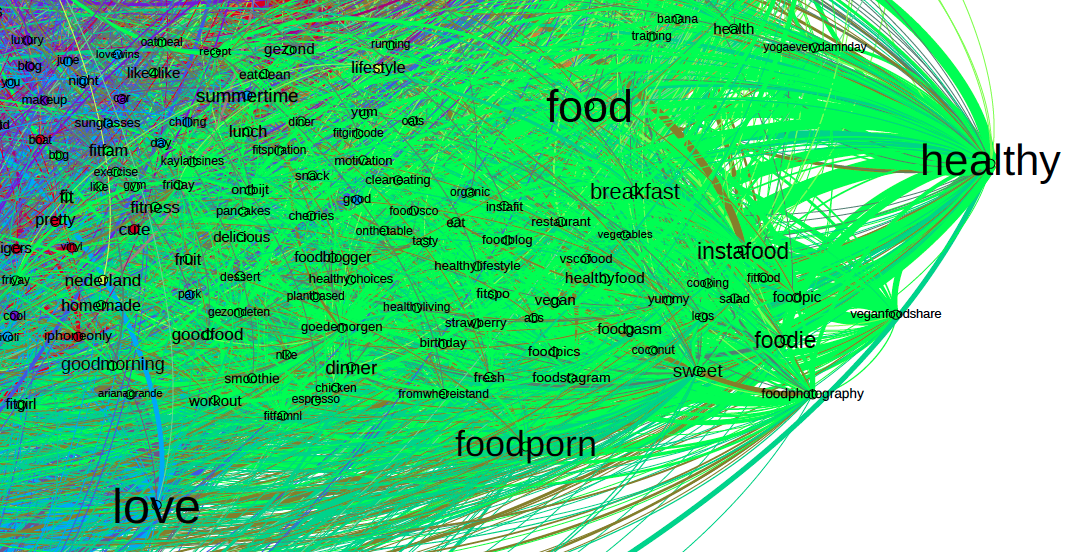
Figure 3. Utrecht health cluster.
With Image Plot, we tried different outputs (brightness versus saturation/brightness versus hue/saturation versus hue). The one which compares the saturation and hue of the photos seemed to give the most interesting results.
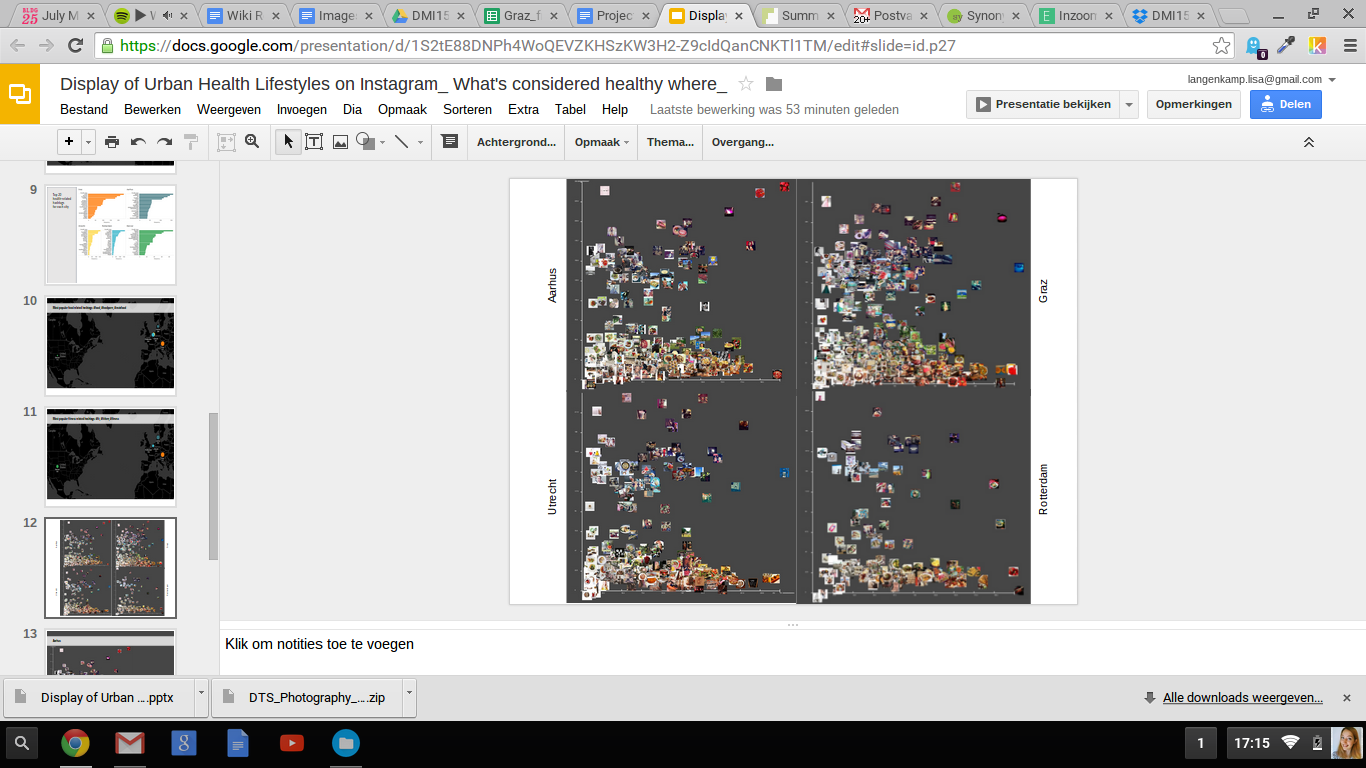
Figure 4. Image Plot of health related posts, Y = saturation and X = hue.
Conclusions/Discussion
Without necessarily making the scraper look for keywords that concern health, health clusters were automatically formed while putting the output in Gephi; we only used Instagram posts based on the location. That on itself is already a result and might emphasize on a general basis that Instagram is the right place to see how much people are concerned with their health. Also it seemed that some cities are more focussed on sport/physical oriented health lifestyle (e.g. Aarhus, Denver) instead of food oriented health lifestyle (Graz, Utrecht, Rotterdam) (fig. 2). This gives the impression that there are different interpretations of health among these cities. Regarding health in respect to food movements we found a distinction between utrecht and Rotterdam (vegan)and all the other analyzed cities (eatclean) (tab. 1). This indicates related, but still distinct perception regarding food habits.
Unfortunately we couldnt use the Milan dataset because of duplicates. Besides that, it was remarkable to see that the Instagram posts from Milan most of the times didnt include hashtags, whereas it was more of an execption for other cities when hashtags werent included in the post.
View presentationFurther Research
Whereas our research consists of a set time, it might be interesting to do research on health related Instagram posts over time to see where new health movements occur and how they spread over the years. Furthermore, the ImagePlot tool can be useful to expose the way health has been portrayed by Instagram users over time and what techniques and ways of photographing health lifestyle have become popular.
With the scraper tool developed for Pinterest in the future it would be interesting to compare Instagram and Pinterest regarding the way that people use these platforms and to find out how displays of health lifestyles differ, e.g. through the influence of commercial interests.
Bibliography
By the Numbers: 150+ interesting Instagram Statistics (July 2015). http://expandedramblings.com/index.php/important-instagram-stats/ (last retrieved 14th July 2015).
Rogers, Richard. What constitutes Digital Methods. Cambridge: The MIT Press, 2013.
Secondary City. Wikipedia: https://en.wikipedia.org/wiki/Secondary_city (last retrieved 13th July 2015).
Topic revision: 15 Jul 2015, gutounig
Ideas, requests, problems regarding Foswiki? Send feedback