You are here: Foswiki>Dmi Web>WinterSchool2018>WinterSchool2018MappingDataIntensiveAppInfrastructures (06 Feb 2018, AnneHelmond)Edit Attach
Mapping Data-Intensive App Infrastructures
Team Members
Anne Helmond, Fernando van der Vlist, Esther Weltevrede, Lonneke van der Velden, Michael Dieter, Nate Tkacz, Peter Kun, Sultan Çİl, Jason Chao, Ilja van de Rhoer, Jonathan Murthy, Elodie Mugrefya, Giacomo Flaim, Emile den Tex
Contents
1. Introduction
The project named Mapping Data-Intensive App Infrastructures took place in the context of the 2018 Digital Methods Winter School data sprint organised by the Digital Methods Initiative in Amsterdam. This 2018 Digital Methods Winter School evolved around the theme of Social Lives of Digital Methods in forms of Encounters, Experiments and Interventions. The project aimed at mapping infrastructures and data flows in the context of mobile apps. This aspiration came from the observation of a significant growing use of mobile phones (pewglobal.org) along with the assessment of a rather small number of researches examining the data-flow infrastructures of mobile apps (Rogers 2013). Therefore, this research is an endeavour to produce extended research methods, notably in the development of specific tools intended to the study of app infrastructures, so that more automated, larger scale and comprehensive methods can be developed for the study of those infrastructures. The research focused on specific kinds of data namely intimate data, financial data and popular data embodied by, non-exhaustively, dating, pregnancy, depression, std, games, bitcoin and blockchain apps. This peculiar data flows precipitated the advent and spread of the intimate data economy. The project final goal was to map the app infrastructures technologies and the contents of the data transmitted through those technologies. In order to do that, the app pyramid model created for the occasion served as a guideline through the whole project. This model incorporates three levels. Firstly, the base is the apk file analysis which consists of file scanning with the help of the App Tracker Tracker tool developed by the Digital Methods Initiative. This step represented most of the manual work. Secondly, the middle level is the network sniffing purposed at recording all the incoming and outgoing connections along with their IP addresses for each of the apps. This network sniffing step required the team to use the paid tool Network Connections. Finally, the third level takes a close look at the content of the packages previously sniffed characterised by unencrypted HTTP connections. This step allowed the project members to investigate the results and eventually produce an analysis of the outcomes with substantial meanings.2. Initial Data Sets
Google Play Store: Top 50 apps across different categories and queries:- Intimate data: Queries: [addiction], [depression], [pregnancy], [std], [stress]; Categories: Dating
- Finance data: Queries: [bitcoin], [blockchain], [remittance] (apps enabling e.g. diasporic groups to send money home)
- Popular data: Category: Games (free)
3. Research Questions
The main objectives of this project are:- To develop, revise, and/or document methodologies for tracing inbound or outbound data flows and charting data-intensive infrastructures for mobile and web sources;
- To characterise the distinct types and nature of data-intensive infrastructures and to compare their features and uses in mobile and web environments.
- To develop and test a research tool and method for detecting tracker presence using app repositories (APK archives).
- In what ways are data-intensive mobile infrastructures specific as compared to their counterparts on the web in terms of features, technologies, actors, and the scales at which they operate?
- What constitutes a mobile fingerprint (e.g., in the context of advertising)?
- How are distinct data-intensive infrastructures interconnected and layered? What technologies and actors are involved?
- How can app repositories (e.g., APK archives) be repurposed for research into tracker presence?
4. Methodology
The methodology for this project was largely experimental and based off of trying to design and refine a future method for studying data-intensive app infrastructures. Because of this much of the data collected and encoding or labeling of categories was done manually as well as repurposing certain tools or techniques which need to be modified or improved.Query design
Our initial dataset drew from Android apps found in the Google Play Store. Android apps were selected over the Apple AppStore because we can directly observe the .apk (Android Package Kit) files and investigate the trackers within it while OS apps do not allow for this level of investigation. Keywords were queried based off the concept of sensitive or intimate data. From there we formed subgroups divided into intimate data (keywords queried included: depression, addiction, sexually transmitted disease, stress, pregnancy, and dating), finance data (keywords queried: bitcoin, blockchain, and remittance), and popular data (games). Each keyword was chosen by a participant to work on. The last of these subgroups was formed primarily because of recent news of software embedded into gaming apps which repurposed that machine’s processing power and energy resources when not in use to assist in cryptocurrency mining (www.forbes.com). We hoped that this methodology would reveal this kind of interaction. Each query downloaded the top 50 apps from the Google Play Store into our dataset. Initially, www.apkpure.com was used for querying and downloaded these apps because it allowed us to download the .apk files without installing the app itself. However, this method was replaced by using the application Raccoon (http://raccoon.onyxbits.de/) after some downloading errors occurred using the App Tracker Tracker tool. Also,there was the realisation that some of these files might have had other scripts or pieces of software added to it which represented an inauthentic code in comparison to the apps in the Google Play Store. Raccoon was able to pull the .apk files directly from the Google Play Store and thanks to Jason Chao, we were able to extract unaltered .apk files. After those.apk files were obtained, the remainder of our research revolved around using an App Pyramid Model for investigating data intensive app instrustructure. This model was designed by Anne Helmond, Esther Welteverde, and Fernando Van der Vlist.App pyramid model
The methodology for this project was primarily centered around what we referred to as the App Pyramid Model.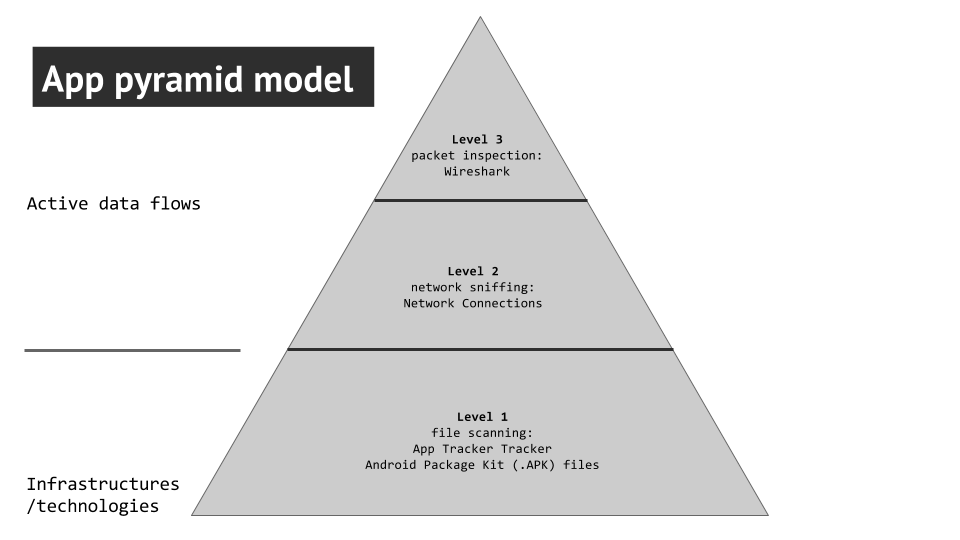 Figure 1: App Pyramid Model for Mapping Data-Intensive App Infrastructures
Using this model we set out three levels or steps for data collection based off of different levels of analysis. This design is largely experimental and thusly the different layers repurposed existing tools alongside manual labor to realise the design.
First layer (infrastructure)
The first layer of the pyramid is based off of the hard-coded infrastructure, technologies involved, and file scanning. This is where the categories (i.e. depression, addiction) or genres (bitcoin) which we queried in the Google Play Store produced the .apk files for each individual app downloaded. As mentioned before, we used Raccoon to download said files in order to not install the apps. Raccoon runs on Linux and Mac OS and required a Java Runtime Environment. Jason Chao created a virtual Linux Machine in the cloud to run the tool. These files had to be gathered manually by the participants in this research project because there was no bulk method for extracting these files. We then had to convert these files into urls capable of being imported to the App Tracker Tracker tool. An experimental workaround found by Peter Kun was implemented by putting all the .apk files into the dropbox application and extracting a dropbox link. Again, this step had to be performed manually. Those links were ran through the App Tracker Tracker tool, a variation on the Tracker Tracker tool repurposed by Emile den Tex. The App Tracker Tracker tool similarly looks for the “regular expressions” of particular trackers found in the Exodus database (https://reports.exodus-privacy.eu.org/trackers/). It should be noted that this database is incomplete and many of the companies making these trackers were French. These known trackers were categorised by advertisements, analytics, customer interaction, data management platform, development and testing, and social media.Second layer (network sniffing)
After we collected the known trackers observed in each app we moved to the next layer: Network Sniffing. In order to do this we had to condense our top 50 apps into 5 which either had the most trackers found or were most downloaded in the Google Play Store. We downloaded those apps onto a research phone with google research account directly from the Google Play Store. The app Network Connections was also installed onto the research phone to track the IP addresses which were sending and receiving data based on our interactions. Each participant used the phone to interact with the apps they chose and mostly consisted of using the app normally, signing up for whatever services were offered, or trying to provoke ads. The batch IP addresses look up tool ipbulklookup was then used in order to see what companies and locations were associated with each IP address (https://nl.infobyip.com/ipbulklookup.php). Those companies were categorised as either dealing with advertisement, analytics, content delivery networks, or hosting companies. We then mapped out the most prominent Remote IPs (ISPs).Third layer (packet inspection)
The last step in our pyramid required the assistance of Emile den Tex and the Digital Methods Initiative wifi network. This network was desired because it provided an unprotected network which allowed us to see what kinds of data was being sent from the research phone to the IPs found in the previous section. Using TCP Dump, Emile set up a system for capturing what packets were being sent from the research phone. Similar to the method in the second layer, individual participants interacted with the research phone and the top 5 apps for each given genre in order to provoke packet switching. After this step, Wireshark was then used to open the file produced by TCP Dump and investigate each packet. We primarily looked at packets using port 80 or http security protection to see what kinds of data is vulnerable or susceptible to be collected by third parties. In each of those packets, we found different or undefined parameters to see if there was similarities in the types of data being sent by unencrypted connections.Theory
The research in this paper engages with what Gerlitz & Helmond (2013) have described as data-intensive infrastructures. Whereas the web emerged as a technically open architecture, being decentralised, lacking technically defined or enforced boundaries (Celik 2010), the web slowly transitioned in the early 2000’s in what was then coined web 2.0 (O’Reilly 2005). Instead of the page-based web model of the earlier decade the web began to reemerge as a platform driven infrastructure. The new features of the web were based on linking websites and users and emphasising participation in the form of creation and exchange of user-generated content (Langlois, McKelvey & Elmer, 2009). These platforms were built on a visible and explicit logic of connectedness, sharing information and content between users while building an implicit and invisible infrastructure of connectivity based on analytics algorithms, web buttons and APi’s for collecting and sharing user-data to third parties (Van Dijck 2013). This alternative fabric, based on the technical connection and sharing through data-flows in the back-end, focused on metrifing en intensifying user affects are the basis of these data-intensive infrastructures. Research on data-trafficking on webpages of the open or public web has been quite established (Marres & Weltevrede 2013) and research to enclosed parts of the web that need some sort of authentication has been developed as well in the form of API research (Lomborg & Bechmann 2014). Yet research to the data-exchange infrastructure of mobile apps has been little explored in order to understand the medium specificity, its ontological distinctiveness (Rogers 2013) of these technologies and how they are part of and differ from the broader data-intensive infrastructure of the web. Light et al (2016) have developed a first approach to understanding the invisible data-traffic in their walkthrough method which involves “establishing an app’s environment of expected use by identifying and describing its vision, operating model and modes of governance” (1). It does this systematically step-to-step analysis of the various stages involved in app usage while recording the data being generated. Because “For every explicit action of a user, there are probably 100+ implicit data points from usage; whether that is a page visit, a scroll etc.” (Berry 2011, 152). Although this method is useful, it is nevertheless a very partial analysis mostly based on interface analysis. Yet the earlier mentioned app pyramid model can give a further and layered understanding of how data is being trafficked via apps. The pyramid model approaches data-trafficking on two levels: a passive infrastructural/technological level and an active tracking of data flows. Apps have been little researched, partly because they are only started to get to prominence around 2008 (Light et al 4), but also because their technologies have been locked-of. What is needed in order to understand data-flows are the physical infrastructures, devices, protocols, servers through which data is being trafficked “the material sites and objects that are organised to produce a larger, dispersed yet integrated system for distributing material of value” (Parks 2015, 355). By retrieving the mobile applications as APK files it is possible to understand how the operation of data flow is hardcoded in the framework of the apps. The second level is the tracking of data-flows in order to follow the data back from the apps to their services and third parties and to understand them as part of the wider data ecology (Gerlitz & Helmond 2013, 11). Understanding both where the data flows to and with whom and what is shared will generate critical insight into what data is, for what purposes it is used and how to regulate the ‘free flow of information’. Apps matter because they reflect our cultural values, bring multiple actors including users, developers and advertisers into an interaction space and communicate meanings that shape our everyday practices (Light et al 2016).5. Findings
Once we counted the number of tracking technologies per app and per space, we found that some tracking technologies are very infrastructural to all spaces. App analytics being the most conspicuous.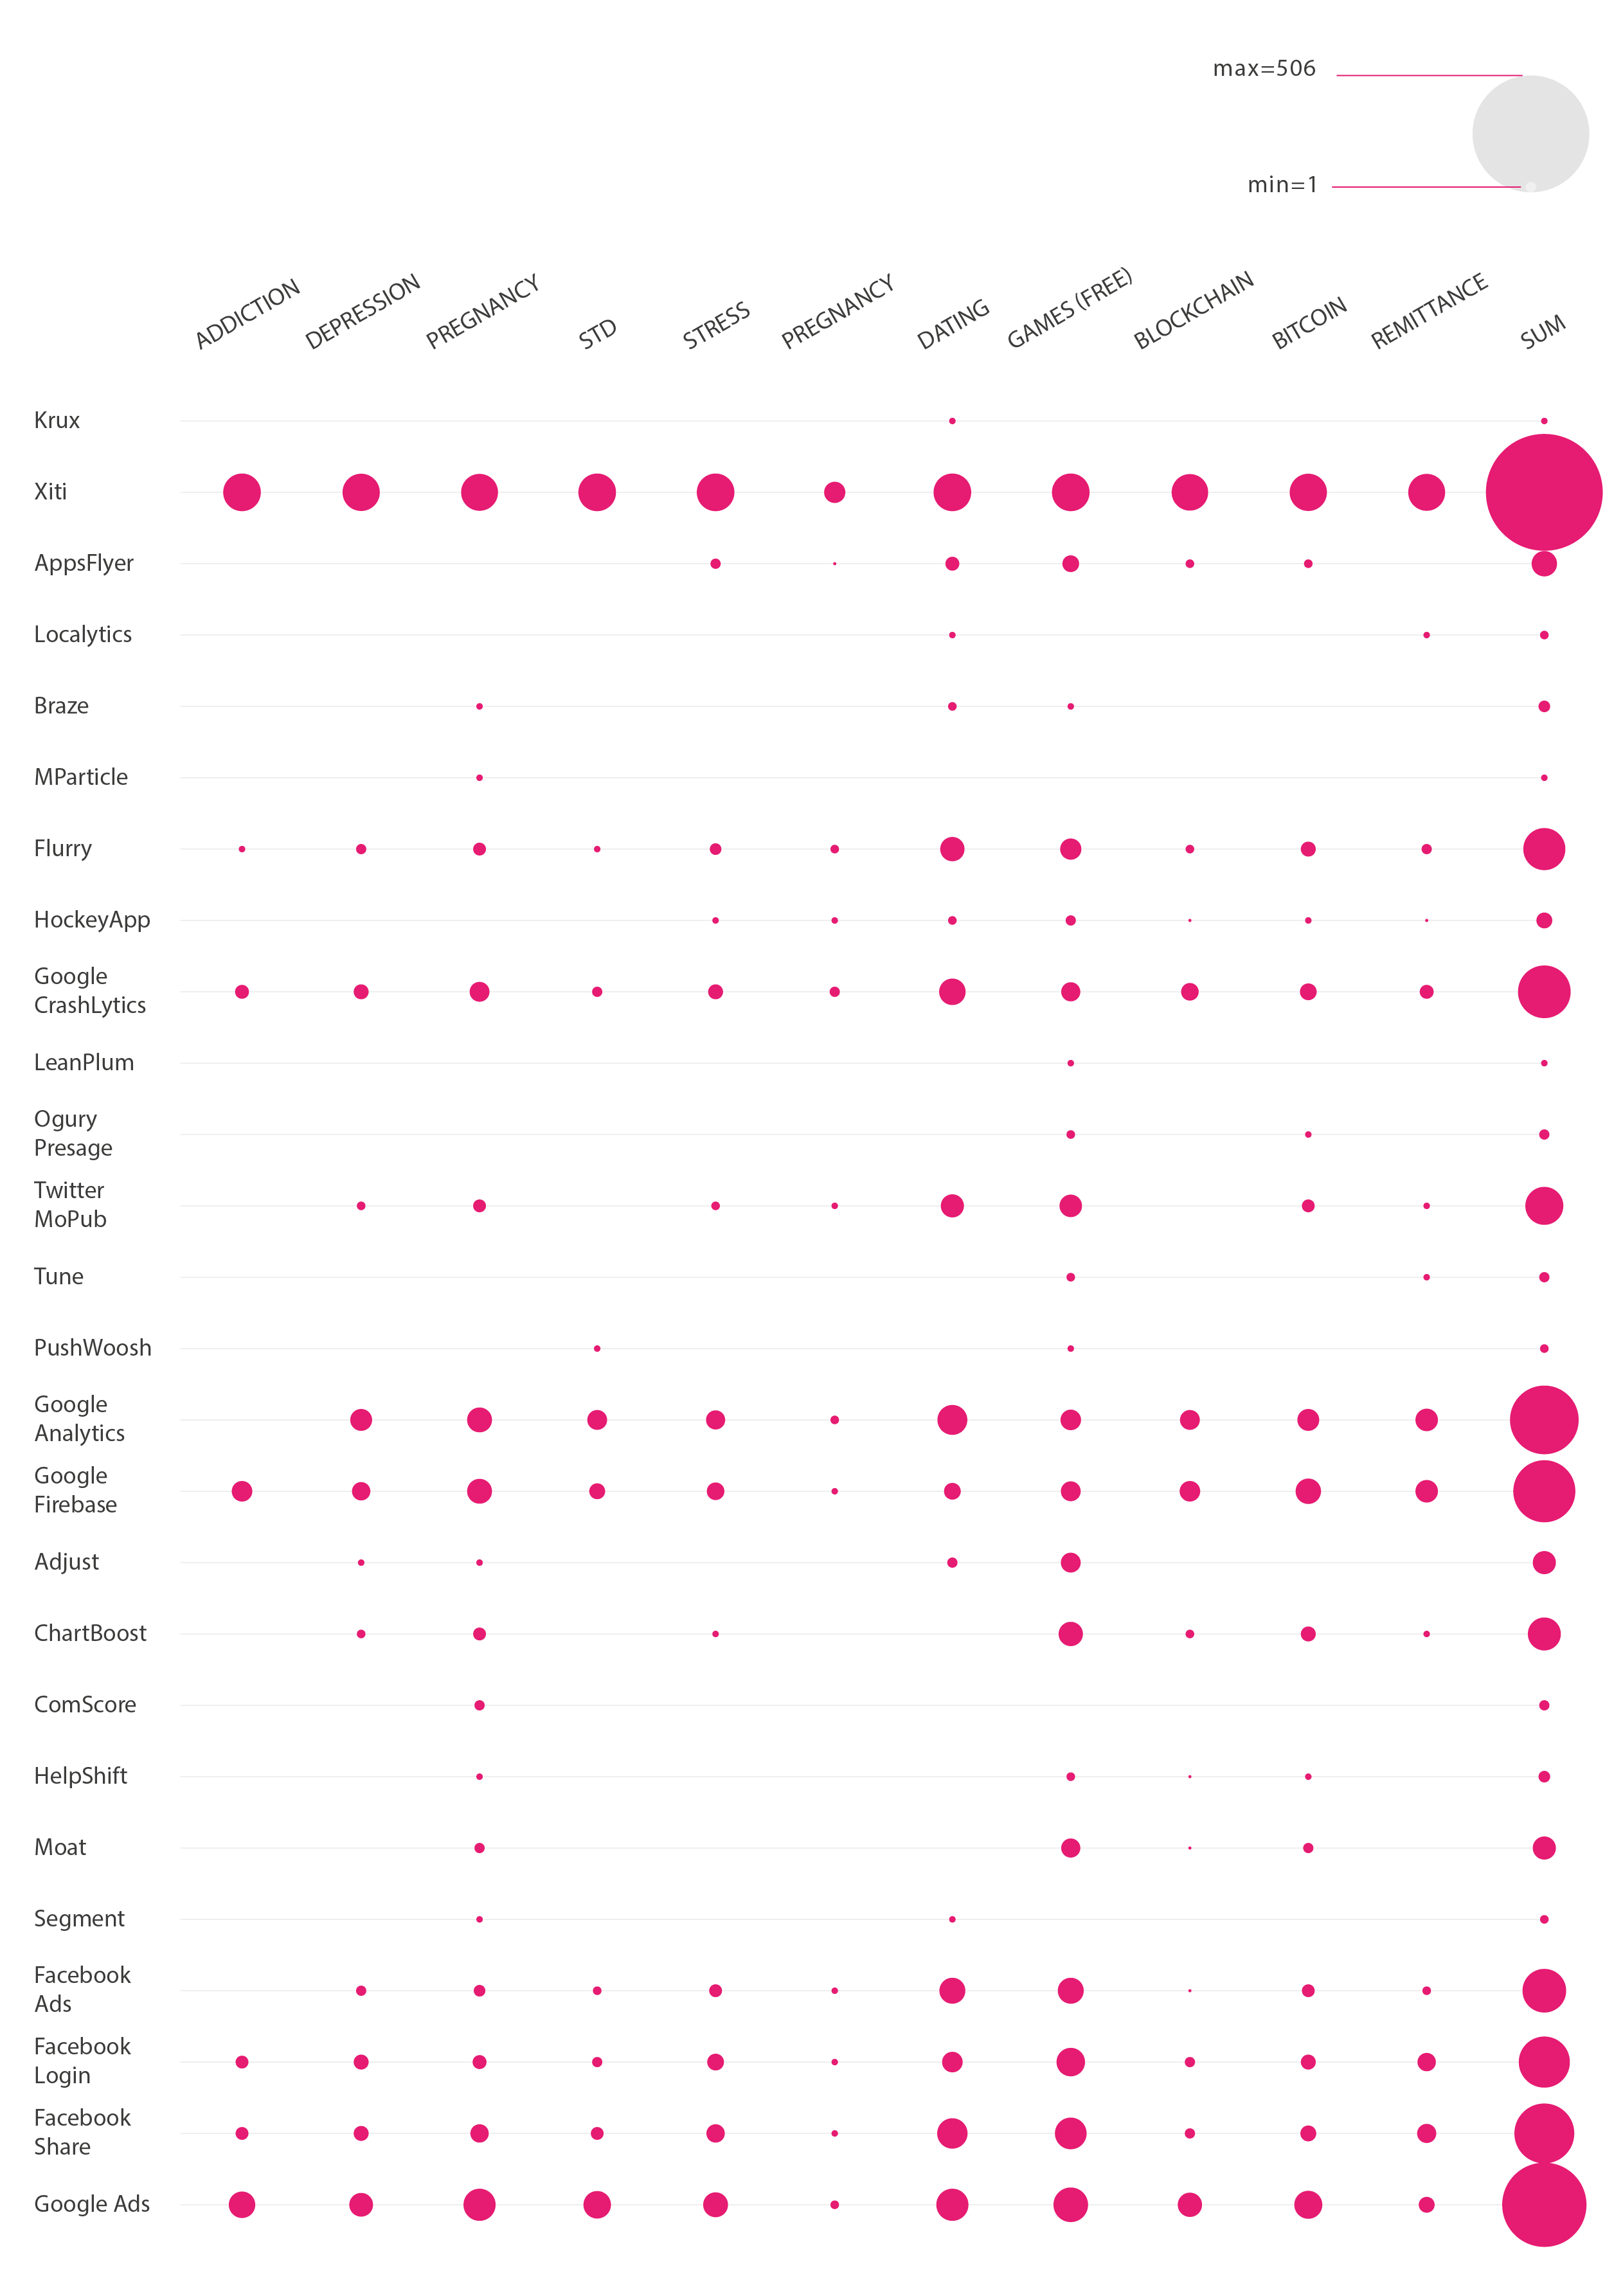 Figure 2: Infrastructure Technologies in Top Apps (by query)
These infrastructural technologies are mostly found in games, dating and bitcoin and found the least in the pregnancy space but we did found that within those pregnancy and games spaces there were some very unique trackers. It must be noted that games are very experimental which eventually brings new tracking technologies. Once categorising the tracking technologies into the following clusters: advertising, analytics, customer interaction, data management, development and testing and social media, we found that analytics, which are the most important, focus on the development and the testing of these apps.
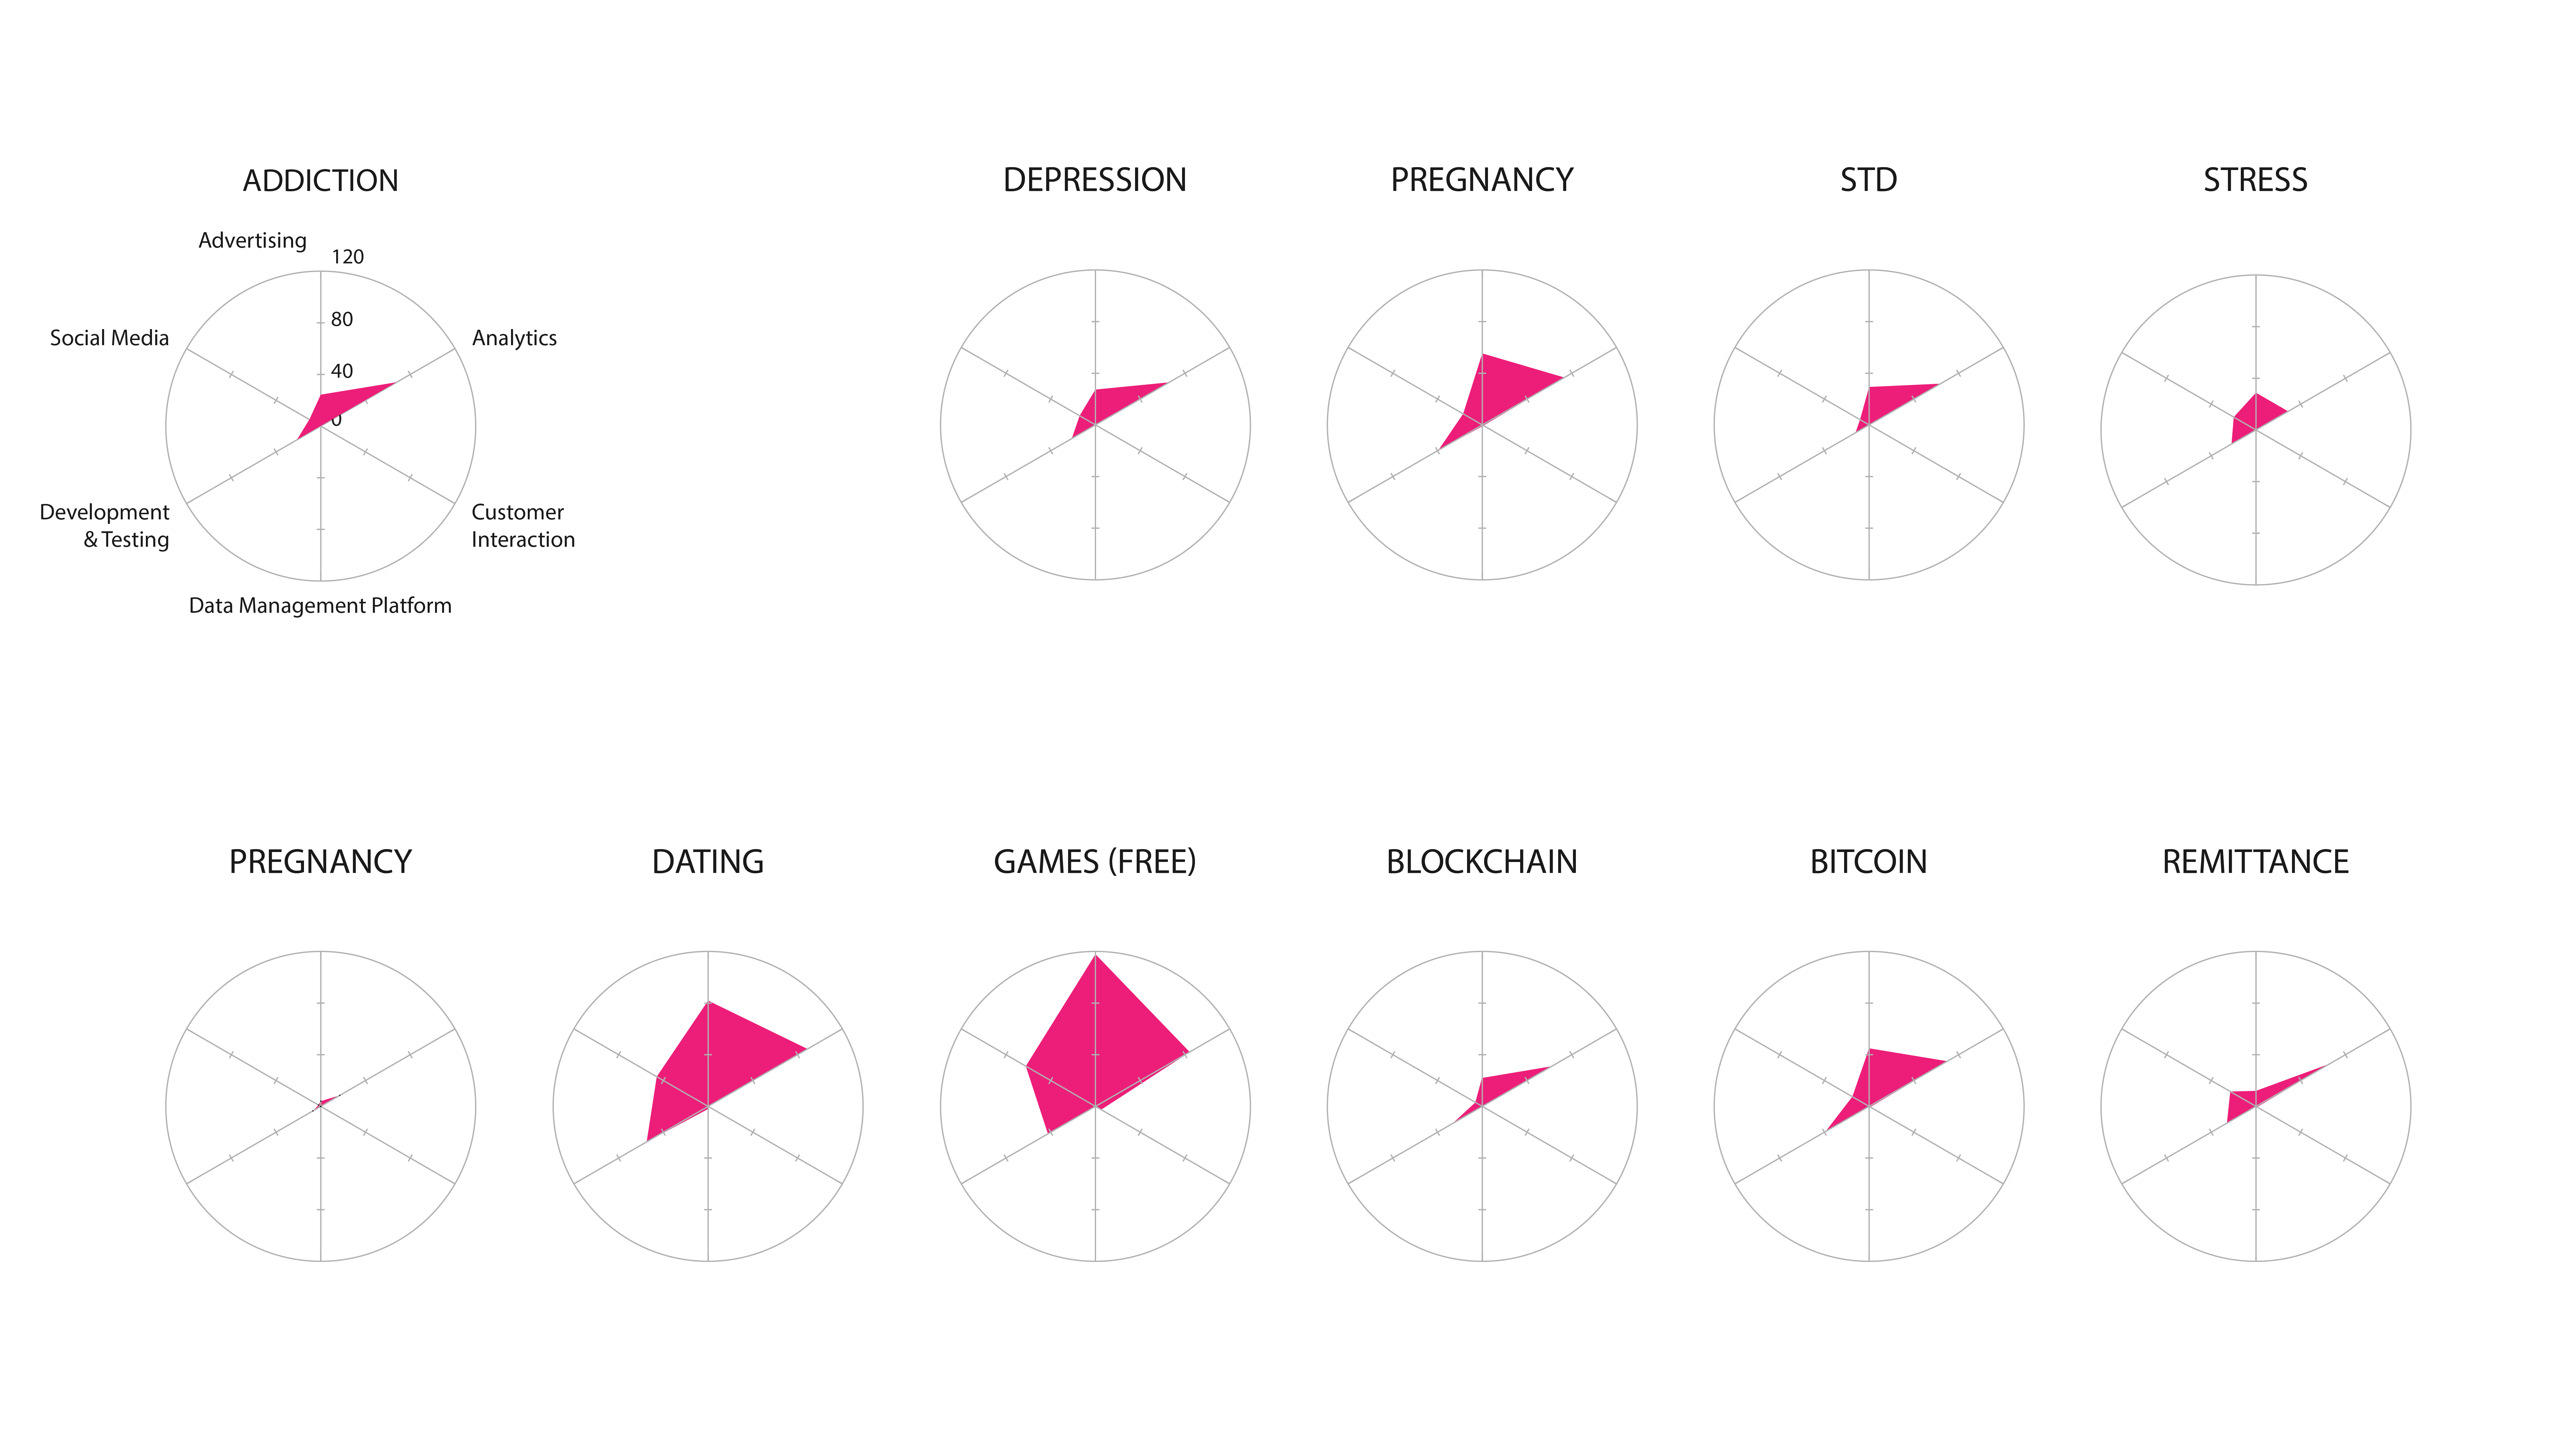 Figure 3: Categories of Infrastructure Technologies (per query)
Thanks to the tool Network Connections that live captured all the data connections being made while using the apps, an analysis was executed of the exported csp file. We classified the kind of data connections namely by a categorisation of the third parties and the outgoing data connections. This made possible the mapping of the scanned set of maps that once analysed, exhibited the cloud storage providers and the content delivery networks as the most prominent features.
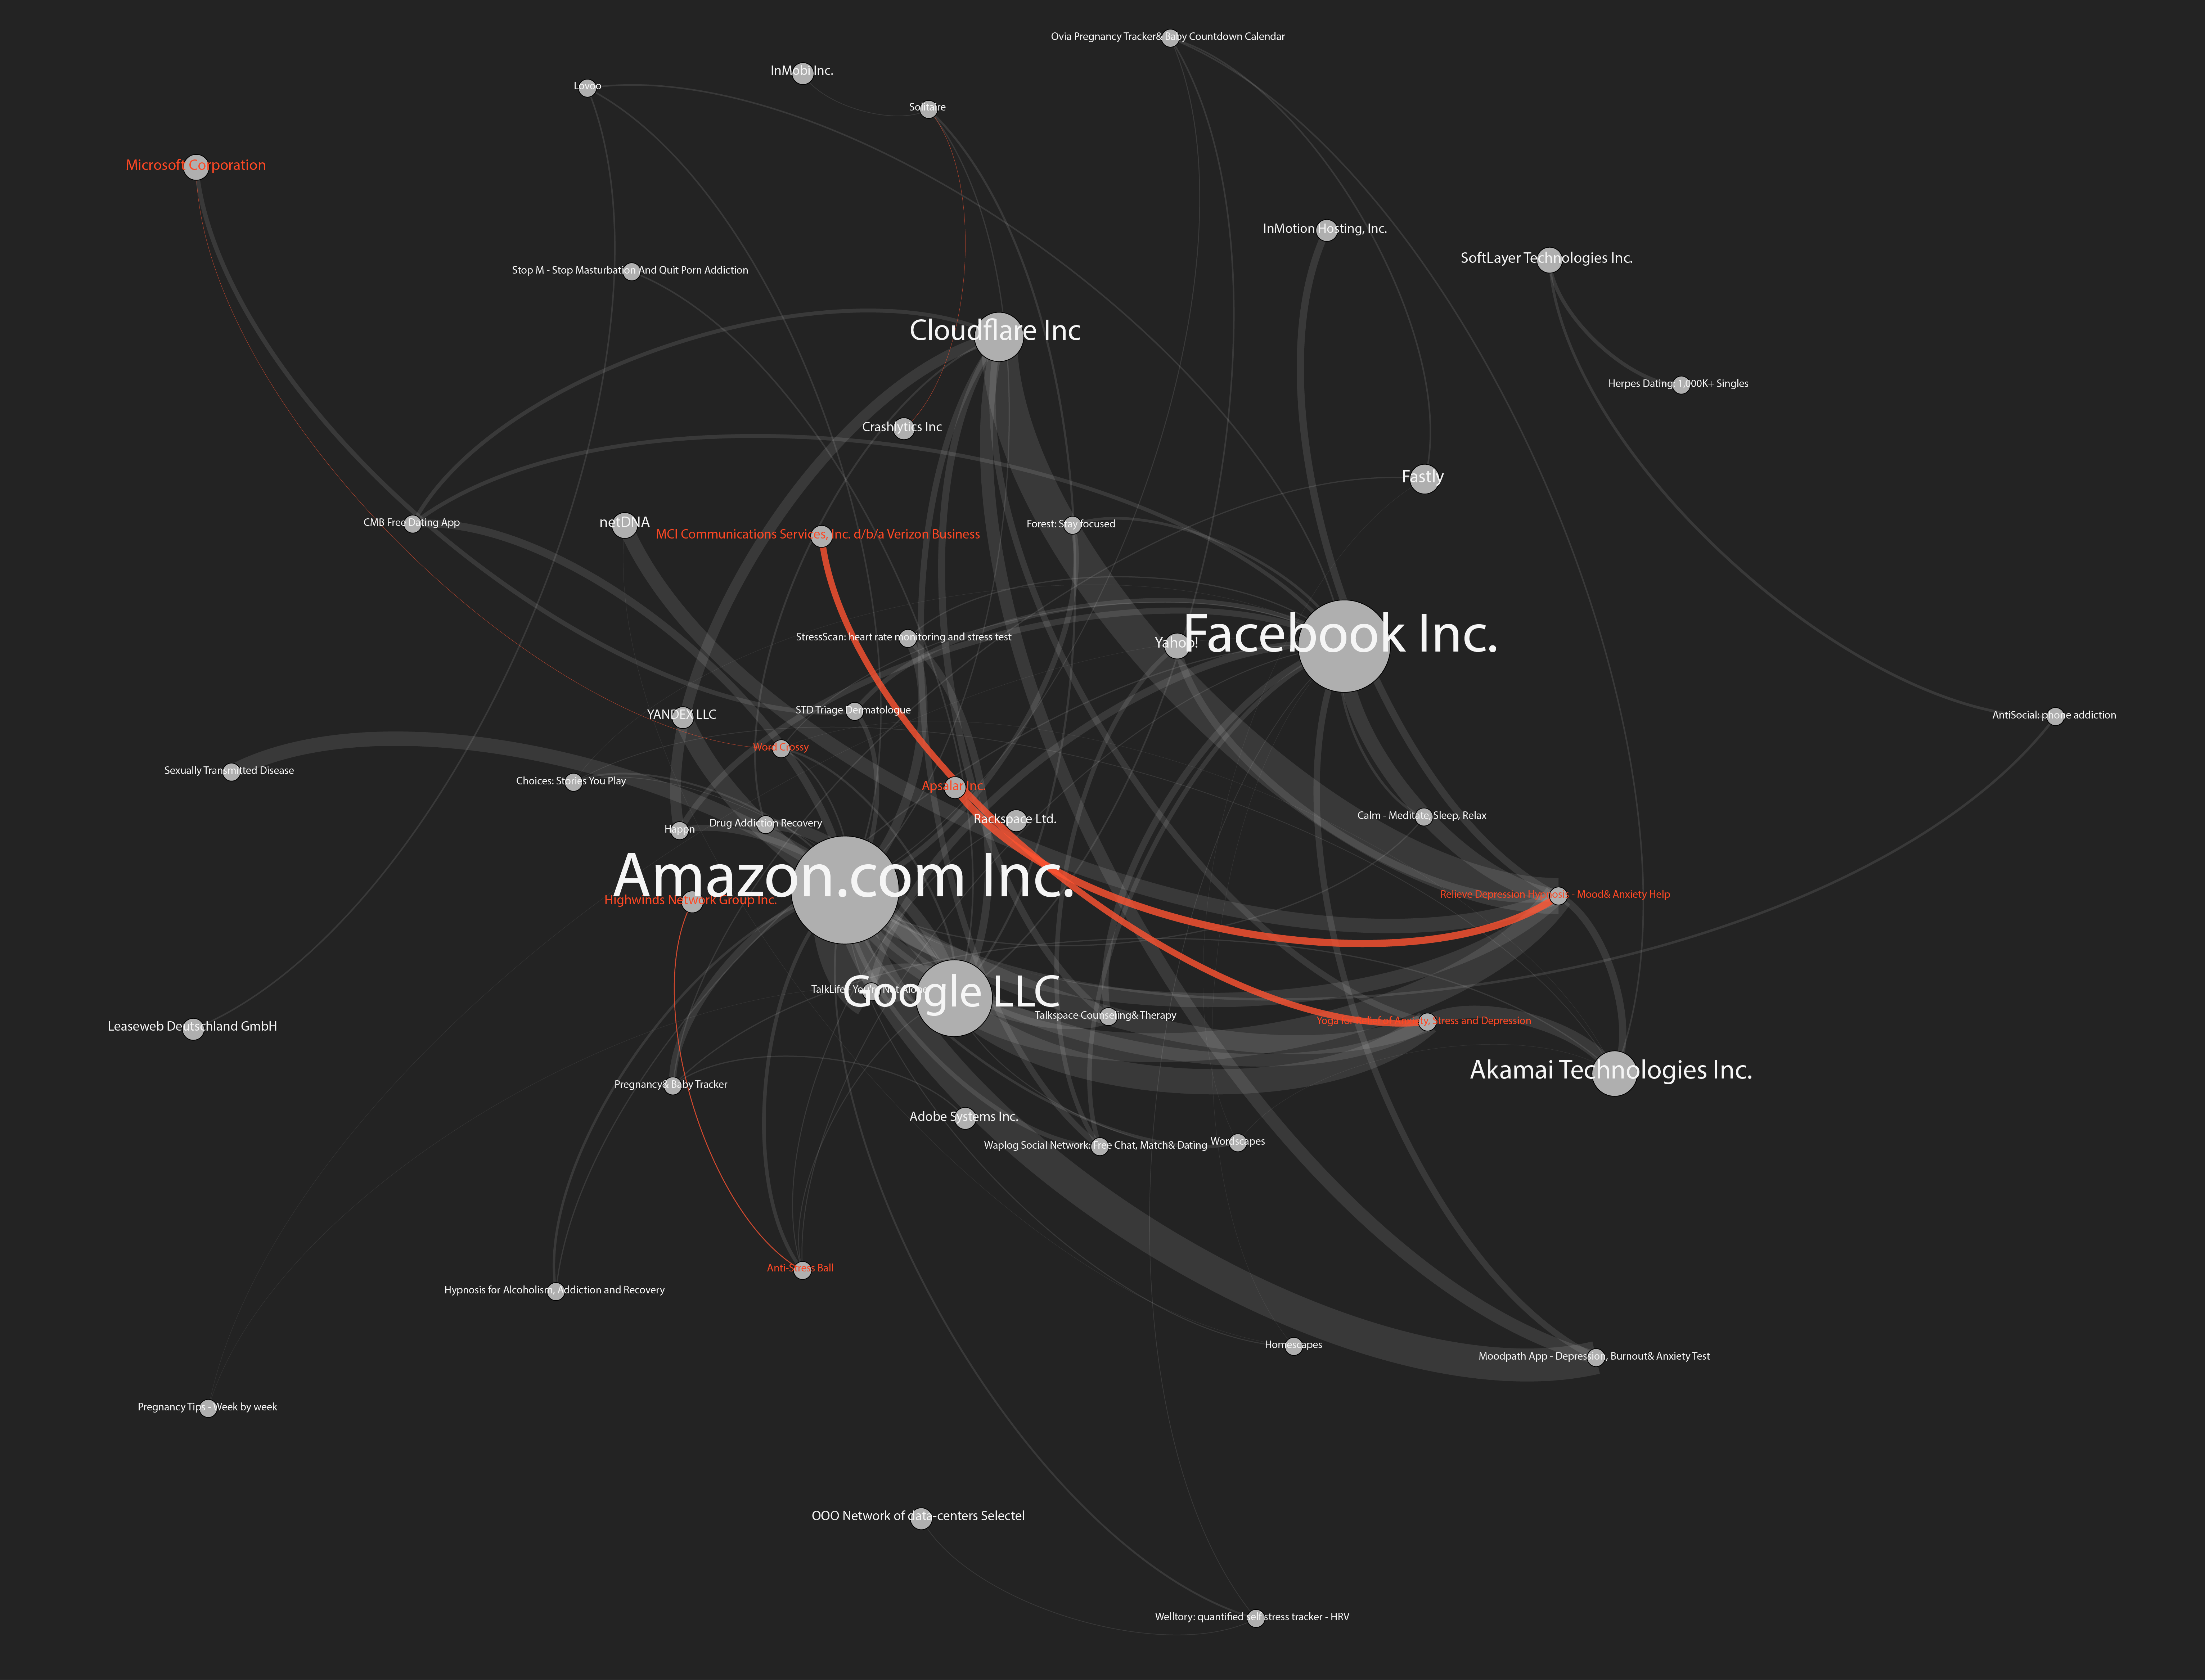 Figure 4: Network Connections to Remote IP’s (ISPs)
Next to that, we found high presence of facebook logins and cloudflare which is for the protection and security of content delivery network. We categorised the types of infrastructures into hosting, advertising, analytics and content delivery networks. It was found that hosting and content delivery networks were the most notables. It could be said that it is very specific to the app space where one might want to have an app as small as possible thereby outsourcing the content to external platforms such as content delivery networks.
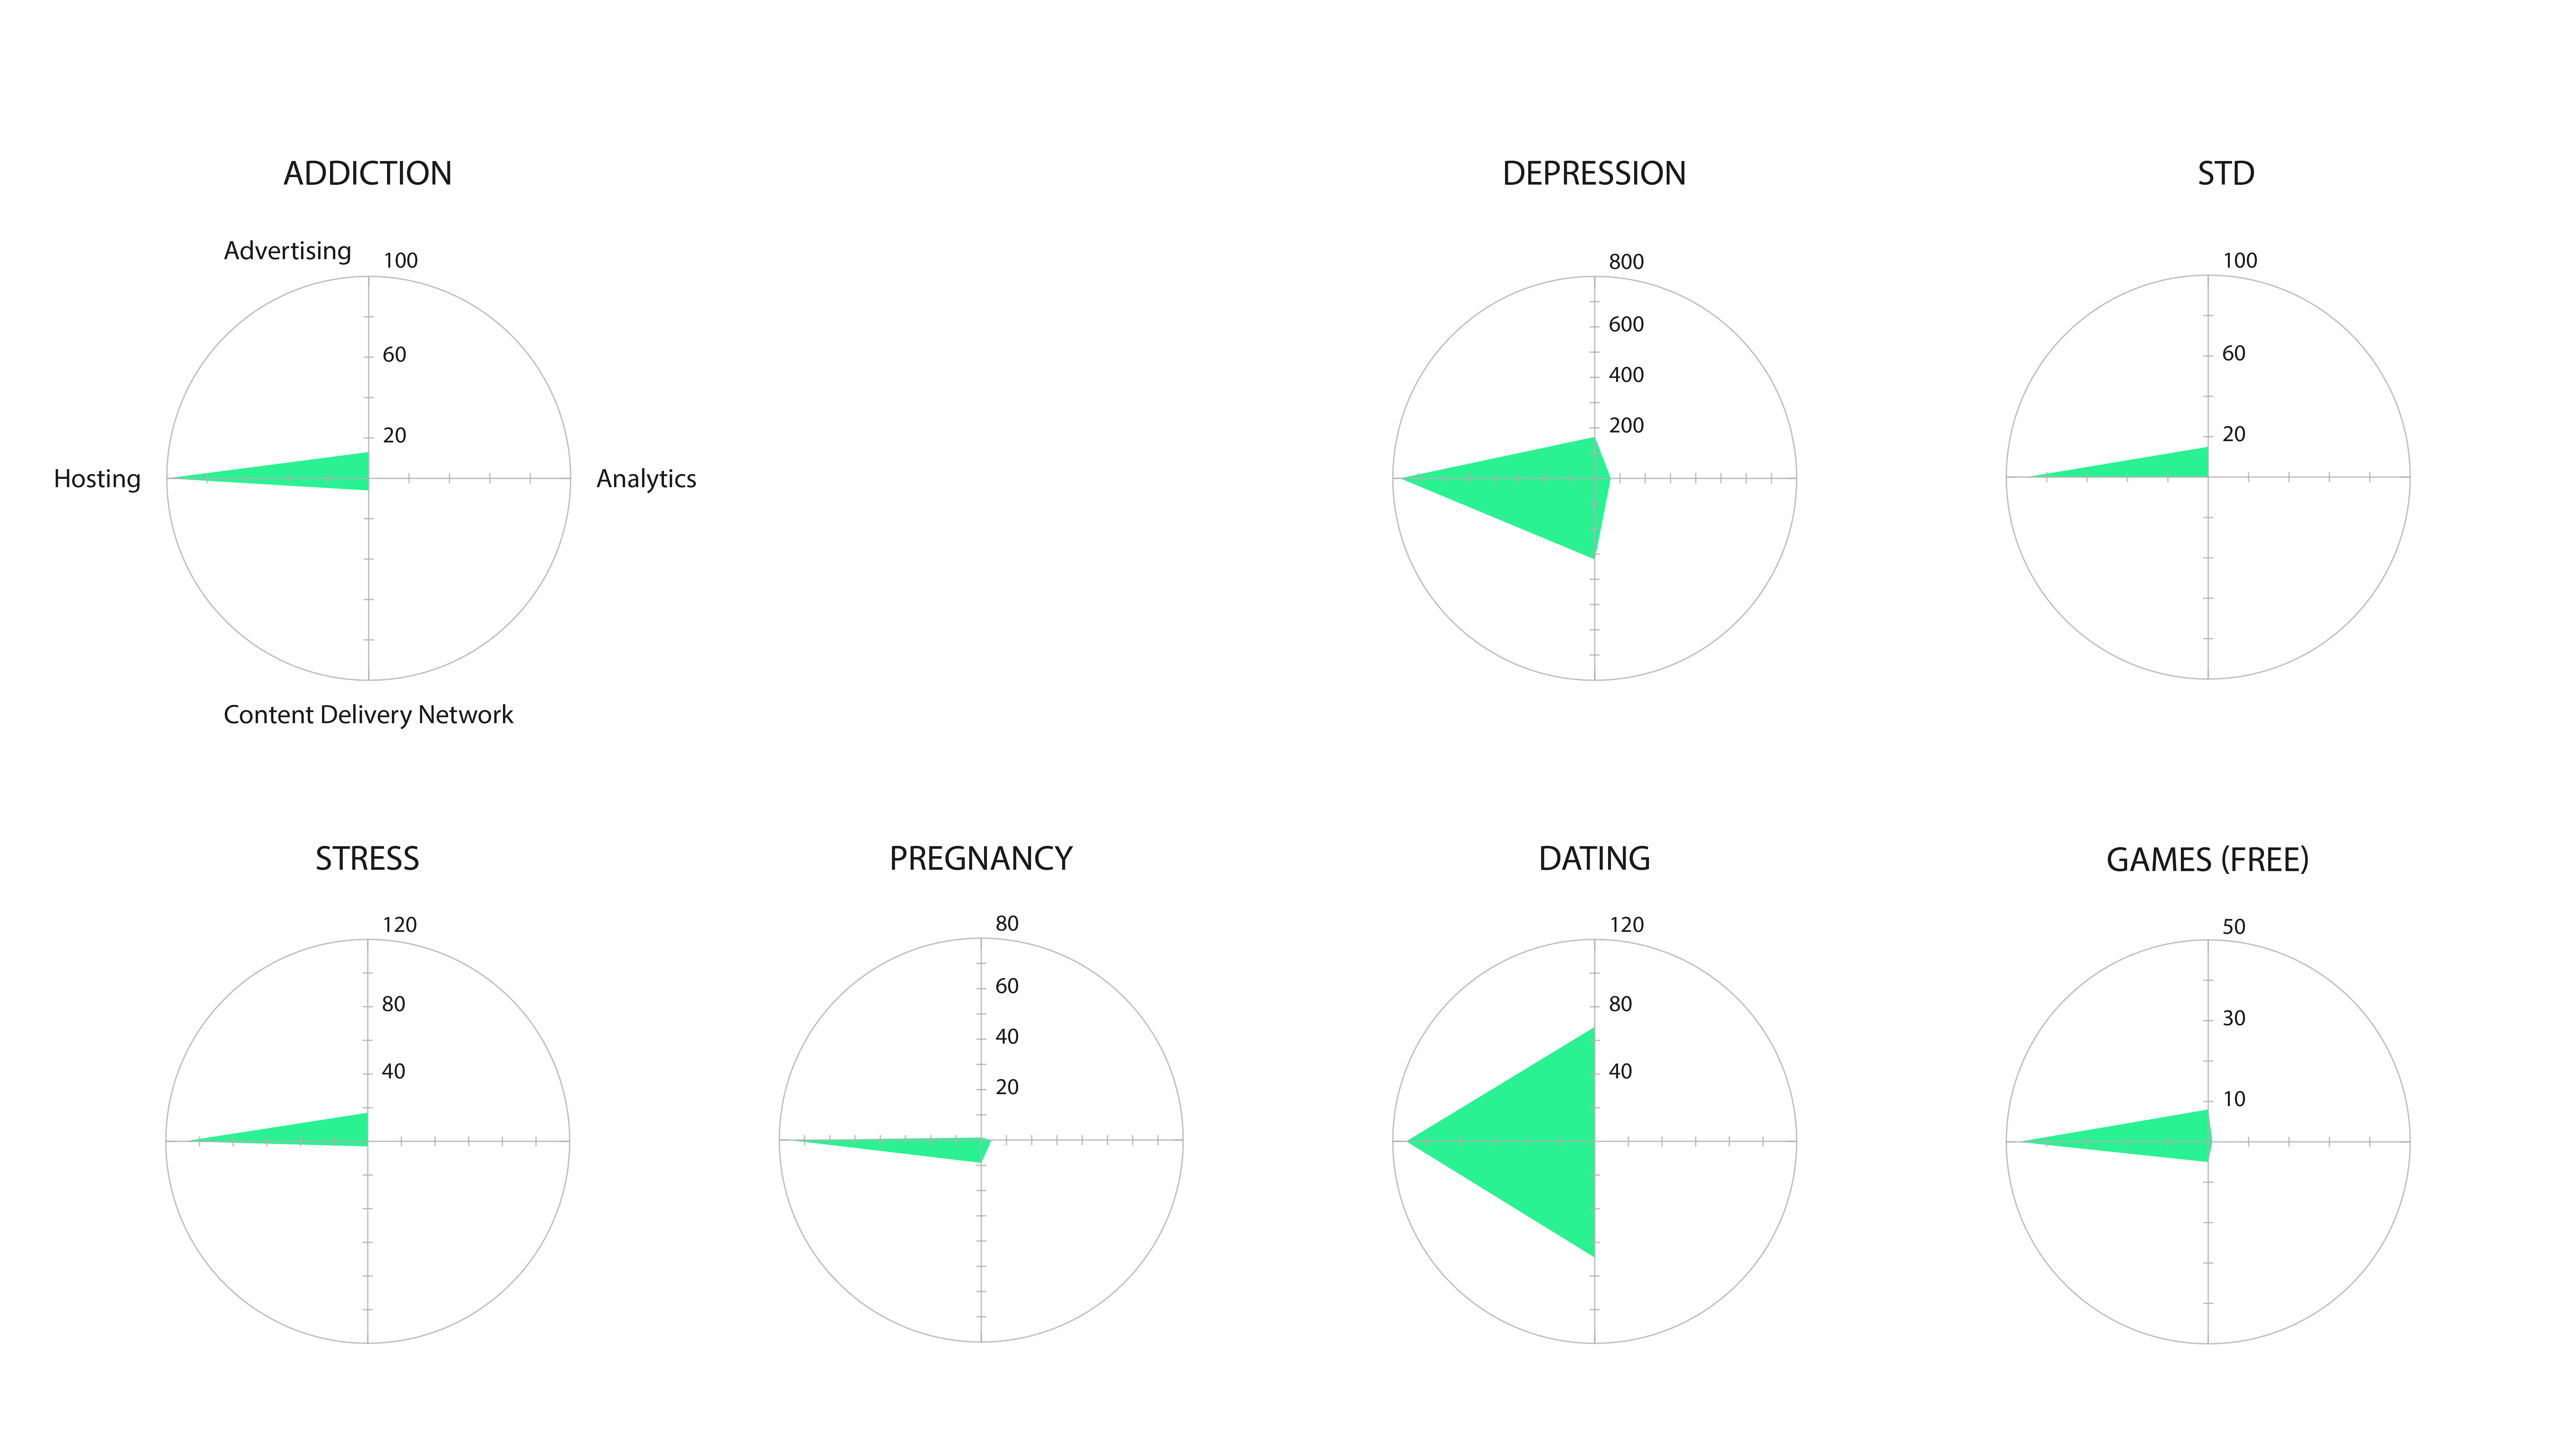 Figure 5: Categories of Infrastructure in Remote IP (ISPs)
Eventually, there were a rather small amount of data available since many of the HTTP connections were encrypted. This is of interest since previous research during the 2017 Summer School of Digital Methods Initiative demonstrated a higher number of unencrypted HTTP connections (Weltevrede et al. 2017). In conclusion, the significant findings are that infrastructure technologies are hard coded into the apps. Data flows are dynamic, so several methods are necessary for the study of those flows. The prominence and diversity of advertising and analytics companies is very notable and the security in the app space has significantly tightened compared to previous researches.
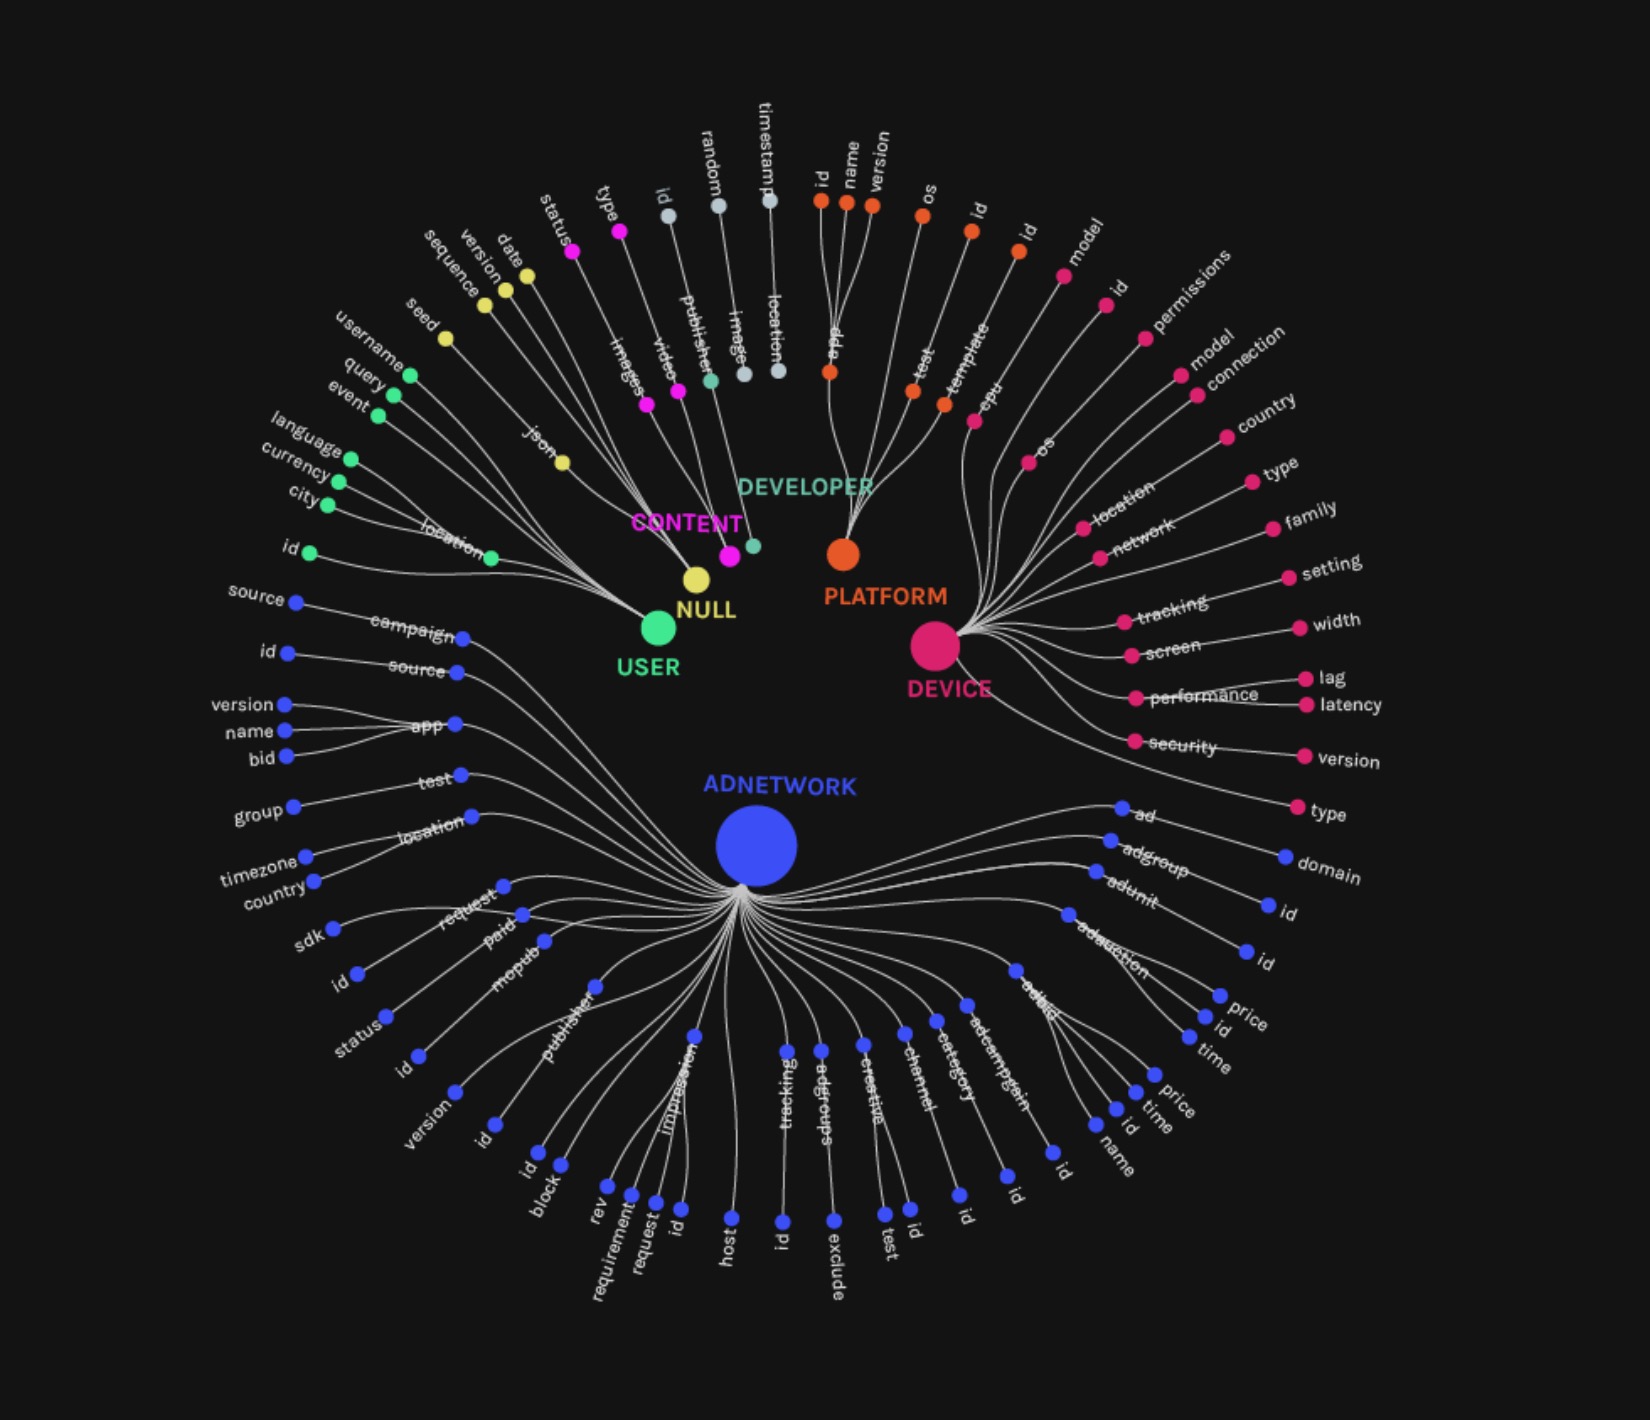 Figure 6: Categories of query parameters in HTTP requests
Finally, we examined the contents of query parameters in unencrypted HTTP requests (port 80). We found four main categories related to advertising: ad networks, user, device, and content delivery. Most interestingly, we could see ad publisher names, companies bidding for ads and users, as well as prices charged for ads.
7. Discussion and conclusions
During the Digital Methods summer school 2017, a few first explorations have been made to explore data-intensive infrastructures. Then a strong focus was put on web sources, cloud infrastructures and tracking of data apps. The results of this project was to expand and develop tools, methods and protocols for analysing apps in the wider, in most cases invisible, infrastructure of data-trafficking. Because apps have their own medium-specificity (Rogers 2013) they can’t be simply approached through earlier methods. By developing tools and methods specifically for mobile app, a better understanding is created of both the passive technological infrastructures and active data-flows. Looking at the apps environment (Light et al 2016) and the broader data ecology (Gerlitz & Helmond 2013) has resulted in a diverse and more active web of trackers and third parties, especially advertising and analytics companies. Analytic trackers were so dominants in the app ecology that they could be described as being infrastructural or hard-coded in the apps themselves and can be taken as basic parts of the range of intimate apps. Although the infrastructural basis of analytics and advertising is a new discovery, it isn't surprising within the broader data ecology in which data has been discovered as being both informational and able to be commodified (Van Dijck et al 2016). Intimate data, like any other personal data can be tracked, followed and stored (Agre 1994). “Big data” is the result of a specific technological imaginary that rests on a mythological belief in the value of quantification and faith in its ability to model reality (boyd and Crawford 2012). Mapping data-flows and third parties involved can generate a better understanding of this technological and economic phantasy and to create a critical stance towards it. One of the big problems we are facing and which will continue to be problematic is obfuscation and blackboxing of apps. As our research showed, apps are better secured which seems a positive thing because data generated on apps is harder to be extracted. Yet in order to be able to understand and take measure against the proliferating misuse of data-flows, insight is needed into these data-flows. The result is that researchers constantly have to adjust themselves to the changing data ecologies, repurposing and changing their methods and tools to be able to analyse the newests changes and challenges to be able to keep mapping the data-flows.8. References
- “Ad Request Parameters.” docs.openx, 7 June 2017, https://docs.openx.com/Content/developers/ad_request_api/adtagguide_para meters.html. Accessed 15 Jan. 2018.
- Agre, Philip E. “Surveillance and Capture: Two Models of Privacy.” The Information Society, vol. 10, no. 2, 1994, pp. 101–127.
- Berry, David. Philosophy of Software. London: Palgrave Macmillan, 2011
- Boyd, Danah, and Kate Crawford. “Critical Questions for Big Data.” Information, Communication & Society, vol. 15, no. 5, 2012, pp. 662-679
- “Download APK Free Online Downloader.” APKPure, https://apkpure.com/. Accessed 15 Jan. 2018.
- Celik, Tantek. “What is the Open Web” Tantek, 8 Nov. 2010, http://tantek.com/2010/281/b1/what-is-theopen-web. Accessed 18 Jan. 2018.
- Dacal, D., Dancheva, K., Gerlitz, C., Helmond, A., Minucci, S., Niederer, S., van der Velden, L., and Weltevrede, E. (2012, July). Field Guide to Trackers and the Cloud. Digital Methods Summer School 2012. Retrieved from https://wiki.digitalmethods.net/pub/Dmi/TrackersGuide/TrackerGuide_reduced.pdf.
- Gerlitz, Caroline, and Anne Helmond. “The Like economy: Social buttons and the Data-Intensive Web.” New Media & Society, vol. 15, no. 8, 2013, pp. 1348–1365. https://doi.org/10.1177/1461444812472322.
- Greene, A., Benedetti, A. Gobbo, B., Krassen, C., den Tex, E., Weltevrede, E., Jansen, F., Flaim, G., Coanda, I., Della Bianca, L., Teeling, L., Liu, L., Ojala, M., Barry, P.H., Stoffel, R., Boas, S. & Thorsen, S. (2017, July). Dat[a]ing: Mapping data ecologies of the dating industry. Digital Methods Summer School 2017. Retrieved from https://docs.google.com/presentation/d/1A4aSzqyaRpzzzCkJKvgox9WZVfgQ-_k2-I-o2ox4mbI/edit?usp=sharing.
- “First European Directory of Health Apps Recommended by Patients and Consumers.” European Commission, Digital Single Market, 2012, https://ec.europa.eu/digital-single-market/en/news/first-european-directory-h ealth-apps-recommended-patients-and-consumers. Accessed 9 Jan. 2018.
- Fox-Brewster, Thomas. “This Russian Has The Power To Turn 100,000 Android Phones Into Cryptocurrency Miners.” Forbes, https://www.forbes.com/sites/thomasbrewster/2017/11/08/google-android-cryptocurrency-miner-launched-by-russian/. Accessed 15 Jan. 2018.
- “Domein en IP bulk zoek tool.” nl.infobyip, nl, 2018, https://nl.infobyip.com/ipbulklookup.php, Accessed 18 Jan. 2018.
- Langlois, Ganaele, and Greg Elmer. “The Research Politics of Social Media Platforms.” Culture Machine, 2013, http://www.culturemachine.net/index.php/cm/article/view/505. Accessed 18 Jan. 2018.
- Light, Ben, and Jean Burgess, and Stefanie Duguay. “The Walkthrough Method: An Approach to the Study of Apps.” New Media & Society. 2016, pp. 1-20. https://doi.org/10.1177/1461444816675438
- Marres, Noortje, and Esther Weltevrede. “Scraping the Social?” Journal of Cultural Economy, vol. 6, no. 3, 2013, pp. 313–35.
- “MoPub OpenRTB 2.3 Integration Guide.” mopub, 11 sept. 2017, https://www.mopub.com/mopub-openrtb/. Accessed 15 Jan. 2018.
- O’Reilly, Tim. “What Is Web 2.0: Design Patterns and Business Models for the Next Generation of Software.” O’Reilly Network, 2005, http://www.oreillynet.com/pub/a/oreilly/tim/news/2005/09/30/what-is-web20.html. Accessed 18 Jan. 2018.
- Parks, Lisa.“‘Stuff You Can Kick’: Toward a Theory of Media Infrastructures.” Between Humanities and the Digital, edited by Patrik Svensson and David Theo Goldberg, Cambridge, MA: MIT Press, 2015, pp. 335–274.
- “Privacy Code of Conduct on Mobile Health Apps.” European Commission, Digital Single Market, 9 Aug. 2016, https://ec.europa.eu/digital-single-market/en/privacy-code-conduct-mobile-health-apps. Accessed 9 Jan. 2018.
- Pew Research Center. “Smartphone Ownership and Internet Usage Continues to Climb in Emerging Economies.” Washington DC: Pew Research Center, 2016. http://www.pewglobal.org/2016/02/22/smartphone-ownership-rates-skyrocke t-in-many-emerging-economies-but-digital-divide-remains/. Accessed 12 Jan. 2018.
- “Raccoon - The APK Downloader.” raccoon.onyxbits, http://raccoon.onyxbits.de/. Accessed 15 Jan. 2018.
- Rogers, Richard. Digital Methods. Cambridge, MA: MIT Press. 2015
- Van Dijck, José. The Culture of Connectivity: A Critical History of Social Media. New York: Oxford University Press. 2013
- Van Dijck, José, and Thomas Poell, and Martijn de Waal. De Platform samenleving: Strijd om publieke waarden in een online wereld. Amsterdam: Amsterdam University Press. 2016
Presentation slides
| I | Attachment | Action | Size | Date | Who | Comment |
|---|---|---|---|---|---|---|
| |
app-pyramid.png | manage | 32 K | 31 Jan 2018 - 14:31 | PeterKun | App Pyramid model |
| |
level1_bumpchart-whitebg.png | manage | 200 K | 31 Jan 2018 - 14:59 | PeterKun | Infrastructure Technologies in Top Apps (by query) |
| |
level1_radars.png | manage | 614 K | 31 Jan 2018 - 15:17 | PeterKun | Categories of Infrastructure Technologies (per query) |
| |
level2_networkconnections-01.png | manage | 1 MB | 31 Jan 2018 - 15:29 | PeterKun | Network Connections to Remote IP’s (ISPs) |
| |
level2_radars.png | manage | 426 K | 31 Jan 2018 - 15:33 | PeterKun | Categories of Infrastructure in Remote IP (ISPs) |
| |
level3_queryparameters.jpeg | manage | 249 K | 06 Feb 2018 - 10:36 | AnneHelmond | Query parameters in HTTP requests |
Edit | Attach | Print version | History: r3 < r2 < r1 | Backlinks | View wiki text | Edit wiki text | More topic actions
Topic revision: r3 - 06 Feb 2018, AnneHelmond
 Copyright © by the contributing authors. All material on this collaboration platform is the property of the contributing authors.
 Ideas, requests, problems regarding Foswiki? Send feedback


