You are here: Foswiki>Dmi Web>ToolDatabase>ToolDorlingMaps>ToolDorlingMapsHowTo (21 May 2009, RichardRogers)Edit Attach
To create a Dorling map: 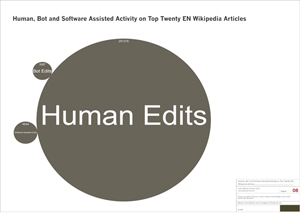 Example: Wikipedia Bots project. This dorling map shows the shares of human edits, bot edits and tools-assisted human edits in the top twenty English language Wikipedia articles.
If you want a double Dorling map (i.e. opening two Dorling maps side by side):
Example: Wikipedia Bots project. This dorling map shows the shares of human edits, bot edits and tools-assisted human edits in the top twenty English language Wikipedia articles.
If you want a double Dorling map (i.e. opening two Dorling maps side by side): 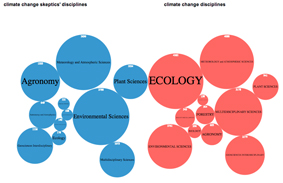 Example: Climate Change Skeptics project. Comparing Climate change science disciplines to climate change skeptics' disciplines.
- Login with your Issue Crawler username.
- Input tags (or phrases) and their values to produce a Dorling Map (i.e. bubble graphs).
- The output is an svg file.
Example: Wikipedia Bots project. This dorling map shows the shares of human edits, bot edits and tools-assisted human edits in the top twenty English language Wikipedia articles.
If you want a double Dorling map (i.e. opening two Dorling maps side by side): - create the two Dorling maps
- write down the ID of the Dorling map you want on the right-hand side.
- Open the map you want on the left-hand side
- Add &map2=## to the url, where ## is the ID number, and press enter.
- The output is an svg file.
Example: Climate Change Skeptics project. Comparing Climate change science disciplines to climate change skeptics' disciplines. 

| I | Attachment | Action | Size | Date | Who | Comment |
|---|---|---|---|---|---|---|
| |
Picture_4.jpg | manage | 68 K | 12 Dec 2008 - 11:35 | Main.issuecrawler14 | |
| |
wikibots_small.jpg | manage | 80 K | 12 Dec 2008 - 11:29 | Main.issuecrawler14 | |
| |
wikibots_smaller.jpg | manage | 44 K | 12 Dec 2008 - 11:39 | Main.issuecrawler14 |
Edit | Attach | Print version | History: r3 < r2 < r1 | Backlinks | View wiki text | Edit wiki text | More topic actions
Topic revision: r3 - 21 May 2009, RichardRogers
Ideas, requests, problems regarding Foswiki? Send feedback